
Abstract
BACKGROUND AND PURPOSE: MR imaging is the method of choice for assessment in vivo of the development of myelination of the human central nervous system. During the first months of life, the myelination process follows well-defined steps, whereas little information exists about the later phases of myelination. To improve our understanding of this aspect and to identify the specific sites involved in the process of myelination in its terminal phase, we evaluated normal MR brain studies in children aged 20–40 months.
METHODS: We retrospectively evaluated 85 MR brain studies of 81 children aged 20–40 months who were without diseases potentially affecting white matter. The MR studies were performed with a 1.5-T system, with T2-weighted spin-echo and turbo spin-echo sequences. Subjective analysis of the signal intensity of the white matter was made in four areas: subcortical frontal, temporal, and parietal lobes and peritrigonal region. Extension of myelination was graded on an ordinal scale; 0 indicated the absence of myelin, and the maximum value indicated complete myelination.
RESULTS: A persistent T2 hyperintensity of the subcortical areas was noted after 20 months of age. With advancing age, a progressive increase in the grade of myelination was noted in these regions, and at about 40 months of age myelination was complete. However, in most of our patients aged 20 months, myelination in the peritrigonal areas appeared complete.
CONCLUSION: The only area that can still exhibit a persistent T2 hyperintensity on MR images at about 2 years of age is considered to be the peritrigonal region: the so-called terminal zone. At this age in our patients, however, a persistent T2 hyperintensity was noted in the frontotemporal subcortical regions. In these areas, the myelination appeared complete at 36–40 months of age. The so-called terminal zones were the subcortical areas rather than the peritrigonal area, and complete myelination took place by about age 3 years.
MR imaging is the method of choice for in vivo noninvasive assessment of myelin development in the human central nervous system. The myelination process begins at the level of the cranial nerves during the fifth month of intrauterine life, and development continues in postnatal life. During the first months of life, myelination is very fast and follows well-defined steps. It proceeds from the caudal to the cephalad portion of the brain and from the posterior to the anterior region. Whereas myelination occurs earliest in the sensorimotor and visual pathways, little information is available about the later phases of myelination in the so-called terminal zone. At routine MR imaging examinations of children aged 2–3 years, we repeatedly observed persistent hyperintensity of the subcortical white matter on T2-weighted images. To better identify the specific sites involved in the normal process of myelination in its terminal phase, we retrospectively evaluated normal MR brain studies of children aged 20–40-months.
Methods
We retrospectively evaluated 85 MR brain studies of 81 children aged 20–40 months (median age, 28 months), previously judged to be without diseases potentially affecting white matter. The patients were born after a gestation period of 34–40 weeks; their age was correct for the slight prematurity. The patients were referred for various clinical conditions, nonneurologic problems, or nonspecific neurologic complaints (macrocephaly, dismorfism, precocious puberty, strabismus, spinal disease, cutaneous angiomas). Patients with severe prematurity, clinical signs of hypoxic-ischemic injury, or neurologic or systemic diseases that were suspected of affecting white matter (ie, hypothyroidism) were excluded. In 81 cases, the MR examinations were completely normal; in the other four cases, the MR image revealed an arachnoid cyst plus venous angioma, a cavernous hemangioma, Chiari I malformation, or mastoiditis.
All patients were routinely sedated before imaging. The MR studies were performed with a 1.5-T system (Magnetom Vision, Seimens, Erlangen, Germany). The images evaluated were obtained in the transverse plane with a T2-weighted spin-echo sequence (2200–3000/80–120 [TR/TE]) in 46 cases and a T2-weighted turbo spin-echo sequence (2600–5200/85–132) in 39 cases. Subjective analysis of the relative signal intensity of the white matter was made in four different areas: the subcortical white matter of the frontal, temporal, and parietal lobes and the peritrigonal white matter. Each area was further subdivided into different marker sites (Table).
Subdivision of marker sites and summary of grading system
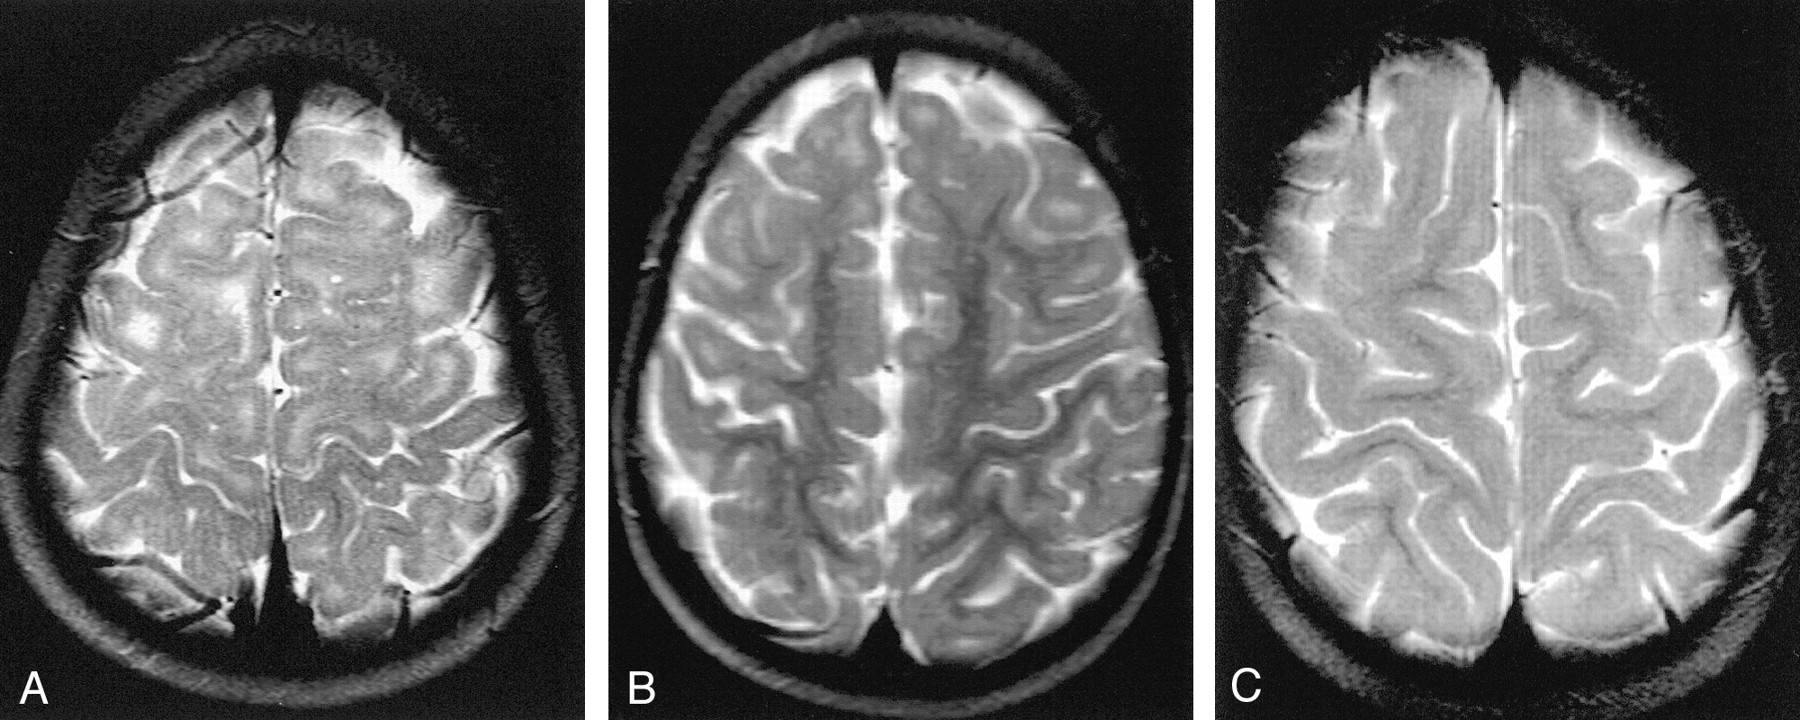
We assumed persistence of T2 hyperintensity as the expression of an absence of myelination. The extension of the myelination was graded on an ordinal scale of 0–3 in the frontal lobe and 0–2 in the other areas. In particular, for each area, the grading was assigned as follows: The frontal lobe was subdivided into prerolandic convolution, frontopolar region, first and second convolutions. Grade 0 corresponded to absence of myelination in all of these marker sites; grade 1, appearance of myelination in the prerolandic convolution; grade 2, progression of myelin in the frontopolar region; grade 3, presence of myelin in the first and second convolutions and hence a complete myelination in the frontal area (Fig 1). The temporal lobe was divided into temporolateral and temporopolar regions. Grade 0 indicated absence of myelination in both of the subcortical areas; grade 1, appearance of myelination in the lateral region; and grade 2, progression of myelination in the polar area. The parietal lobe was subdivided into postrolandic convolution and parietal gyri. Grade 0 represented absence of myelin in these sites; grade 1, presence of myelin in the postrolandic convolution; and grade 2, extension of myelination in the parietal gyri. The peritrigonal white matter was divided into a posterior and a superior region. Grade 0 indicated absence of myelin in both of the peritrigonal regions; grade 1, myelination of the posterior peritrigonal white matter; grade 2, myelination of the superior peritrigonal white matter.

Axial T2-weighted MR images.
A, Image in a 21-month-old girl with grade 0 myelination in the frontal lobe. The subcortical white matter is clearly hyperintense, so not myelinated, in the prerolandic area and along the first and second convolutions bilaterally. Subcortical hyperintensity was also evident in the frontopolar regions.
B, Example of grade 2 myelination in the frontal area. A T2 hyperintensity is present along the first and second convolutions, while the prerolandic area is myelinated.
C, Example of grade 3 myelination. T2 hyperintensity is no longer evident, and myelination appears complete.
The grading system is summarized in the Table. We used more grades for the frontal lobe, because it occupied the largest area in the axial plane and presented a great variability between the cases. The MR imaging score was made independently by three experienced pediatric neuroradiologists (C.P., C.B., F.T.). Interobserver agreement was assessed by calculating Cohen ê statistics with use of Stata software, version 7 (1). We obtained a substantial interobserver agreement for the frontal, temporal, and peritrigonal regions (κ=0.77, 0.65, and 0.76, respectively) and a moderate agreement for the parietal area (κ=0.47).
Results
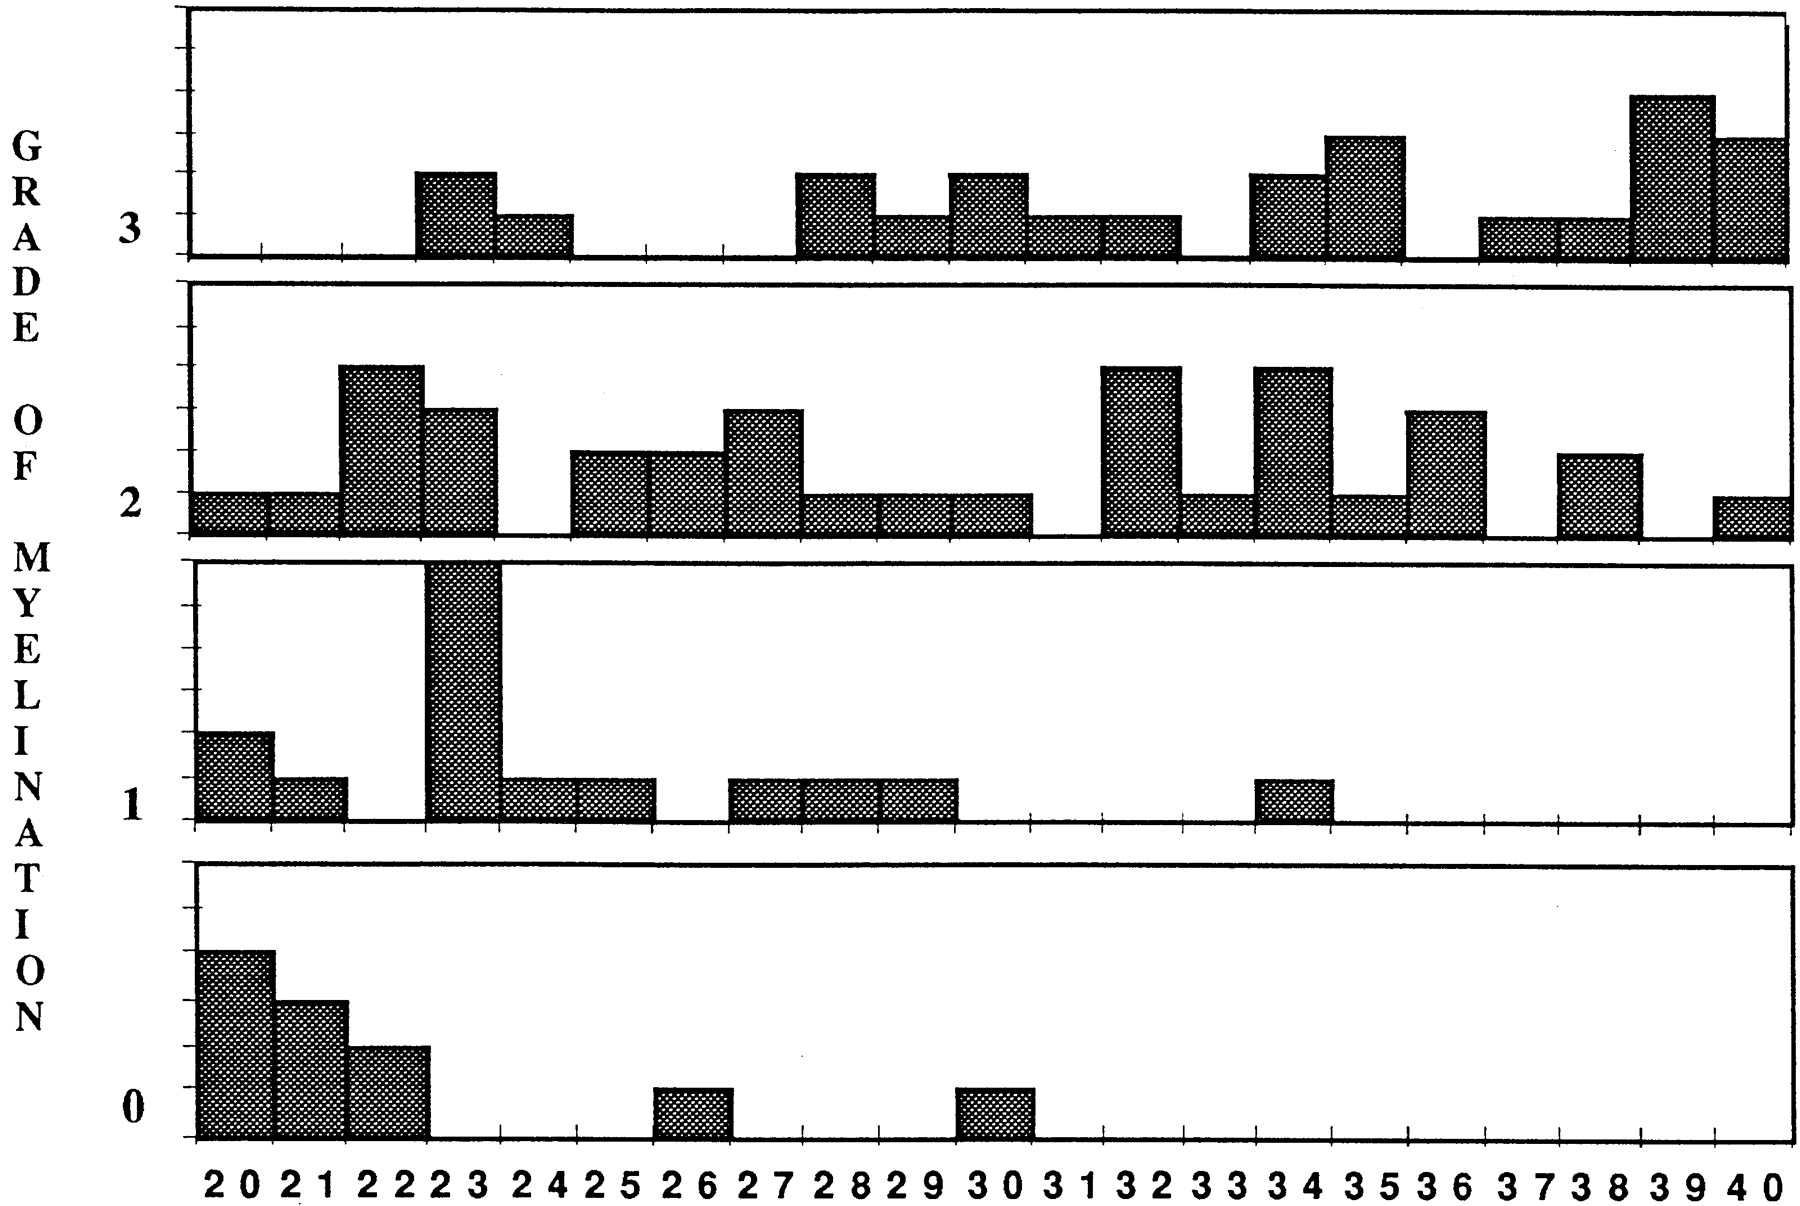
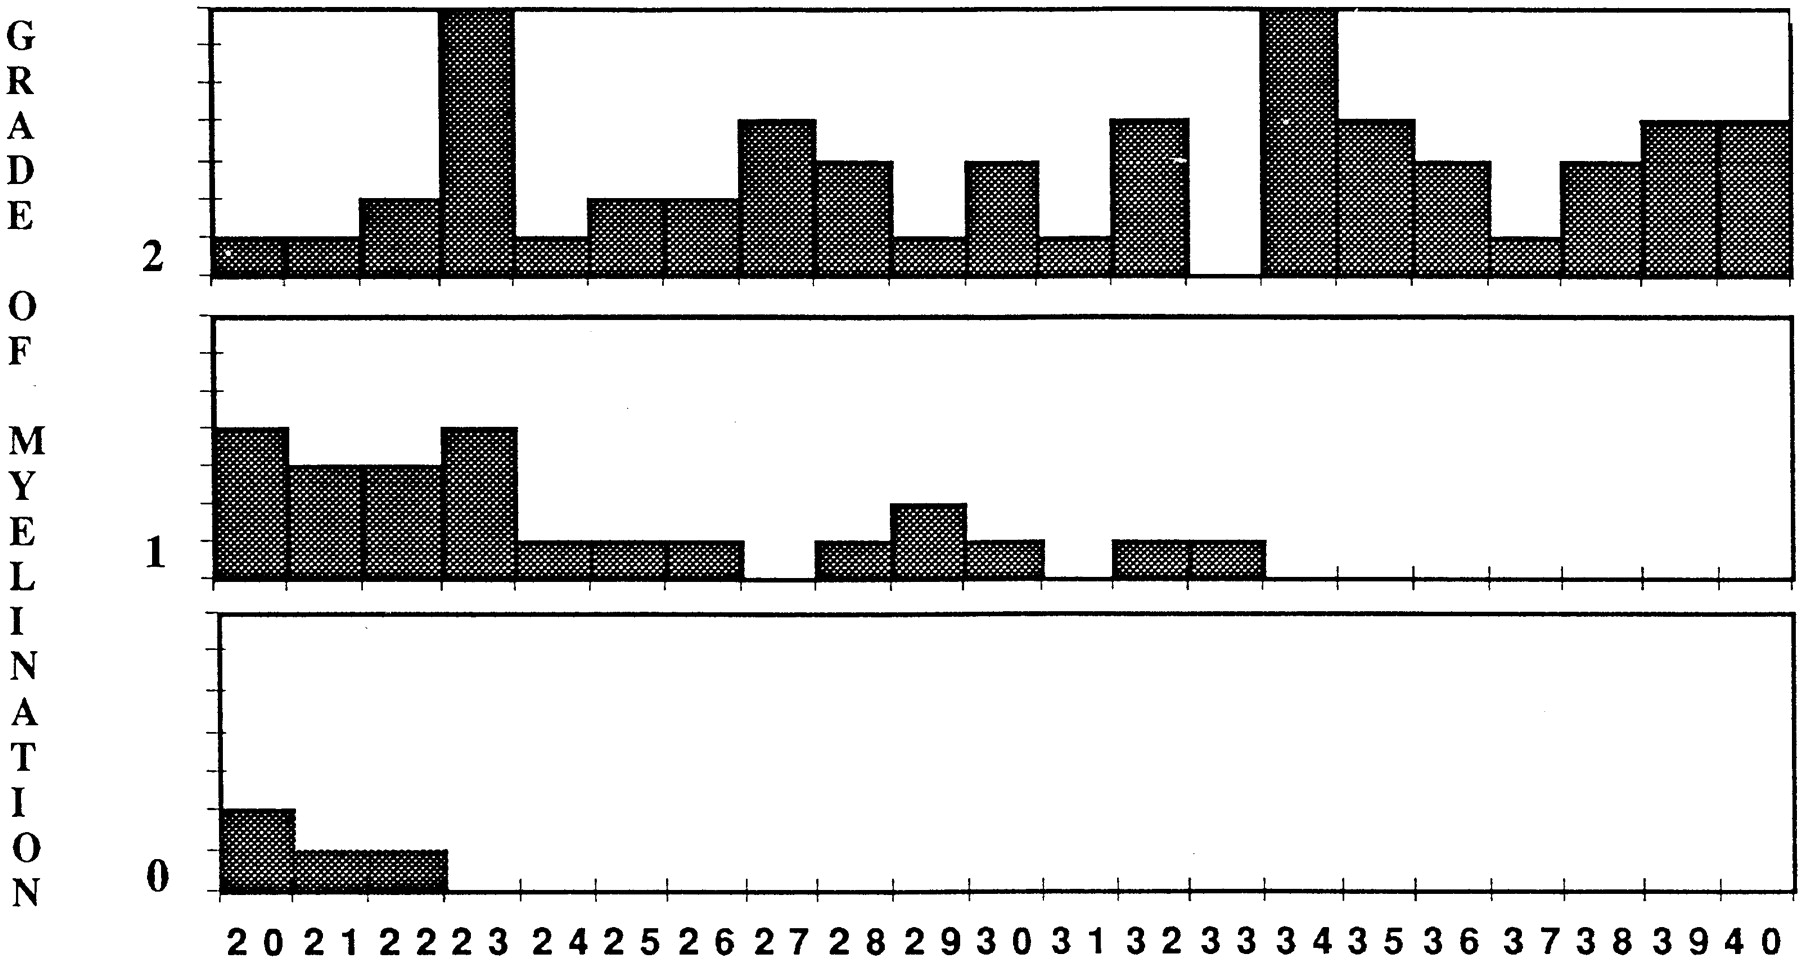
The findings are summarized in Figures 2–5 in which the distribution of grades of myelination is shown for each area. Observations in the frontal area revealed that none of the patients younger than 22 months had grade 3 myelination. Of the patients aged 23–34 months, most (34/48) showed intermediate grades 1 and 2, and in those older than 34 months, most (12/19) showed complete myelination (grade 3). Few cases (n=5) had different findings: two showed grade 0 at 26 and 30 months of age, respectively. However, two 23-month-old boys and one 24-month-old girl revealed grade 3. In the temporal lobe, all patients younger than 22 months had grade 0 or 1 (Fig 6). Of those aged 23–33 months, 21 of 41 patients were grade 1. Of those older than 34 months of age, 73% (19/26) were grade 2. In the parietal area, the patients younger than 22 months predominantly showed grade 1 (10/18). Of those aged 23–33 months, 68% (28/41) were grade two; and of those older than 34 months, all were grade 2. In the peritrigonal zone, we observed at all ages a clear prevalence of grade 2, and after 30 months of age all children showed complete myelination. The two patients aged 26 and 30 months who had grade 0 myelination in the frontal lobe also had grade 0 in the temporal lobe. In the same way, the three patients who showed grade 3 in the frontal lobe at ages 23 and 24 months also revealed complete myelination in the temporal lobe.

Histogram of frontal lobe myelination. Numbers on x axis are ages in months.

Histogram of temporal lobe myelination. Numbers on x axis are ages in months.

Histogram of parietal lobe myelination. Numbers on x axis are ages in months.

Histogram of peritrigonal area myelination. Numbers on x axis are ages in months.

A and B, Axial T2-weighted MR images show grade 0 myelination in the temporal lobe. Subcortical T2 hyperintensity is recognizable in both temporopolar (A) and temporolateral (B) areas.
Discussion
Myelination is a dynamic process that occurs during fetal life and goes on after birth in a well-defined, predetermined manner (2–4). MR imaging is a safe, noninvasive method for evaluating the development of myelination in infants (5, 6). The process of myelination is different in onset and rate in the various areas of the brain and follows different timetables (7). Numerous studies performed at autopsy in infants indicate that the process of myelination follows a centrifugal, inferior to superior and posterior to anterior pattern. In particular, in telencephalic sites, myelination proceeds from the central sulcus toward the poles, and from the occipital and parietal lobes to the frontal and temporal lobes. Sensory fibers myelinate before motor fibers, and projection pathways earlier than association pathways (2, 8–13). Complete myelination seems to be reached in early adulthood. As formation of myelin by the oligodendrocytes proceeds, an increase in brain cholesterol and glycolipids concentration and a decrease in water content take place (4, 14–17). This results in a change of white matter signal intensity on MR images that is characterized by a shortening of T1 and T2 relaxation times. It is thought that the deposition of cholesterol and glycolipids is mainly responsible for the high signal intensity on T1-weighted images, whereas the diminishing signal intensity on T2-weighted images results from a decreased number of water molecules (8, 11).
MR assessment of myelination during the first 2 years of life has been widely studied, revealing a high rate of its progression and confirming the general rules that govern its topographic sequence (2, 3, 14). Little information is available about the MR evaluation of the last and slower phase of myelination in the subcortical areas. According to the literature, T1- and T2-weighted images have different sensitivity in revealing the degree of myelination (18). On T1-weighted images, the pattern of myelination reaches the adult aspect at 1 year of age; on T2-weighted images, at about 2 years of age (8, 12). The T2-weighted images therefore are the most suitable for evaluating the terminal phase of myelination because changes related to water attenuation predominate (11).
On MR images, the last associative area to mature is considered to be the peritrigonal zone—a triangular region posterior and superior to the trigones of the lateral ventricles characterized by a persistent high signal intensity on T2-weighted images (19). In most of our patients, the peritrigonal white matter appeared completely myelinated at the age of 20 months, whereas we observed a persistence of T2 hyperintensity in the subcortical frontotemporoparietal white matter. Assuming our patients to be without disease that could potentially affect white matter, we interpreted the T2 hyperintensity as the expression of incomplete myelination. Frontal and temporal lobes presented a similar pattern of progression of myelination. In these areas, most of the patients younger than 22 months had grade 0 myelination. We noted the greatest variability among those patients aged 23 and 34 months; in this period, the patients were distributed among all grades with a prevalence for the middle grades (grades 1 and 2 for the frontal lobe and grade 1 for the temporal lobe). With advancing age, we observed a progressive increase in the percentage of patients with the highest grade of myelination; at about 40 months of age, myelination appeared complete in almost all our children. The contemporaneity of the progression of myelination in the frontal and temporal lobes was underlined by the fact that the patients with findings that differed with those of others had the same behavior in both of these regions. The development of myelin in the parietal lobe was quite different. Only very few patients younger than 22 months had grade 0 myelination, and of those patients older than 23 months, most had already reached complete myelination. In the peritrigonal areas, most of our patients had grade 2 myelination; very few cases had grade 0 or 1.
Our results confirm the topographical sequence of the development of myelination described in the anatomopathologic studies: the parietal lobe myelinates before the frontal and temporal lobes. In autopsy studies, the subcortical association fibers, connected with the highest intellectual functions, seem to complete their myelination in early adulthood (9–11). We noted that the subcortical regions are the last areas to myelinate. On radiologic studies, however, the terminal area of myelination is still considered to be the peritrigonal region. One possible explanation is that the T2 hyperintensity sometimes revealed in the peritrigonal zones, particularly on the high-spatial-resolution images with a matrix of 512, could be partially referred to perivascular spaces; images of linear T2 hyperintensity going from the ventricle walls toward the periphery were in some cases well visualized (Fig 7). The persistence of this aspect in people between the first and second decade of life would confirm this hypothesis even if further studies about the evolution of perivascular spaces in children and young people are necessary. Although we do not have follow-up studies in our patients, the large number of children examined and the good distribution among the different months of age led us to hypothesize that the process of myelination is not finished at 2 years of age. Myelination proceeds into the following months and only at 36–40 months of age does it appear to be complete. The so-called terminal zones seem to be the subcortical areas rather than the peritrigonal area. Finally, identification of subcortical areas as terminal myelination zones in children aged 2–3 years is a necessary step to ruling out white matter disease of developing brain.

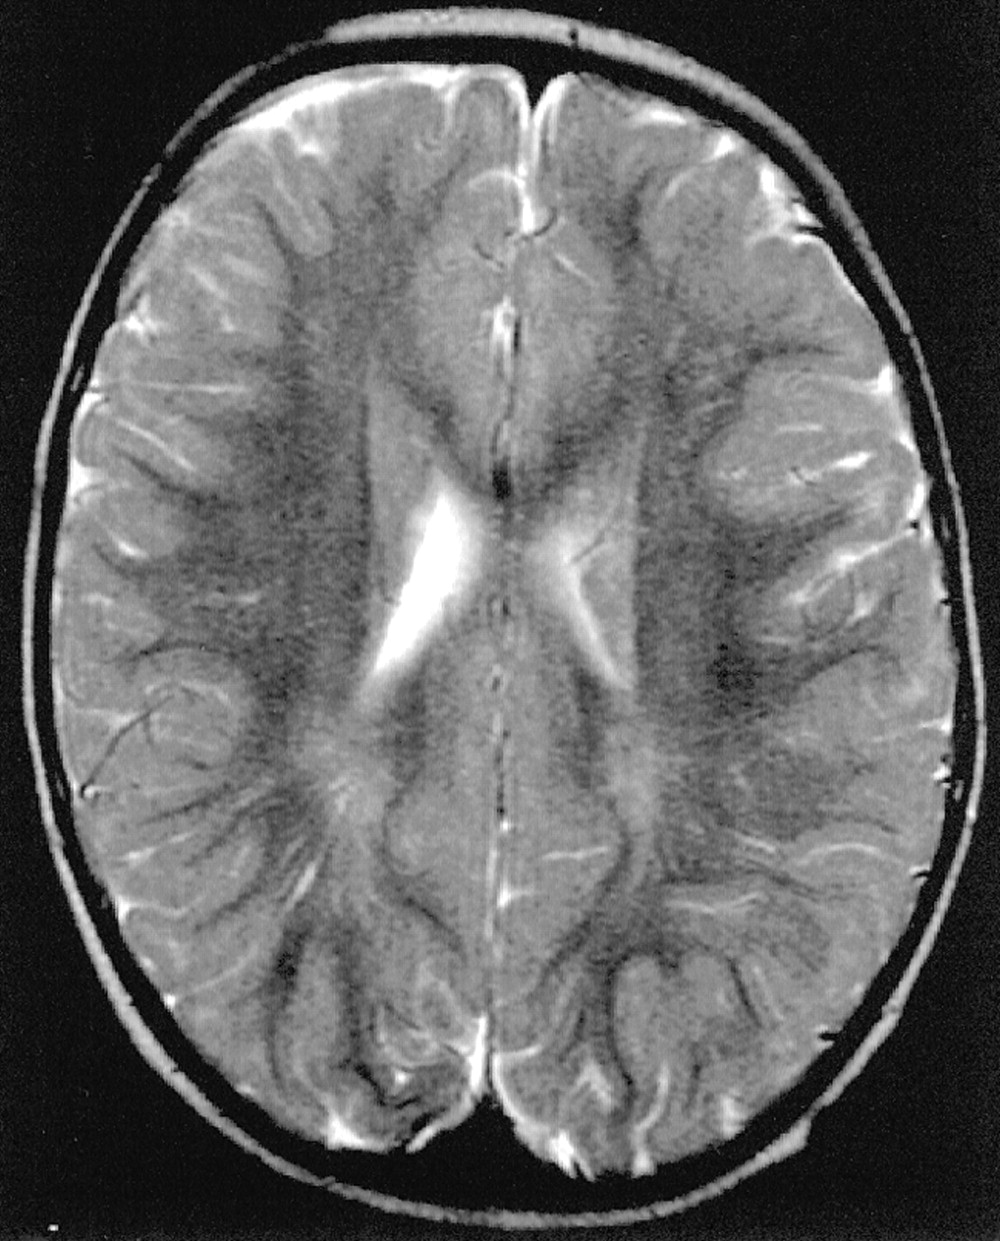
Axial T2-weighted MR image shows peritrigonal linear areas of hyperintensity that can be referred to perivascular spaces.
Acknowledgments
We thank Dario Consonni, MD, Istituti Clinici di Perfezionamento Dipartimento di Medicina del Lavoro e Sicurezza negli Ambienti di Lavoro, Milan, Italy, for assistance in performing statistical analysis.
References
- Received February 19, 2001.
- Accepted after revision July 2, 2002.
- Copyright © American Society of Neuroradiology


