Advertisement

Main menu

  • Home
  • Content
    • Current Issue
    • Accepted Manuscripts
    • Article Preview
    • Past Issue Archive
    • Video Articles
    • AJNR Case Collection
    • Case of the Week Archive
    • Case of the Month Archive
    • Classic Case Archive
  • Special Collections
    • AJNR Awards
    • Low-Field MRI
    • Alzheimer Disease
    • ASNR Foundation Special Collection
    • Photon-Counting CT
    • View All
  • Multimedia
    • AJNR Podcasts
    • AJNR SCANtastic
    • Trainee Corner
    • MRI Safety Corner
    • Imaging Protocols
  • For Authors
    • Submit a Manuscript
    • Submit a Video Article
    • Submit an eLetter to the Editor/Response
    • Manuscript Submission Guidelines
    • Statistical Tips
    • Fast Publishing of Accepted Manuscripts
    • Graphical Abstract Preparation
    • Imaging Protocol Submission
    • Author Policies
  • About Us
    • About AJNR
    • Editorial Board
    • Editorial Board Alumni
  • More
    • Become a Reviewer/Academy of Reviewers
    • Subscribers
    • Permissions
    • Alerts
    • Feedback
    • Advertisers
    • ASNR Home

User menu

  • Alerts
  • Log in

Search

  • Advanced search
American Journal of Neuroradiology

American Journal of Neuroradiology

ASHNR American Society of Functional Neuroradiology ASHNR American Society of Pediatric Neuroradiology ASSR
  • Alerts
  • Log in

Advanced Search

  • Home
  • Content
    • Current Issue
    • Accepted Manuscripts
    • Article Preview
    • Past Issue Archive
    • Video Articles
    • AJNR Case Collection
    • Case of the Week Archive
    • Case of the Month Archive
    • Classic Case Archive
  • Special Collections
    • AJNR Awards
    • Low-Field MRI
    • Alzheimer Disease
    • ASNR Foundation Special Collection
    • Photon-Counting CT
    • View All
  • Multimedia
    • AJNR Podcasts
    • AJNR SCANtastic
    • Trainee Corner
    • MRI Safety Corner
    • Imaging Protocols
  • For Authors
    • Submit a Manuscript
    • Submit a Video Article
    • Submit an eLetter to the Editor/Response
    • Manuscript Submission Guidelines
    • Statistical Tips
    • Fast Publishing of Accepted Manuscripts
    • Graphical Abstract Preparation
    • Imaging Protocol Submission
    • Author Policies
  • About Us
    • About AJNR
    • Editorial Board
    • Editorial Board Alumni
  • More
    • Become a Reviewer/Academy of Reviewers
    • Subscribers
    • Permissions
    • Alerts
    • Feedback
    • Advertisers
    • ASNR Home
  • Follow AJNR on Twitter
  • Visit AJNR on Facebook
  • Follow AJNR on Instagram
  • Join AJNR on LinkedIn
  • RSS Feeds

AJNR Awards, New Junior Editors, and more. Read the latest AJNR updates

OtherPHYSICS REVIEW

Theoretical Basis of Hemodynamic MR Imaging Techniques to Measure Cerebral Blood Volume, Cerebral Blood Flow, and Permeability

G. Zaharchuk
American Journal of Neuroradiology November 2007, 28 (10) 1850-1858; DOI: https://doi.org/10.3174/ajnr.A0831
G. Zaharchuk
  • Find this author on Google Scholar
  • Find this author on PubMed
  • Search for this author on this site
  • Article
  • Figures & Data
  • Info & Metrics
  • Responses
  • References
  • PDF
Loading

Article Figures & Data

Figures

  • Fig 1.
    • Download figure
    • Open in new tab
    • Download powerpoint
    Fig 1.

    A, Time course of the signal intensity from 1 section of a multisection gradient-echo EPI dataset at 1.5T during gadopentetate dimeglumine passage, TR/TE = 1,125/49 ms. During the first pass, signal intensity decreases due to the microscopic field-strength variations and water diffusion through gradients created by the intravascular contrast agent. B, Signal intensity versus time for regions of interest in the gray and white matter. C, From these curves and an estimate of the AIF, maps of perfusion-weighted parameters such as CBV, CBF, MTT, and Tmax can be created. Note the prolonged MTT and Tmax in the left hemisphere, representing ischemic tissue within the left middle cerebral artery territory. Sec indicates seconds; au, arbitrary units. Image courtesy of Dr. Rexford Newbould, Stanford University.

  • Fig 2.
    • Download figure
    • Open in new tab
    • Download powerpoint
    Fig 2.

    Effects of bolus widening (“dispersion”) in the AIF on the tissue-concentration-versus-time curve. A, Residue function, which represents the probability of the tracer remaining in the voxel at time t. Note that this is a monotonically decreasing function, with a value of 1 at time t = 0. The residue function shown here represents a well-mixed single compartment with an MTT of 4 seconds, similar to that seen in brain. For the remainder of the examples, CBF is taken to be 50 mL/100 mL of brain per minute, again typical for brain. The area under the AIF is normalized to 1 arbitrary unit. B, Tissue concentration curve (solid line) for a “perfect bolus” AIF (dotted line), which arrives at t = 0. The tissue concentration curve is just the residue function multiplied by CBF. Note that CBF is equal to the first point of the tissue concentration curve, which is also the peak concentration. C, AIF is a 2-second bolus top hat function corresponding to “plug flow”: note the increase in the arrival time of peak contrast and the decrease in peak concentration, a consequence of the convolution of the AIF and the residue function. No longer is CBF equal to the first time point of the tissue curve or the peak concentration. D, AIF is a gaussian curve with full width at half maximum of 2 seconds, a more realistic model of a bolus that has widened before reaching the tissue. Note that for both C and D, deconvolution techniques are necessary to determine CBF and that the first moment of the tissue concentration curve is not equal to the MTT. Sec indicates seconds.

  • Fig 3.
    • Download figure
    • Open in new tab
    • Download powerpoint
    Fig 3.

    In ASL, upstream blood protons are either unperturbed (control) or inverted (label) on alternate applications of the pulse sequence, here demonstrated by the up arrows and down arrows, respectively. The signal intensity of the labeled images is approximately 1–2% lower than that of the control images due to the extraction of the negatively magnetized inverted spins into the tissue when they reach the capillary bed. Subtracting label images from control images creates a difference image proportional to CBF. Typically many such image pairs must be subtracted to achieve adequate SNR; the image of CBF in a healthy volunteer shown above was acquired in 5 minutes at 3T.

  • Fig 4.
    • Download figure
    • Open in new tab
    • Download powerpoint
    Fig 4.

    CBF errors due to prolonged arrival time in ischemic stroke with ASL. A, A contrast-enhanced MR angiogram shows right internal carotid artery occlusion. B, Diffusion-weighted image demonstrates abnormality of the right putamen, caudate, and a small area in the right frontal operculum. C, A PASL image of CBF demonstrates punctate high signal intensity (arrows) surrounding an area of apparent low flow in the right parietal lobe. The high signal intensity is probably due to delayed arrival of the label via collateral flow which is still within large vessels rather than in the parenchyma. The low measured CBF centrally is due to decay of the label before it enters the tissue. Normal flow was seen in this region on Xe-CT (images not shown). D, Follow-up CT 2 days later demonstrates infarction of the right caudate and putamen (arrow) but preserved gray-white contrast in the right parietal region that demonstrates low signal intensity on the ASL CBF map. CBF underestimation in the setting of collateral flow is a fundamental difficulty with the use of standard ASL in this patient population.

  • Fig 5.
    • Download figure
    • Open in new tab
    • Download powerpoint
    Fig 5.

    A basic model of the imaging voxel for permeability studies. The plasma volume, vp, is small compared with the EES (shown in gray) and the intracellular space, from which contrast is excluded. Observed relaxivity changes are a weighted average of the plasma and EES contrast concentration. The large black arrows signify isodirectional flux of contrast between these 2 spaces, with a rate constant equal to Ktrans. This flux is essentially zero in the presence of an intact BBB but is nonzero in many pathophysiologic conditions.

  • Fig 6.
    • Download figure
    • Open in new tab
    • Download powerpoint
    Fig 6.

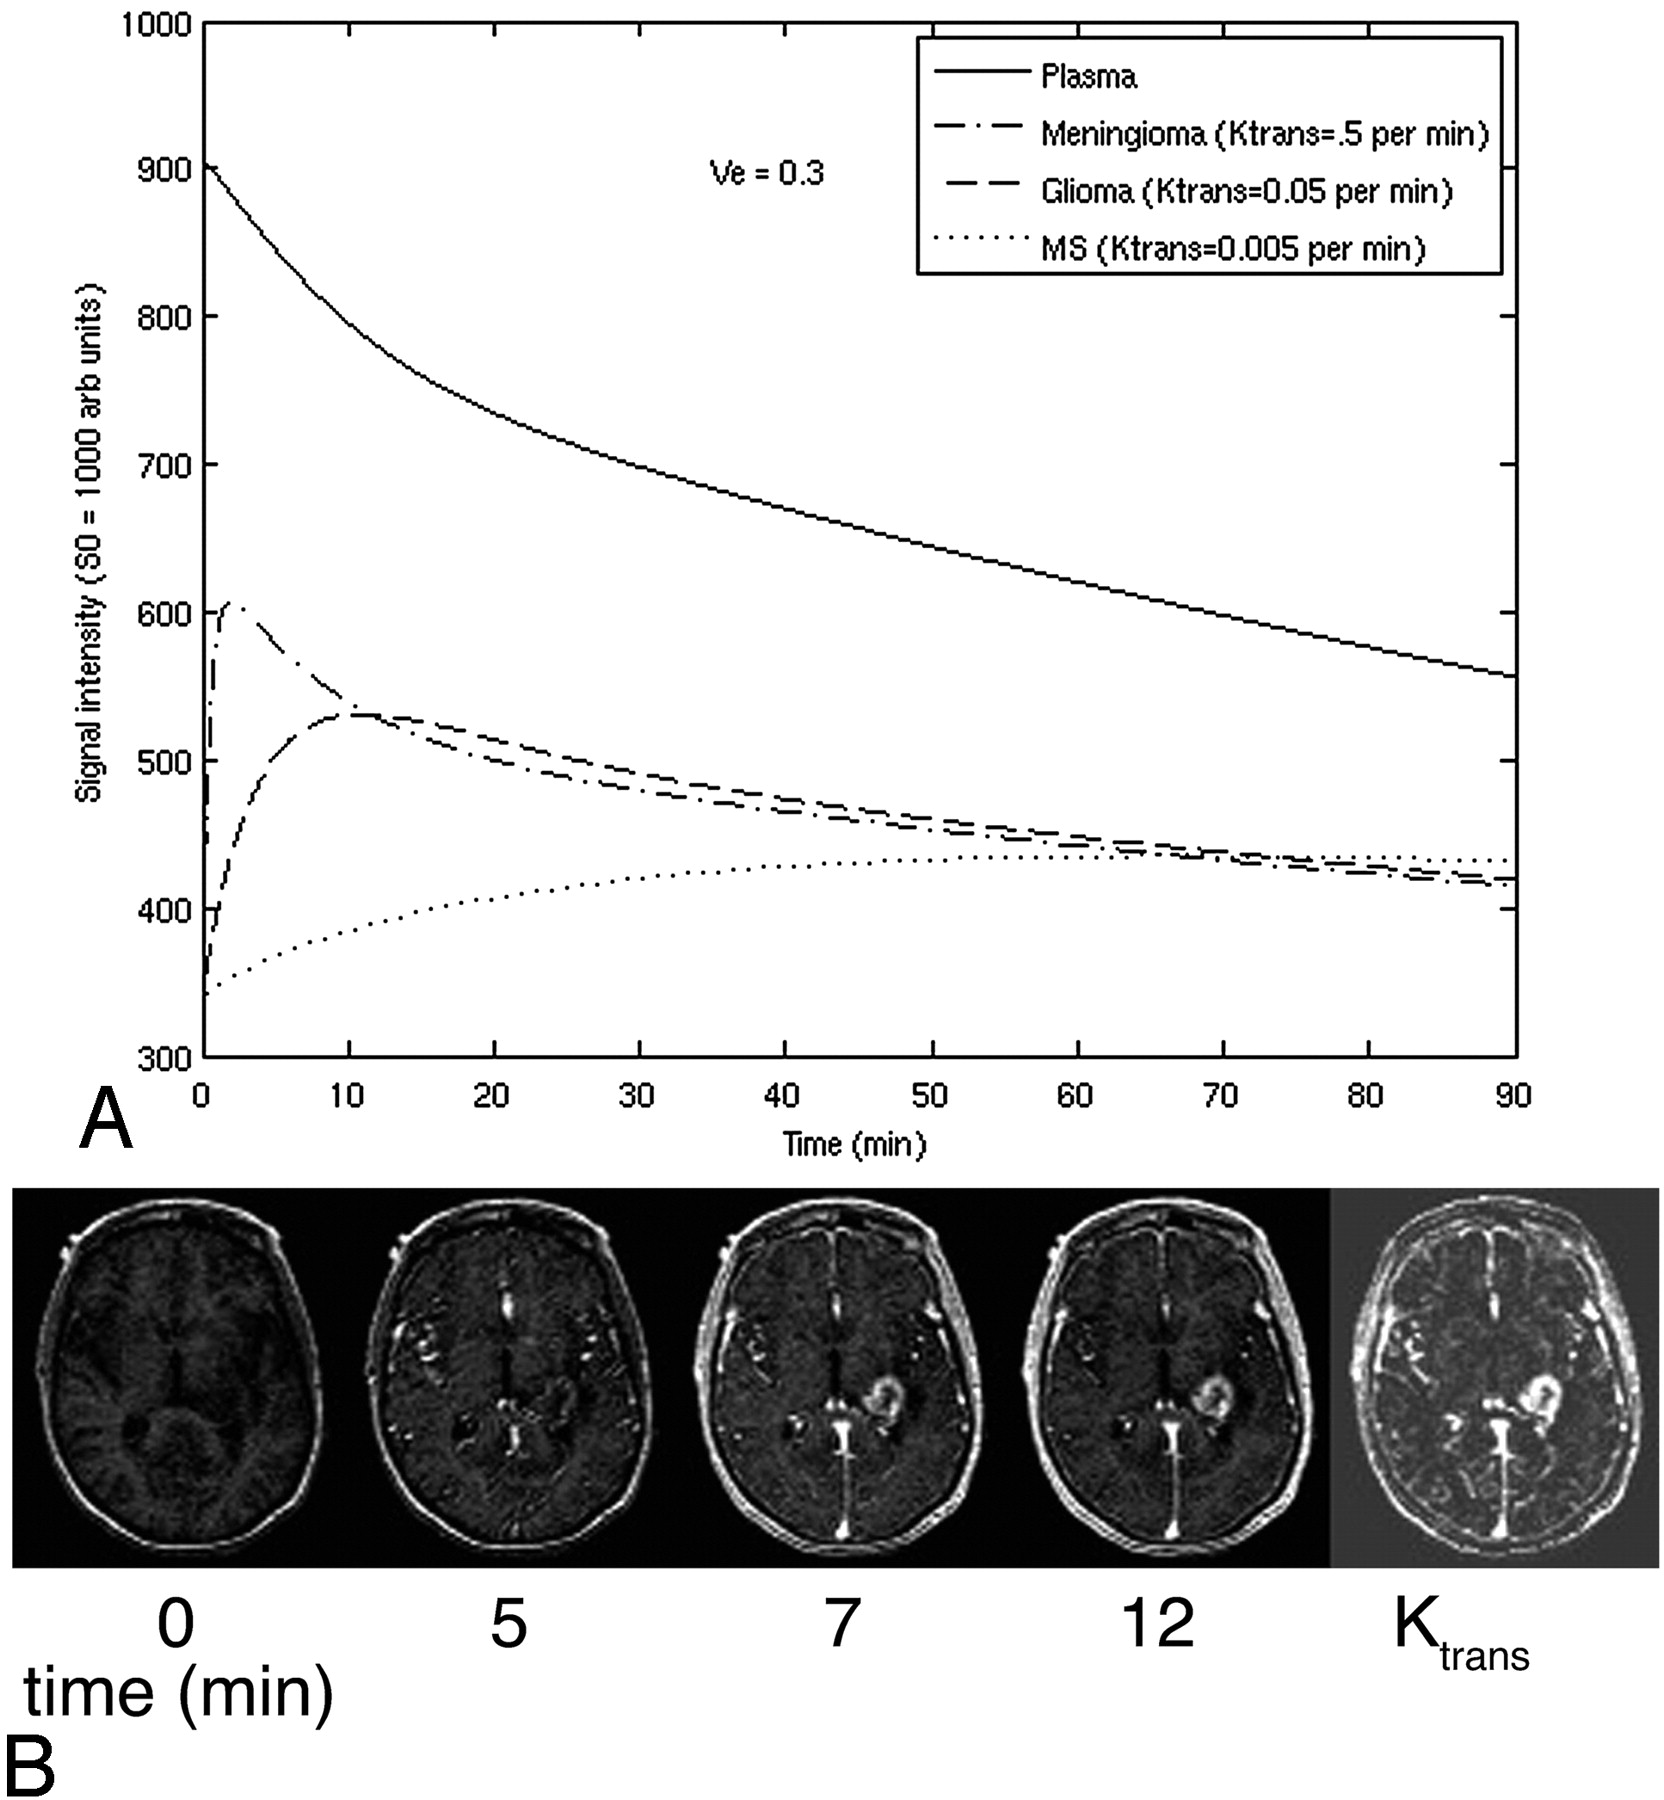
    A, Simulated signal-intensity enhancement curve versus time by using the steady-state T1 method for tissue with different permeability, corresponding to a meningioma (Ktrans = 0.5/min), a glioma (Ktrans = 0.05/min), and a chronic multiple sclerosis (MS) lesion (Ktrans = 0.005/min). ve of 0.3 is assumed. Proton density is assumed to be 1,000 arbitrary units (au) for all tissue, T1 before contrast is 1.2 seconds, and a typical spin-echo T1-weighted sequence with a TR of 500 ms is assumed. Note the rapid rise and subsequent fall of signal intensity in the highly leaky meningioma compared with the more gradual onset of contrast enhancement in the MS lesion. As is typical for the ssT1 method, contribution from the intravascular space is neglected. B, An example of gradual enhancement on T1-weighted imaging in a high-grade glioma at several time points following contrast administration by using the ssT1 method. The fitted Ktrans permeability map is shown at the right. Image courtesy of Dr. Soonmee Cha, University of California, San Francisco.

PreviousNext
Back to top

In this issue

American Journal of Neuroradiology: 28 (10)
American Journal of Neuroradiology
Vol. 28, Issue 10
November 2007
  • Table of Contents
  • Index by author
Advertisement
Print
Download PDF
Email Article

Thank you for your interest in spreading the word on American Journal of Neuroradiology.

NOTE: We only request your email address so that the person you are recommending the page to knows that you wanted them to see it, and that it is not junk mail. We do not capture any email address.

Enter multiple addresses on separate lines or separate them with commas.
Theoretical Basis of Hemodynamic MR Imaging Techniques to Measure Cerebral Blood Volume, Cerebral Blood Flow, and Permeability
(Your Name) has sent you a message from American Journal of Neuroradiology
(Your Name) thought you would like to see the American Journal of Neuroradiology web site.
CAPTCHA
This question is for testing whether or not you are a human visitor and to prevent automated spam submissions.
Cite this article
G. Zaharchuk
Theoretical Basis of Hemodynamic MR Imaging Techniques to Measure Cerebral Blood Volume, Cerebral Blood Flow, and Permeability
American Journal of Neuroradiology Nov 2007, 28 (10) 1850-1858; DOI: 10.3174/ajnr.A0831

Citation Manager Formats

  • BibTeX
  • Bookends
  • EasyBib
  • EndNote (tagged)
  • EndNote 8 (xml)
  • Medlars
  • Mendeley
  • Papers
  • RefWorks Tagged
  • Ref Manager
  • RIS
  • Zotero
0 Responses
Respond to this article
Share
Bookmark this article
Theoretical Basis of Hemodynamic MR Imaging Techniques to Measure Cerebral Blood Volume, Cerebral Blood Flow, and Permeability
G. Zaharchuk
American Journal of Neuroradiology Nov 2007, 28 (10) 1850-1858; DOI: 10.3174/ajnr.A0831
del.icio.us logo Twitter logo Facebook logo Mendeley logo
  • Tweet Widget
  • Facebook Like
  • Google Plus One
Purchase

Jump to section

  • Article
    • Abstract
    • Dynamic Susceptibility Contrast: Also Known as Bolus Perfusion-Weighted Imaging
    • Arterial Spin-Labeling
    • Permeability Imaging
    • Conclusions
    • Acknowledgments
    • References
  • Figures & Data
  • Info & Metrics
  • Responses
  • References
  • PDF

Related Articles

  • No related articles found.
  • PubMed
  • Google Scholar

Cited By...

  • MTT and Blood-Brain Barrier Disruption within Asymptomatic Vascular WM Lesions
  • Clinical Value of Vascular Permeability Estimates Using Dynamic Susceptibility Contrast MRI: Improved Diagnostic Performance in Distinguishing Hypervascular Primary CNS Lymphoma from Glioblastoma
  • Pretreatment blood-brain barrier disruption and post-endovascular intracranial hemorrhage
  • White Matter Ischemic Changes in Hyperacute Ischemic Stroke: Voxel-Based Analysis Using Diffusion Tensor Imaging and MR Perfusion
  • Advanced Magnetic Resonance Imaging of the Physical Processes in Human Glioblastoma
  • Pretreatment Blood-Brain Barrier Damage and Post-Treatment Intracranial Hemorrhage in Patients Receiving Intravenous Tissue-Type Plasminogen Activator
  • Assessment of Angiographic Vascularity of Meningiomas with Dynamic Susceptibility Contrast-Enhanced Perfusion-Weighted Imaging and Diffusion Tensor Imaging
  • Differentiation of Primary Central Nervous System Lymphomas and Glioblastomas: Comparisons of Diagnostic Performance of Dynamic Susceptibility Contrast-Enhanced Perfusion MR Imaging without and with Contrast-Leakage Correction
  • In Vivo Imaging of Neurovascular Remodeling After Stroke
  • Quantitative Blood Flow Measurements in Gliomas Using Arterial Spin-Labeling at 3T: Intermodality Agreement and Inter- and Intraobserver Reproducibility Study
  • Crossref
  • Google Scholar

This article has not yet been cited by articles in journals that are participating in Crossref Cited-by Linking.

More in this TOC Section

  • Theoretic Basis and Technical Implementations of CT Perfusion in Acute Ischemic Stroke, Part 2: Technical Implementations
  • Theoretic Basis and Technical Implementations of CT Perfusion in Acute Ischemic Stroke, Part 1: Theoretic Basis
  • Susceptibility-Weighted Imaging: Technical Aspects and Clinical Applications, Part 2
Show more PHYSICS REVIEW

Similar Articles

Advertisement

Indexed Content

  • Current Issue
  • Accepted Manuscripts
  • Article Preview
  • Past Issues
  • Editorials
  • Editor's Choice
  • Fellows' Journal Club
  • Letters to the Editor
  • Video Articles

Cases

  • Case Collection
  • Archive - Case of the Week
  • Archive - Case of the Month
  • Archive - Classic Case

More from AJNR

  • Trainee Corner
  • Imaging Protocols
  • MRI Safety Corner
  • Book Reviews

Multimedia

  • AJNR Podcasts
  • AJNR Scantastics

Resources

  • Turnaround Time
  • Submit a Manuscript
  • Submit a Video Article
  • Submit an eLetter to the Editor/Response
  • Manuscript Submission Guidelines
  • Statistical Tips
  • Fast Publishing of Accepted Manuscripts
  • Graphical Abstract Preparation
  • Imaging Protocol Submission
  • Evidence-Based Medicine Level Guide
  • Publishing Checklists
  • Author Policies
  • Become a Reviewer/Academy of Reviewers
  • News and Updates

About Us

  • About AJNR
  • Editorial Board
  • Editorial Board Alumni
  • Alerts
  • Permissions
  • Not an AJNR Subscriber? Join Now
  • Advertise with Us
  • Librarian Resources
  • Feedback
  • Terms and Conditions
  • AJNR Editorial Board Alumni

American Society of Neuroradiology

  • Not an ASNR Member? Join Now

© 2025 by the American Society of Neuroradiology All rights, including for text and data mining, AI training, and similar technologies, are reserved.
Print ISSN: 0195-6108 Online ISSN: 1936-959X

Powered by HighWire