
Abstract
BACKGROUND AND PURPOSE: Tract-based analysis can be used to investigate required tracts extracted from other fiber tracts. However, the fractional anisotropy (FA) threshold influences tractography analysis. The current study evaluated the influence of the FA threshold in measuring diffusion tensor parameters for tract-based analysis of the uncinate fasciculus in subjects with Alzheimer disease (AD).
MATERIALS AND METHODS: Subjects included 30 patients with AD and 10 healthy controls. We acquired tractographies of the uncinate fasciculus by using different FA thresholds. We measured mean FA and the apparent diffusion coefficient (ADC) along the uncinate fasciculus for different FA thresholds and evaluated the correlation between diffusion tensor parameters (FA, ADC) and the Mini-Mental State Examination (MMSE) scores.
RESULTS: The uncinate fasciculus showed lower mean FA and higher mean ADC values in cases with more severe AD. A higher FA threshold led to a lower mean ADC value and a higher mean FA value along the uncinate fasciculus, whereas the relative order of measured values according to the severity of AD was not influenced by the FA threshold. An FA threshold of 0.2 showed higher correlation between mean ADC values and MMSE scores. FA thresholds of 0.15 and 0.20 showed higher correlation between mean FA values and MMSE scores.
CONCLUSIONS: Appropriate selection of the FA threshold leads to higher correlation between diffusion tensor parameters and the severity of AD. For tract-based analysis of degenerative diseases such as AD, appropriate selection of the FA threshold for tractography is important.
Tract-based analysis of white matter is a useful method for analyzing pathologic changes in selected fiber tracts, especially in degenerative diseases.1–4 Increased diffusivity and decreased fractional anisotropy (FA) in the uncinate fasciculus are reported to reflect progression of histopathologic changes in Alzheimer disease (AD), and both are suggested as useful biologic indices for monitoring AD.2,5,6 For actual measurement of tract-based analyses, tractography of the required fiber bundle must be performed. The FA threshold must be set to create this tractography. Although there are white matter tracts such as the cingulum or cerebellar peduncles, which have landmark margins that can be determined anatomically or morphologically, the white matter tract such as the uncinate fasciculus is surrounded only by white matter and does not have any landmark margins. Thus, selection of the FA threshold is critical to determine the size and location of tractography for the uncinate fasciculus.
Our hypothesis for the current study was that the selection of the FA influences the measurement of diffusion tensor parameters of the uncinate fasciculus. The purpose of the current study was to evaluate the influence of the FA threshold on measured mean FA and apparent diffusion coefficient (ADC) values in tract-based analysis of patients with AD. We also tried to determine the optimal FA threshold for evaluation of the uncinate fasciculus.
Materials and Methods
Subjects included 30 patients with AD, including 7 with mild cognitive impairment (MCI) and 10 healthy controls. The clinical diagnosis of AD was based on the Diagnostic and Statistical Manual of Mental Disorders-IV criteria and examinations (Mini-Mental State Examination [MMSE], Alzheimer's Disease Assessment Scale [ADAS], and the Clock Drawing Test [CDT]) of cognitive status. Patients with MCI were diagnosed by psychiatrists according to the following criteria: 1) presence of memory complaints by the patient that were preferably corroborated by an informant, 2) objective memory impairment defined as a performance that was 1.5 SD below the cutoff for normal aging, 3) essentially intact activities of daily living, 4) preserved general cognitive function, and 5) no dementia.7 Informed consent for the imaging study was obtained from all patients or their families after the nature of the procedure was fully explained. Patients ranged in age from 64 to 82 years (mean, 71 years) and consisted of 14 men and 16 women. Ten age-matched controls (7 women and 3 men; age range, 65–78 years; mean, 71 years) were included. The control group excluded patients with dementia or cortical infarctions on T2-weighted images.
A 1.5T clinical MR imaging unit (Magnetom Sonata; Siemens, Erlangen, Germany) was used to obtain diffusion tensor images for all participants. Diffusion-weighted images were obtained by using an echo-planar imaging (EPI) sequence (TR = 2300 ms, TE = 122 ms, b = 1000 s/mm2, 6-axis encoding, FOV = 230 mm, matrix = 128 × 128, section spacing = 3 mm, section thickness = 3 mm, gapless, averaging = 6). We obtained 50 section images, covering the entire brain.
Diffusion tensors were computed and fiber-tract maps were created by using a PC workstation with dTV II diffusion tensor imaging software developed by Masutani et al (University of Tokyo, Diffusion Tensor Visualizer, Version 2; available at: http://www.ut-radiology.umin.jp/people/masutani/dTV.dTV_frame=e.htm).8,9 Interpolation along the z-axis was performed to obtain isotropic data (voxel size, 0.89 × 0.89 × 0.89 mm). The eigenvector associated with the largest eigenvalue or the principal axis was assumed to represent the local fiber direction. The tracking algorithm moved along the principal axis. The diffusion tensor at the next location was determined from the adjacent voxels, and its principal axis was subsequently estimated. Tracking lines were traced in this way and were propagated in antegrade and retrograde directions until the FA fell below an assigned threshold.
Tractographies of the uncinate fasciculus were obtained with the seed area in the white matter of the substantia innominata and the external capsule just cranial to the middle cerebral artery on the coronal plane and with the target area in the white matter of the ipsilateral temporal lobe just caudal to the middle cerebral artery on the coronal planes (Fig 1). This method for drawing tractography was shared by 2 observers. By using a function of dTV II software that calculates the mean FA and the mean ADC along the constructed tract, we measured the mean FA and mean ADC along the bilateral uncinate fasciculus. First, to evaluate interobserver variation of the mean FA and the mean ADC along the constructed tracts, a neuroradiologist (T.T.) and a psychiatrist (K.K.) independently measured the values for the uncinate fasciculus on both sides, with the FA threshold fixed at 0.18, which is the default setting of the dTV II software. Correlation coefficients were evaluated between mean FA and mean ADC values measured along the uncinate fasciculus constructed independently by these 2 observers.

Tractographies of the uncinate fasciculus were drawn by using diffusion-weighted images (EPI sequence: TR = 2300 ms, TE = 122 ms, b = 1000 s/mm2, 6-axis encoding). A and B, Tractographies, coronal (A) and near sagittal (B) views, of the uncinate fasciculus are obtained with the seed area (blue) on the coronal plane to include the white matter of the substantia innominata and the external capsule just cranial to the middle cerebral artery (arrow, note the flow void) and with the target area (pink) on coronal planes in the white matter of the temporal lobe just caudal to the middle cerebral artery (arrow).
For the major interest of the current study, we acquired tractographies of the bilateral uncinate fasciculus by using 4 FA thresholds (0.1, 0.15, 0.2, and 0.25) with the same seed area and target area. For different FA thresholds, we measured the mean FA and mean ADC along the uncinate fasciculus. Statistical correlation between diffusion tensor parameters (FA and ADC) and the MMSE score was evaluated by the Spearman rank correlation test.
Results
Interobserver variation for mean FA and mean ADC measurements of the uncinate fasciculus was constructed independently by 2 observers. The correlation coefficient between mean FA values by 2 observers was 0.85. For mean ADC values, the correlation coefficient was 0.86.
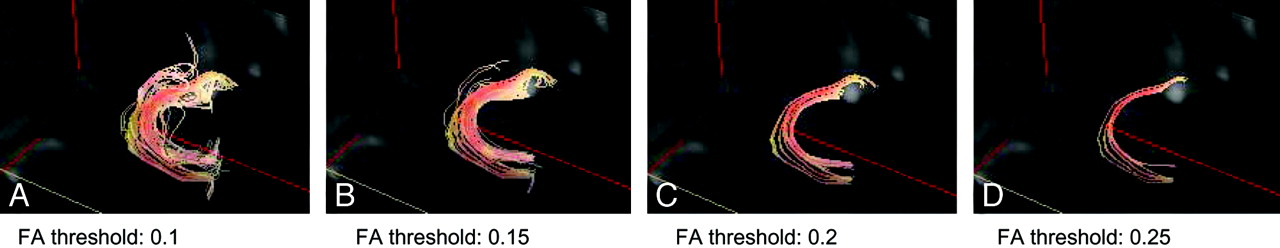
Figure 2 shows tractographies of the uncinate fasciculus with 4 different FA thresholds. There was a tendency for a lower threshold to reveal a larger number of tract lines, and a higher threshold to reveal a smaller number of tract lines and concentrated tracts. With an FA threshold of 0.25, tractography of the uncinate fasciculus could not be drawn in 3 patients with AD in whom the MMSE scores were 6, 6, and 10.

Tractographies of uncinate fasciculus with 4 different FA thresholds. FA thresholds were set at 0.1, 0.15, 0.2, and 0.25. There is a tendency for lower thresholds to reveal a larger number of tract lines and higher thresholds to reveal fewer tract lines and concentrated tracts.
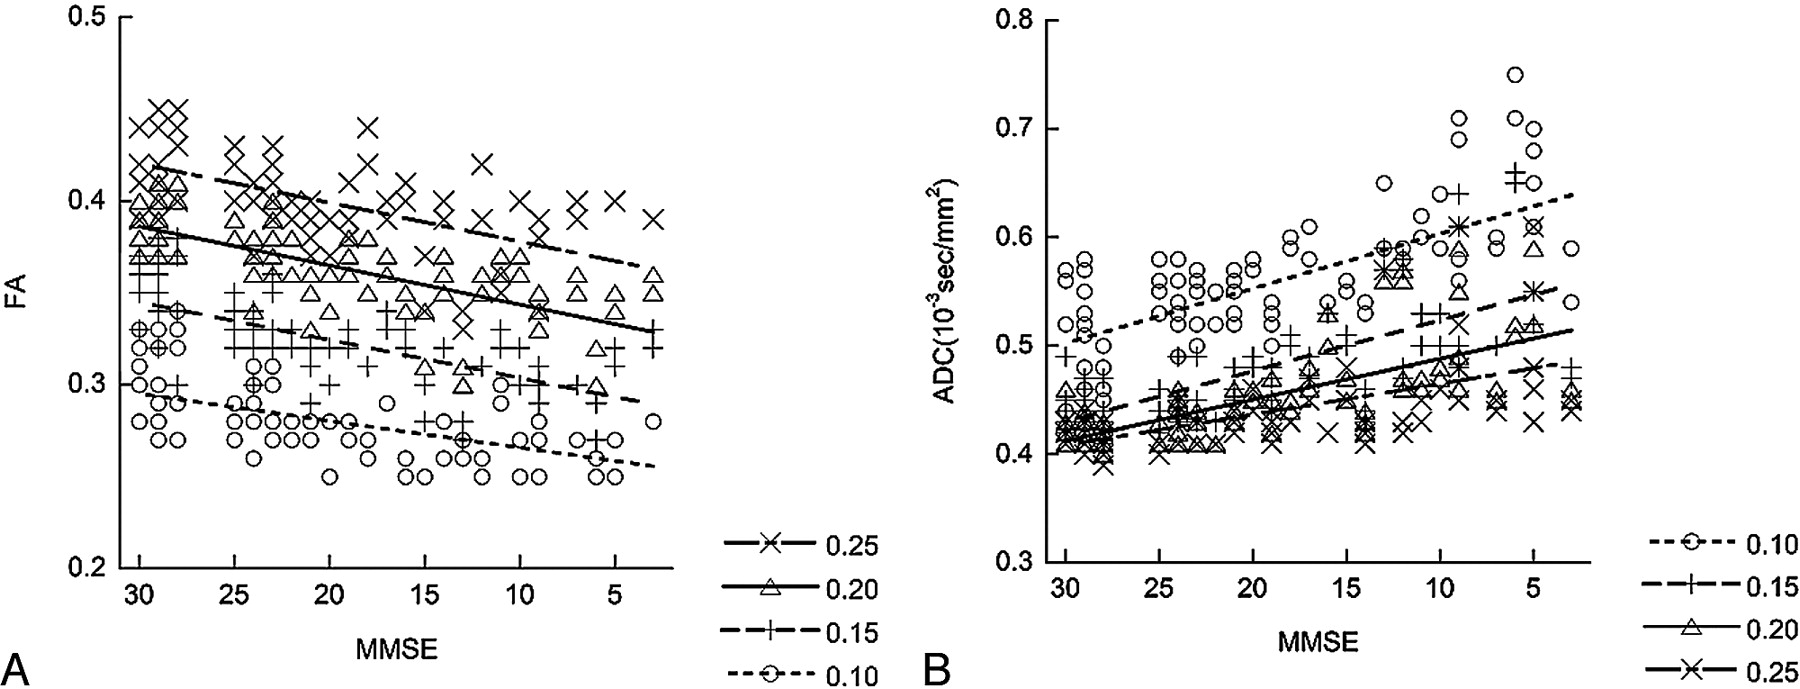
Figure 3 shows the results of measured mean FA and mean ADC within the tracts of the uncinate fasciculus under 4 different FA thresholds in correlation with the MMSE score. The measurements showed that higher FA thresholds lowered the value of the mean ADC and resulted in higher mean FA values along the uncinate fasciculus. For mean FA values, the Spearman rank correlation coefficient (R) was 0.59 for an FA threshold of 0.25, 0.73 for a threshold of 0.20, 0.68 for a threshold of 0.15, and 0.56 for a threshold of 0.10. These thresholds indicate statistically a significant correlation (P < .001) to the MMSE score in all 4 sets of data obtained under 4 different FA thresholds. In addition, the order of the measured values according to the severity of AD was not influenced by the FA threshold. Especially, an FA threshold of 0.20 showed the best correlation between mean FA values and the MMSE score, whereas datasets with thresholds of 0.10 and 0.25 showed less correlation. For mean ADC values, Rs were −0.58 for an FA threshold of 0.25, −0.70 for a threshold of 0.20, −0.71 for a threshold of 0.15, and −0.66 for a threshold of 0.10. These thresholds indicate a statistically significant correlation (P < .001) to the MMSE score in all 4 sets of data obtained under 4 different FA thresholds. Also for the mean ADC, the order of the measured values according to the MMSE score was not influenced by the FA threshold. FA thresholds of 0.15 and 0.2 showed better correlation between the mean ADC and MMSE scores.

The correlations between the MMSE score and the mean FA value (A) and mean ADC value (B) of the uncinate fasciculus with their linear regression lines are shown. Tractographies of the uncinate fasciculus are drawn under 4 different FA thresholds (0.10, 0.15, 0.20, and 0.25). A higher FA threshold results in a lower mean ADC value and a higher mean FA value along the uncinate fasciculus. For mean FA values, the Rs are 0.59 for an FA threshold of 0.25, 0.73 for a threshold of 0.20, 0.68 for a threshold of 0.15, and 0.56 for a threshold of 0.10. For mean ADC values, Rs are −0.58 for an FA threshold of 0.25, −0.70 for a threshold of 0.20, −0.71 for a threshold of 0.15, and −0.66 for a threshold of 0.10. An FA a threshold of 0.20 shows higher correlation between mean FA values and the MMSE score, whereas FA thresholds of 0.15 and 0.2 show a higher correlation between mean ADC and MMSE scores.
Discussion
Tract-based analysis of the white matter tracts is a useful method for analyzing pathologic changes in selected tracts, especially in degenerative diseases.1–4 Tract-based analysis has been criticized for the fact that the method selects the voxels to measure the mean FA via the threshold of the FA itself. To solve this problem, some trials of automatic extraction of white matter tracts have been reported; however, limitations still exist in automatic extraction methods.10,11 We hypothesized that the selection of the FA threshold may influence the measurement of diffusion tensor parameters in tract-based analysis. For tract-based analysis of degenerative diseases, the appropriate selection of the FA threshold for tractography is important for meaningful measurement and evaluation.
The uncinate fasciculus is a white matter tract that connects the orbital gyrus in the frontal lobe and the anterior part of the temporal lobe. It is the largest of the fiber bundles connecting the frontal and temporal lobes. The fibers contain cholinergic fibers from the basal nucleus of Meynert, which innervate cortical regions, as well as fibers from the amygdaloid body and the cortex of the anterior temporal lobe.12,13 The fibers merge in the white matter of the middle temporal lobe and pass over the lateral nucleus of the amygdaloid body on their way to the limen insula. After they pass the external capsule and extreme capsule, they reach the frontal lobe in a fanlike arrangement in the frontal-orbital white matter. Increased diffusivity or decreased FA in the uncinate fasciculus or both are reported to reflect progression of histopathologic changes in AD and have been suggested as a useful biologic index in monitoring AD.2,5 Although similar reports have been made for the cingulum,5,14 it has landmark margins that can be determined anatomically or morphologically, and the selection of FA may not affect its measurement much. In contrast, the uncinate fasciculus is surrounded only by white matter and does not have landmark margins. We selected the uncinate fasciculus in the current study because selection of the FA threshold is the predominant factor for determining the size and location of tractography of the uncinate fasciculus.
Our study showed that interobserver variation was good between 2 observers with different backgrounds (a neuroradiologist and a psychiatrist), who underwent the same training and used the same regulation in tractography. We set the seed area and target area uniformly in this study. As a result, the interobserver variation was small, and significant agreement was shown. This agreement guarantees the objectivity of this method. Our results show that the selection of the FA did indeed influence the measured diffusion tensor parameters. In the tract construction of the uncinate fasciculus, a lower FA threshold resulted in a larger number of tract lines, which might contain voxels outside the actual uncinate fasciculus; and a higher FA threshold resulted in a small number of concentrated tracts, which might represent only the center of the uncinate fasciculus.
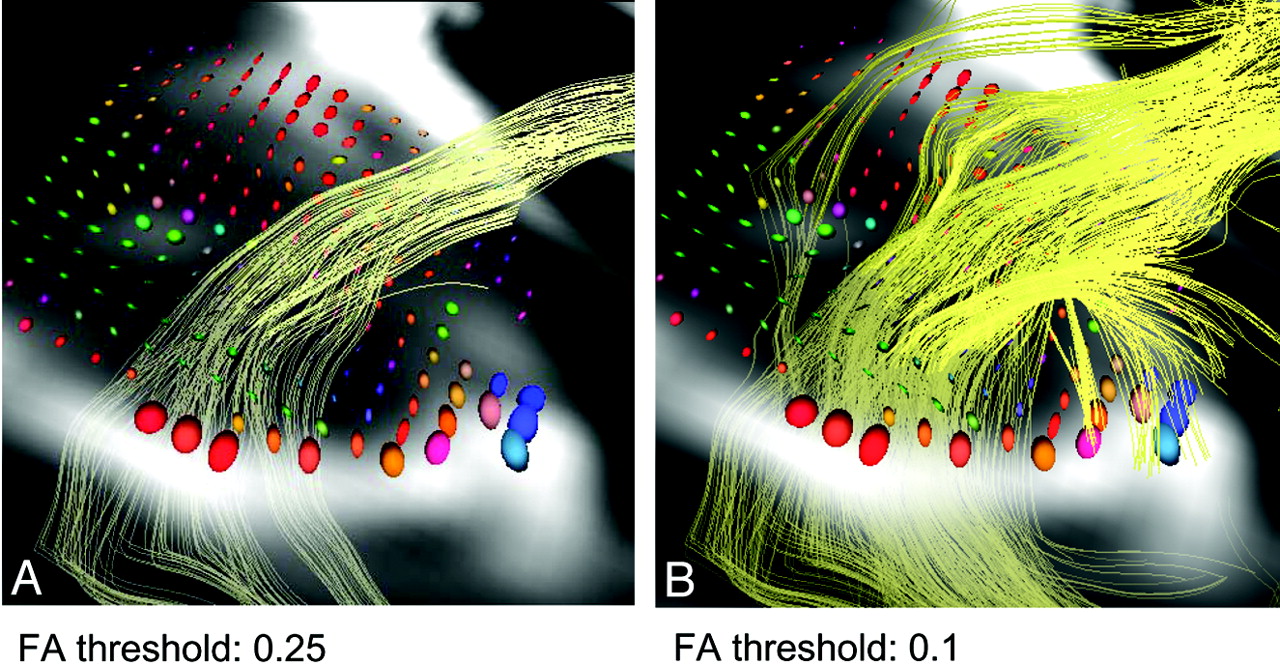
For the measurement of the diffusion tensor parameter along the uncinate fasciculus, a higher FA threshold resulted in a lower mean ADC value and a higher FA value along the uncinate fasciculus. This result may be because voxels at the margin of the uncinate fasciculus may contain fibers that are not included in the fiber tract, which results in a smaller FA of the voxel at the margin of the fiber tract than at the center. The ellipsoid display of diffusion tensor parameters in 1 case supports this hypothesis (Fig 4). The ellipsoids near the center of the uncinate fasciculus tend to have smaller diffusivity and larger anisotropy.

On the tract construction of the uncinate fasciculus, a lower threshold results in a larger number of tract lines and a higher threshold results in a smaller number and concentrated tracts. Ellipsoid displays of diffusion tensor parameters on the axial plane near the temporal stem with different FA thresholds (0.25 and 0.10) are shown. The size of the ellipsoid represents the ADC value, and the shape of the ellipsoids represents the anisotropy. The color represents the direction of the eigenvector. The ellipsoids near the center of the uncinate fasciculus tend to have a smaller diffusivity and larger anisotropy.
An important point of the current study may be the fact that there are no FA thresholds in which the relationship between different groups differs. In every FA threshold, the mean FA value was higher in healthy controls and lower in patients with severe AD, and mean ADC values were lower in healthy individuals. This means that with a constant FA threshold, the essence of the results is not influenced. However, as shown, FA thresholds of 0.10 and 0.25 showed less correlation to the MMSE score. An FA threshold as low as 0.10 might result in contamination of the fibers other than the uncinate fasciculus. In contrast, a threshold as high as 0.25 might overly restrict the number of voxels and result in decreased statistical power. For the uncinate fasciculus, an FA threshold between 0.15 and 0.20 may be optimal for evaluation of diffusion tensor parameters.
There are several limitations to the current study. The first is the small size of the study group (n = 40). However, even though the number of the cases was small, we were able to show statistically significant correlation to the MMSE score by using tract-based analysis. The second limitation is that we evaluated only the uncinate fasciculus; other fiber bundles may show different results. In particular, white matter tracts such as the cingulum, which has discrete anatomic margins, may not be influenced much by FA thresholds. There may also be a limitation to the measurement protocol for diffusion tensor imaging. We used a 6-axis diffusion-encoding gradient, which is a rather small number for diffusion encoding. This is because imaging time should be shorter by using a smaller number of diffusion-encoding gradients, because the subjects of the current study have problems with their cognitive functions. There is a study that indicates the number of diffusion-encoding gradients does not exert any significant effect on visualization of the optic radiation.15 This is also the reason that we selected a shorter acquisition time by using a smaller number of diffusion-encoding gradients in the current study.
Conclusions
For the measurement of the diffusion tensor parameter along the uncinate fasciculus, a higher FA threshold resulted in lower mean ADC values and higher mean FA values along the uncinate fasciculus. Although the relative order was not affected, the FA threshold influenced the measured values of mean FA and mean ADC along the tract. In the current study, appropriate selection of the FA threshold led to a higher correlation between diffusion tensor parameters and the severity of AD. For tract-based analysis of degenerative diseases such as AD, appropriate selection of the FA threshold for tractography is important.
References
- Received March 26, 2009.
- Accepted after revision April 27, 2009.
- Copyright © American Society of Neuroradiology


