Abstract
BACKGROUND AND PURPOSE: Hypertrophic olivary degeneration (HOD) is usually caused by a lesion in the triangle of Guillain and Mollaret and presents clinically as palatal tremor. Although the imaging features have been well described, the temporal course of hypertrophy and T2 signal increase in the inferior olivary nucleus (ION) has not been fully characterized. Our purpose was to evaluate the time course of MR imaging features of HOD caused by a lesion within the triangle of Guillain and Mollaret.
METHODS: The temporal progression of HOD in 45 patients with symptomatic palatal tremor was obtained by extrapolation of combined MR imaging data from six patients treated at our institution and 39 patients reported in the literature. The MR examinations and reports were reviewed for presence of hyperintense signal in the ION on T2-weighted images, hypertrophy of the ION, and an inciting lesion in the triangle of Guillain and Mollaret. The interval between the MR examination and the inciting lesion was determined.
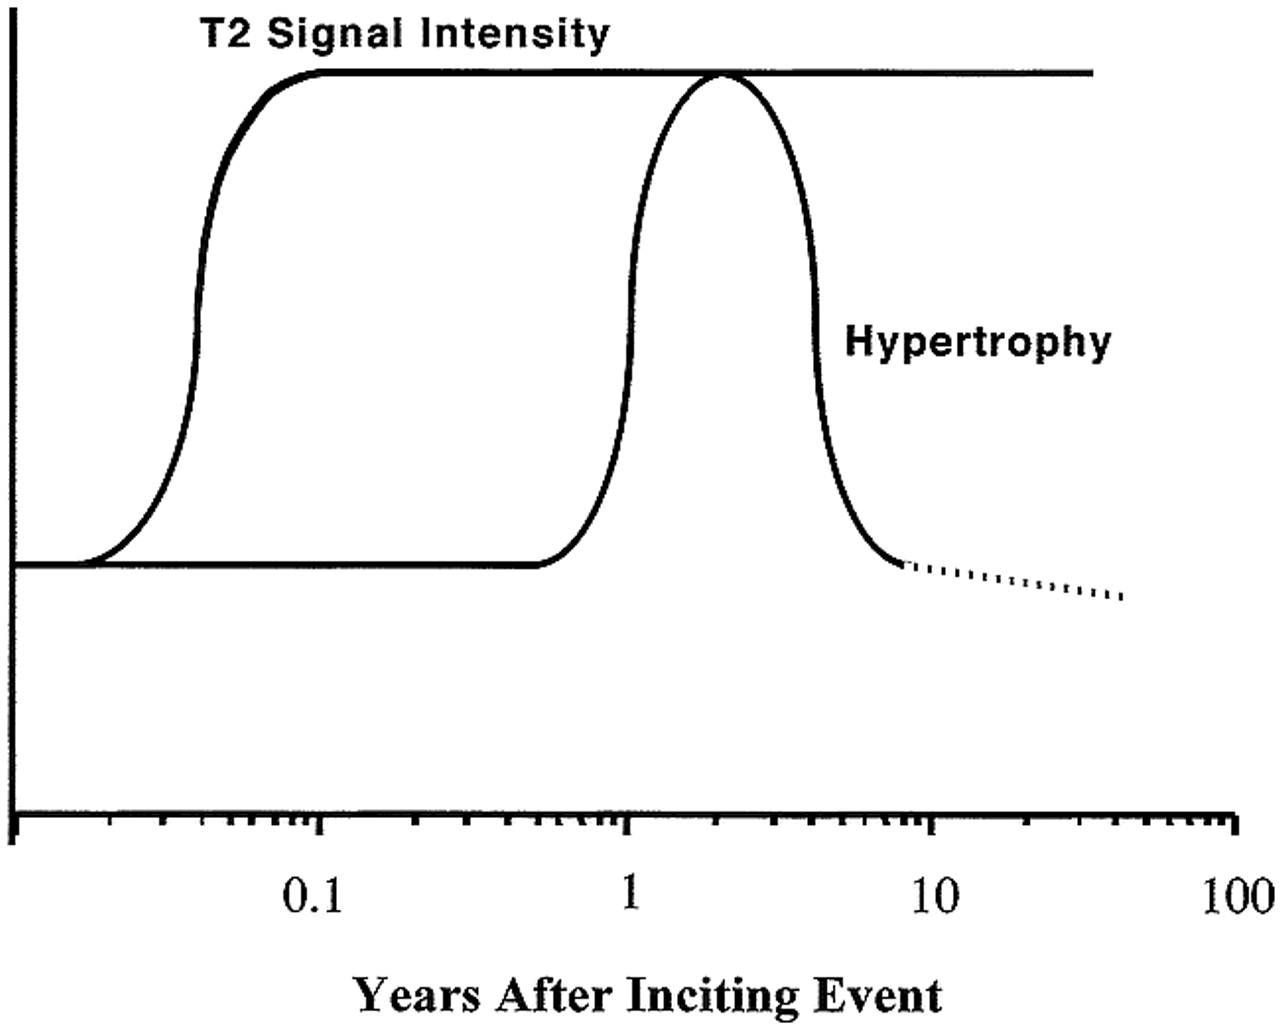
RESULTS: Increased olivary signal on T2-weighted images first appeared 1 month after the inciting lesion and persisted for at least 3 to 4 years. Olivary hypertrophy initially developed 6 months after the acute event and resolved by 3 to 4 years.
CONCLUSION: Visible changes on MR images in the ION in patients with a lesion in the triangle of Guillain and Mollaret correlate well with the described sequential histopathologic findings.
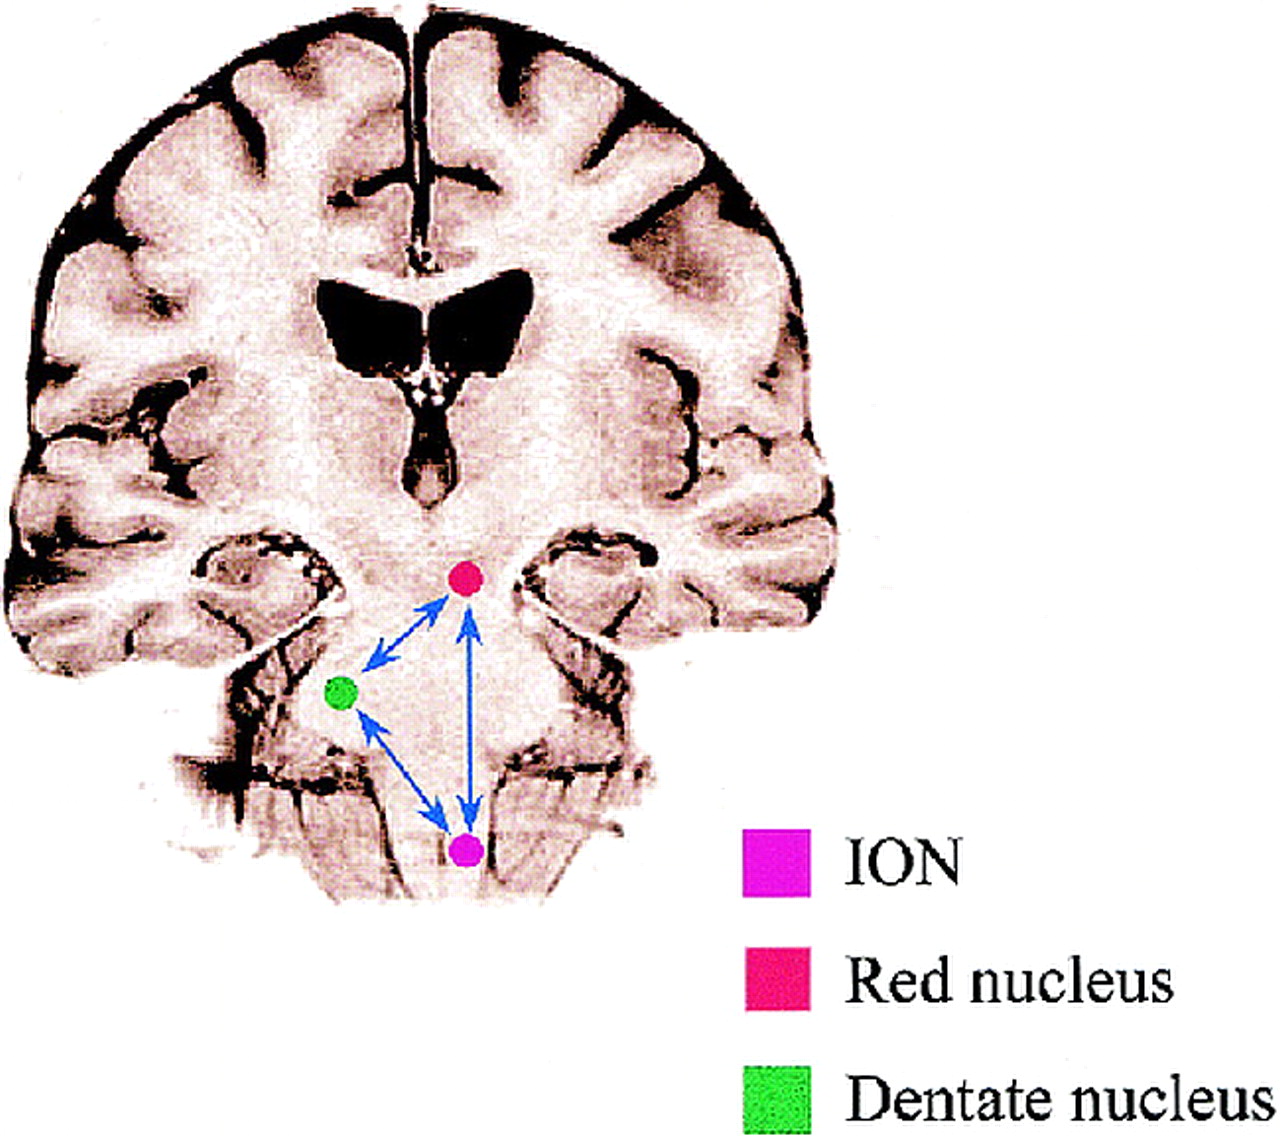
Palatal tremor, also known as palatal myoclonus, is a rare movement disorder that has intrigued investigators since the 19th century (1). Palatal tremor is classified into two forms: symptomatic and essential (2). Symptomatic palatal tremor is usually the result of a lesion in the triangle of Guillain and Mollaret and is associated with hypertrophic olivary degeneration (HOD) that can be seen on MR images as enlargement of the inferior olivary nucleus (ION), with increased signal on T2- and proton density–weighted images. In contrast to symptomatic palatal tremor, essential palatal tremor has no definable cause, no accompanying neurologic findings, and no MR changes suggestive of HOD (3). The triangle of Guillain and Mollaret is defined by three anatomic structures: the dentate nucleus, the red nucleus (although not functionally part of the circuit), and the ION (4).
Although the pathologic changes in HOD and the pathophysiological mechanisms of symptomatic palatal tremor have been well described, there is limited information as to the progression of the disease on MR imaging studies and how such progression correlates with the natural history, owing to a lack of reported cases with a clearly defined relationship between the time of MR imaging and lesion onset. This article delineates the time course of MR signal changes and ION size (hypertrophy) based on a review of the literature and on our own experience in patients with symptomatic palatal tremor.
Methods
An extensive literature review was undertaken to identify reports describing the MR findings in patients with symptomatic palatal tremor and HOD caused by a lesion affecting the triangle of Guillain and Mollaret. In addition, six patients with ION hypertrophy were identified from presenting histories and MR imaging studies obtained at our institution from 1988 to 1998. High signal intensity on T2-weighted images and hypertrophy of the olivae were determined by referring to images of healthy patients as well as by comparing images of the contralateral olivary nucleus. If the shape of the oliva became enlarged and rounded, it was classified as hypertrophic. All patients were imaged on a 1.5-T magnet using sagittal T1-weighted, axial proton density–weighted, and axial T2-weighted spin-echo imaging sequences.
A literature review revealed 39 cases of HOD with a clear inciting lesion in which an MR examination was performed and the timing from the insult to the imaging study was known (5–18). Records that failed to mention the insult or the elapsed time between the insult and the MR examination were excluded from the study (3, 19–21). Including the six cases of HOD added from the records of our institution, we investigated a total of 58 MR examinations in 45 cases. Each MR study provided a separate data point in time for the presence or absence of olivary hypertrophy and increased T2 signal.
Cases were grouped in 1- to 2-month intervals during the first 2 years, 4-month intervals during the 2nd to 3rd year, and yearly intervals during the 3rd to 11th year. In each group, MR studies were assessed for the presence of olivary hypertrophy and hyperintensity on T2-weighted images at intervals dating from onset of the inciting lesion. This permitted the derivation of a general model predicting the temporal course of hypertrophy and T2 signal alteration of the ION in this population of patients.
Results
The presence or absence of olivary hypertrophy and hyperintensity on T2-weighted images from the available 58 MR examinations is depicted graphically in Figures 1 and 2. The derived general model for the temporal course of HOD is shown in Figure 3. The data from the MR images indicate that increased olivary signal on T2-weighted images first appeared 1 month after the inciting lesion and persisted for at least 3 to 4 years. Olivary hypertrophy initially appeared on imaging studies obtained 6 months after the acute event, and resolved by 3 to 4 years.

Time course of olivary hypertrophy. The data points indicate the presence or absence of hypertrophy based on MR findings as a function of time after onset of clinical symptoms. Note that there is a higher density of data points between 0.5 and 5 years for the hypertrophy present category, indicating a high likelihood of finding hypertrophy during this time frame. Also note the absence of hypertrophy both early and late in the course of the disease

Time course of T2 signal intensity changes in HOD. The data points indicate the presence or absence of increased signal on T2-weighted MR images as a function of time after onset of clinical symptoms. Note that increased T2 signal is observed very early in the course of the disease and that the signal increase persists indefinitely

General model of time course of hypertrophy and T2 signal intensity in HOD derived from figures 1 and 2. The negative slope in the dashed line is speculative, suggesting that the oliva becomes atrophic
Among the group of 45 patients, seven were imaged between 1 and 2 months. Of these, five had increased T2 signal and none had hypertrophy. Of the 11 patients imaged between 10 and 18 months, all had hypertrophy and increased signal (Fig 4). After 4 years, seven patients were imaged, of whom five had increased T2 signal (Fig 5) and only one had hypertrophy.

MR examination, 20 months after pontine hemorrhage. Axial T2-weighted fast spin-echo image (TR/TE = 6000/92, echo train length = 12) at the level of the ION shows hypertrophy with hyperintensity of bilateral ION.fig 5. Follow-up axial T2-weighted fast spin-echo image (TR/TE = 5000/105, echo train length = 12) 49 months after hemorrhage into a pontine cavernoma shows hyperintensity in bilateral ION. No evidence of hypertrophy is present
Discussion
Palatal tremor has long been considered a uniform entity, presenting clinically as rhythmic movements of the soft palate and sometimes rhythmic coactivation of muscles innervated by other brain stem or spinal motor nuclei (19). Clinically, however, essential and symptomatic palatal tremor behave differently. Patients with symptomatic palatal tremor usually have symptoms of considerable cerebellar or brain stem dysfunction associated with an acute lesion within the triangle of Guillain and Mollaret, such as results from ischemic injury or hemorrhage with hematoma formation. Patients with essential palatal tremor have no focal lesion but the palatal tremor can produce a self-audible clicking sensation due to activation of the levator veli palatini muscle innervated by the ninth cranial nerve (19). Despite a reasonable understanding of the pathophysiology of the disease, the process that leads to olivary degeneration is unknown. Goto and coworkers (22, 23) have provided a detailed description of the pathologic findings that are helpful in understanding the evolution of MR changes. Using metaanalysis, we attempted to describe the time course of MR changes of HOD, which may potentially form a link between the natural history of the disease and the pathologic changes it produces.
Knowledge of the components of the triangle of Guillain and Mollaret is essential for understanding how lesions affecting the triangle can influence the inferior olivary nuclei. The triangle consists of a set of connecting tracts including the cerebellar dentate nucleus, the brachium conjunctivum, and the contralateral oliva (Fig 6) (24). The efferents from the dentate ascend through the superior cerebellar peduncle, cross in the decussation of the brachium conjunctivum inferior to the red nucleus, and then descend to the ION by way of the central tegmental tract. The triangle is completed by ION efferents crossing the midline, entering the inferior cerebellar peduncle, and terminating on the original dentate nucleus. Although it is an anatomic triangle, symptomatic palatal tremor and HOD are associated with lesions of the first two limbs of the triangle, but not with lesions involving olivodentate fibers, since it is olivary deafferentation that is thought to be the source of the ensuing hypertrophic degenerative changes (4, 13). The olivodentate fibers appear to be important for maintenance of a normal cerebellar hemisphere in the same way that the integrity of the first two limbs of the triangle are essential for the health of the oliva. When the olivodentate fibers are disrupted, cerebellar atrophy can occur. This nourishing role of the oliva is supported by the presence (in four of five cases with lesions in the central tegmental tract) of atrophy of the cerebellar cortex and dentate nucleus contralateral to an inferior oliva with HOD (19). HOD usually occurs unilaterally and ipsilateral to the lesion if the lesion is in the brain stem or contralateral to the lesion if the lesion is in the cerebellum as identified on MR images (5, 7, 8, 11, 12, 15, 17). There has been only one reported case in which a unilateral lesion (from a right cerebellar artery infarct that occurred during craniotomy) resulted in bilateral HOD (15). The reason for this is unclear. A midline lesion, however, if located in the brachium conjunctivum, may result in bilateral HOD if there is involvement of both the right and left dentato-olivary fibers as they cross. One of the patients in our series incurred bilateral HOD from a right midbrain tegmental hemorrhage located near the decussation of these fibers.

Drawing shows the triangle of Guillain and Mollaret
HOD is due to presumed transsynaptic degeneration resulting in vacuolation of neurons (25, 26), an increase in the number of glial cells, demyelination, and shrunken neurons (27, 28). Symptomatic palatal tremor has been associated with a variety of conditions, including degenerative disorders (eg, progressive ataxia with palatal tremor) (12, 16, 21), hemorrhage (5–7, 12), infarction (10, 14), syphilis (29, 30), postencephalitic changes (30, 31), trauma (5, 8, 9, 29, 31), neoplasms (29, 31), and demyelination (31).
The sequence of the pathologic changes in HOD has been documented by Goto and coworkers (22, 23), who performed postmortem studies of patients with primary pontine hemorrhages and who survived for various lengths of time, ranging from 16 hours to 9.5 months after their lesions were acquired. These changes are classified into six phases: 1) no olivary changes, observed within 24 hours after onset; 2) degeneration of the olivary amiculum (the capsule of white matter composing the periphery of the oliva), at 2 to 7 days or more; 3) olivary hypertrophy (the stage of mild olivary enlargement with neuronal hypertrophy and no glial reaction), at about 3 weeks; 4) culminant olivary enlargement (the stage of hypertrophy of both neurons and astrocytes), at about 8.5 months; 5) olivary pseudohypertrophy (the stage of neuronal dissolution with gemistocytic astrocytes), at about9.5 months and later; and 6) olivary atrophy (the stage of neuronal disappearance with olivary atrophy and prominent degeneration of the amiculum olivae), after a few years.
Similarly, Birbamer et al (5) described the evolution of olivary changes after acute lesion onset by assessing MR imaging data obtained in patients. These authors proposed three stages: 1) the acute stage without olivary changes, 2) olivary enlargement and increased signal on T2- and proton density–weighted images, and 3) disappearance of the hypertrophy with some persistence of increased signal.
We also demonstrated three distinct MR stages in HOD and established specific time intervals for these changes, which are in keeping with the findings of Birbamer and coworkers (5, 8, 9) and Revel et al (6). The three stages are based on the fact that increased signal on T2- and proton density–weighted images was observed at approximately 1 month after ictus but that hypertrophy was not usually observed until 6 months after ictus. The first stage shows increased signal on T2- and proton density–weighted images without hypertrophy of the oliva and occurs within the first 6 months of ictus. The second stage shows both increased signal and hypertrophy and ends when hypertrophy resolves at approximately 3 to 4 years after ictus. The third stage only shows increased signal and begins at the time hypertrophy resolves. This stage persists indefinitely. These MR findings appear to correlate with the pathologic descriptions by Goto et al (22, 23). The initial MR change of signal hyperintensity may relate to the initial phases of neuronal hypertrophy (stages 3 to 4 of Goto et al), in which gliosis and increased water content are associated with demyelination and vacuolization. The delayed development of hypertrophy is most likely the result of neuronal and astrocytic hypertrophic precursors to cell death, ultimately leading to atrophy (stage 6 of Goto et al) and olivary shrinkage on MR images. Despite our clear understanding of the histopathologic and MR changes of HOD, the relationship between the temporal evolution of the histopathology, the development of palatal tremor, and the natural history of the tremor is unknown.
Conclusion
In patients with symptomatic palatal tremor, hyperintense signal is present on T2-weighted images within the first month after disease onset, and the hyperintensity persists for many years and may be permanent. Hypertrophy of the olivae, on the other hand, typically appears 10 to 18 months after the insult but may be seen as early as 6 months and disappears by 4 years. These changes are consistent with the histopathologic alterations described for this disorder. This work establishes the utility of MR imaging in assessing the temporal evolution of olivary hypertrophy and the T2 signal increase seen in patients with lesions involving the triangle of Guillain and Mollaret.
Footnotes
1 Address reprint requests to David Mikulis, MD, The Toronto Western Hospital, 399 Bathurst St, Toronto, Ontario, Canada M5T 2S8.
References
- Received February 17, 1999.
- Accepted after revision December 2, 1999.
- Copyright © American Society of Neuroradiology