Abstract
BACKGROUND AND PURPOSE: To our knowledge, no method satisfactory for clinical use has been developed to visualize white matter fiber tracts with diffusion-weighted MR imaging. The purpose of this study was to determine whether superposition of a spin-echo T2-weighted image and a color-coded image derived from three orthogonal diffusion-weighted images could show fiber tract architecture of the brain with an image quality appropriate for accurate reading with a computer monitor.
METHODS: MR images from 50 consecutive cases were reviewed. Three diffusion-weighted images per section were acquired with three orthogonal motion-probing gradients. These images were registered to a corresponding spin-echo T2-weighted image. A color-coded image was synthesized from three diffusion-weighted images by assigning red, green, or blue to each diffusion-weighted image and then adding a spin-echo T2-weighted image with a weighting factor. The ability of the superposed image to delineate the white matter pathways was evaluated on the basis of the known anatomy of these pathways and qualitatively compared with that of the spin-echo T2-weighted image.
RESULTS: The main white matter fiber pathways, in particular the superior longitudinal fascicle, corpus callosum, tapetum, optic radiation, and internal capsule, were more clearly and easily identified on the superposed image than on the spin-echo T2-weighted image. The time required to produce the superposed image was approximately 40 minutes.
CONCLUSION: Superposition of a spin-echo T2-weighted image and a color-coded image created from three orthogonal diffusion-weighted images showed structures of the brain that were not clearly visible on the spin-echo T2-weighted image alone. Such superposition presents images that are easy to interpret correctly.
Diffusion-weighted MR imaging is widely used today for detection of acute ischemic stroke. The contrast on a diffusion-weighted image of the brain is affected by the direction of white matter fiber pathways (1–7). The fibers appear hypointense when running parallel to the motion-probing gradient that sensitizes the diffusion of spins. The fibers perpendicular to the motion-probing gradient appear hyperintense. Although this phenomenon is recognized clinically as a pitfall when interpreting a diffusion-weighted image and quantifying the apparent diffusion coefficient (ADC) (8–11), there have been efforts to depict the white matter fiber tract with the use of this phenomenon (12–23). However, few reports have shown clinical usefulness of the resultant images (24, 25). Usually, calculated maps of ADC are unable to show anatomic detail and thus may not provide more information for diagnosis than do high-spatial-resolution images without quantification, such as those presented by Adachi et al (26). To determine the direction and corresponding diffusivity of white matter fibers, the diffusion tensor that characterizes anisotropic diffusion in 3D has to be calculated from at least seven diffusion-weighted images (27, 28).
A different approach has been proposed by Nakada and Matsuzawa (15). They showed that a color-coded image created from three diffusion-weighted images acquired with three orthogonal motion-probing gradients qualitatively depicts the white matter fiber pathways and that the image has superior signal-to-noise ratio than do calculated diffusion tensor images. However, a diffusion-weighted image has T2-weighted contrast as well as diffusion-weighted contrast (29). Moreover, in clinical settings, diffusion-weighted images are acquired with an echo-planar imaging technique that cannot attain sufficient resolution to show anatomic details. To accurately recognize anatomy is an essential part of image interpretation. In this study, we investigated whether superposition of weighted color-coded images derived from three diffusion-weighted images on a weighted spin-echo T2-weighted image can partly cancel out the T2-weighted contrast and reveal structures in the white matter that are not clearly seen on an ordinary spin-echo T2-weighted image.
Methods
We retrospectively reviewed the images of 50 consecutive patients (27 men and 23 women; age range, 0–87 years; mean age ± SD, 41 ± 25 years) referred for MR imaging in the workup of suspected cerebrovascular disease or tumors. Diffusion-weighted imaging, in addition to conventional MR imaging, was routinely performed in these patients on a system equipped with 1.5-T superconducting magnet and standard head coil (Magnetom Vision; Siemens, Erlangen, Germany), and images of 5-mm section thickness and 3-mm gap were obtained. T2-weighted fast spin-echo images were obtained with the following imaging parameters: 3500/90 (TR/TE), echo train length of 7210 × 256 data acquisition matrix, 200- or 220-mm field of view, two signals acquired. Single-shot echo-planar imaging was performed with a TE of 118, a 96 × 128 data acquisition matrix, and a 220-mm field of view. The image data were automatically interpolated to a 256 × 256 imaging matrix by a built-in function of the MR imaging unit. Four echo-planar images were acquired per section, with a TR of 4700: one image was without motion-probing gradient (low- b-value image), and three images were with a b value of 1000 s/mm2. Motion-probing gradients were applied in three orthogonal directions: the phase-encoding direction (image P), the readout direction (image R), and the direction perpendicular to the imaging plane (image S). The acquisition was repeated twice, and the image pairs with the same parameters were averaged. It took 47 seconds to perform the diffusion-weighted imaging.
Coregistration between Images of the Same Section
MR images were transferred to a personal computer. The echo-planar images were distorted along the phase-encoding direction. Three images with the same b value had similar contrast except for that in the white matter, and the edge of the brain was detected by determination of the threshold after an application of a median filter. Images P and R were registered to image S on the assumption of linear transformation. Image S was registered to the low-b-value image on the assumption of a translation in the phase-encoding direction (only a shift in this direction between S and the low-b-value images was noticed). The low-b-value image was registered to the spin-echo T2-weighted image on the assumption of an image distortion due to spherical paramagnetic substance (air) near the paranasal sinuses and in the temporal bones. A model of magnetic field disturbance caused by these spheres was fitted to image-distortion data obtained by manually marking 30 to 60 anatomic landmarks on the image (see Appendix A for details).
Process of Making a Color-Coded Image
The gray values of images P, R, and S were inverted. From these three images, a color image was created by assigning red, green, or blue to the intensity of each inverted image. Red was assigned to the image that was obtained with a motion-probing gradient in the superoinferior direction (when the imaging plane was transaxial or coronal, red was assigned to image S or P, respectively). Green was assigned to that in the left-right direction. Blue was assigned to that in the anteroposterior direction. Thus, the color image shows fibers running in a superoinferior direction with red, in a left-right direction with green, and in an anteroposterior direction with blue. The fibers running obliquely in the sagittal plane appear magenta, those in the coronal plane appear yellow, and those in the transaxial plane appear cyan. This image has the intensity of the inverted diffusion-weighted image (ie, approximately the product of −exp(−b ADC) and the intensity of the T2-weighted single shot echo-planar image, where b ≈ 0). The color image was then superposed over the spin-echo T2-weighted image to offset the inverted T2-weighted contrast and achieve accurate anatomic detail. With this procedure, every pixel value of the color image multiplied by a constant, C (0 < C < 1), was added to that of the spin-echo T2-weighted image multiplied by 1 − C. The weighting factor was chosen to achieve appropriate color contrast and retain anatomic detail (C = 0.4 in most cases). The dependence of the method on the choice of C is described in Appendix B.
To compare contrast of the superposed image with the ADC contrast, three ADC maps were calculated from the low-b-value image and images S, R, and P separately. These three maps were combined to construct a red-green-blue color image in the same manner as described above. The b value of the low-b-value image was assumed to be zero; it was not actually zero but was small enough compared with 1000 s/mm2.
We tried to identify the main white matter fiber pathways on the superposed color-coded image and on the spin-echo T2-weighted image with the aid of the descriptions and the figures (Fig 1) available in the anatomy literature (30–37).

Dissection of the human telencephalon to show the radiation of the corpus callosum and the superior longitudinal fasciculus. Dorsal view modified from Ranson and Clark (30) with permission from W.B. Saunders Company.
Results
Image processing was successfully performed, and a similar image quality was obtained in all cases. Registration errors among the three diffusion-weighted images were less than one pixel (2.3 mm). The errors for registration between the low-b-value image and the spin-echo T2-weighted image were less than two pixels, except for regions with severe distortion near the paranasal sinus and middle ear. Most errors were within a one-pixel size.
The contrast of the superposed image was similar to that seen with ADC maps (Fig 2 C and D). Anatomic details were more easily recognized on the superposed image than on the calculated ADC contrast image. The following structures were more clearly and easily seen on the superposed image than on the spin-echo T2-weighted image.

Images of a 63-year-old man with right parietal glioblastoma.
A, Conventional fast spin-echo T2-weighted image shows peritumoral white matter edema around the right lateral ventricle that is pressed down by the tumor. The precise location of the right corona radiata and the posterior limb of the left internal capsule are not apparent on this image.
B, Color-coded image constructed from three inverted orthogonal diffusion-weighted images. Fibers running superoinferiorly, anteroposteriorly, and transversely are displayed with red, blue, and green, respectively. Because the T2 shine-through phenomenon counteracts the contrast caused by diffusion, the peritumoral edema is not distinct from normal brain.
C, Color-coded image created from three orthogonal ADC maps.
D, Image after registration and addition of the images shown in A and B has a contrast similar to and a quality superior to those of the image shown in C. The right deep white matter with edema is clearly resolved into three parts: from medial to lateral, the corpus callosum (green, arrow), corona radiata (orange, arrowhead), and superior longitudinal fasciculus (blue, open arrow). The posterior limb of the left internal capsule can be easily identified by the red hue (open arrowhead).
Association Fibers
Superior longitudinal fasciculus and arcuate fasciculus.
The superior longitudinal fasciculus is a large association bundle connecting the frontal lobe with the parietal, temporal, and occipital lobes (Fig 1). Although superior longitudinal fasciculus and arcuate fasciculus are sometimes considered as the same structure, the name arcuate fasciculus is often applied to the part of the superior longitudinal fasciculus that forms a curved shape around the superior and posterior margin of the insula and connects the Wernicke area with the Broca speech area (30–33). In 98% of our cases, the structure that would be the superior longitudinal fasciculus appeared blue on the color image above the insula and lateral to the corona radiata (Figs 2 and 3). In the posterior part, the superior longitudinal fasciculus (arcuate fasciculus) courses vertically as it arches downward to disperse within the temporal lobe (Fig 1), and this should be why this part of the superior longitudinal fasciculus appeared red behind the insula and lateral to the optic radiation in all our cases (Figs 2–4).

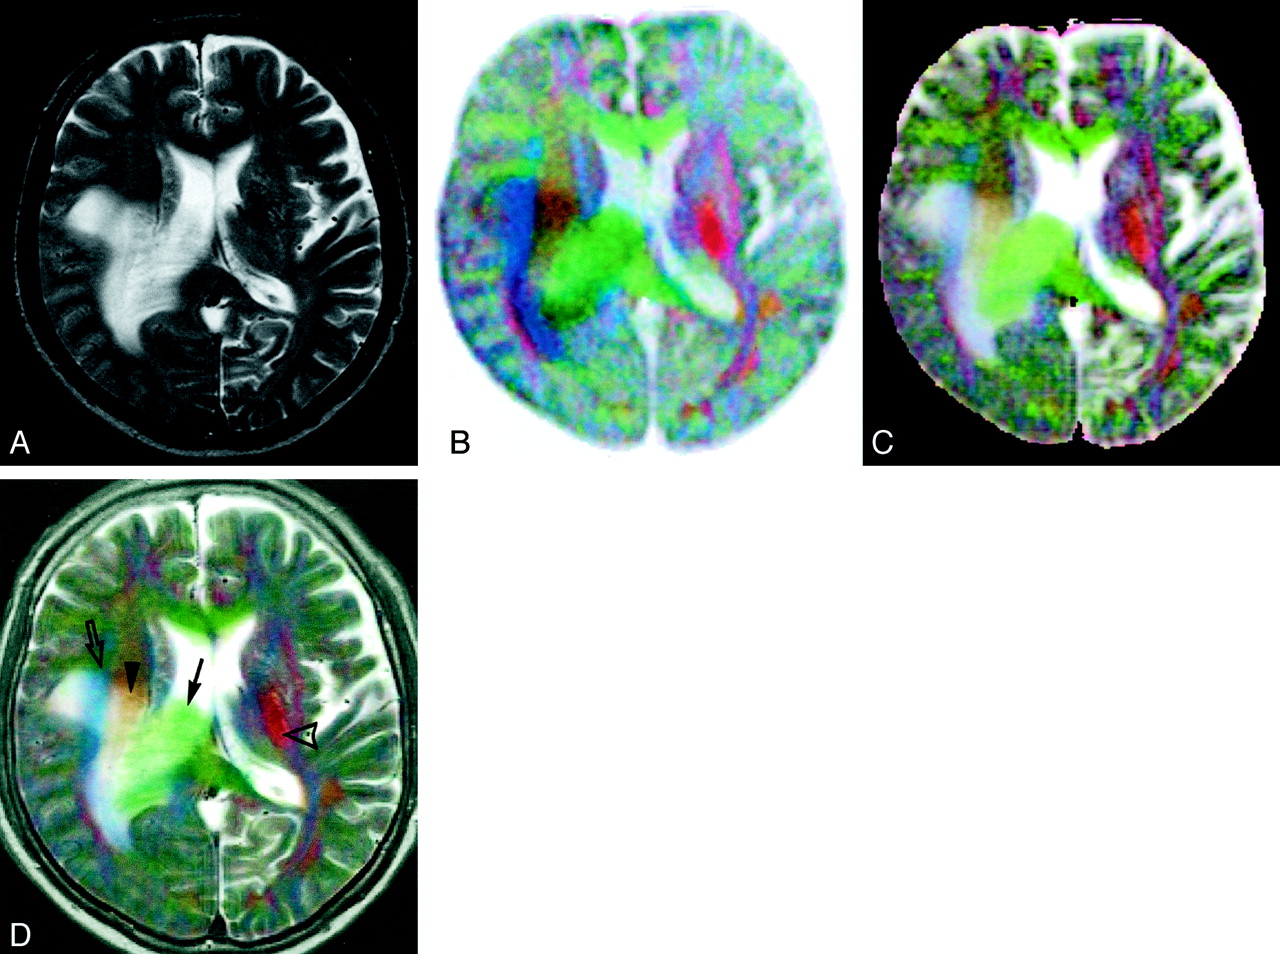
Superposed color images obtained in a 41-year-old woman with dyskinesia. Diagnosis has not yet been established.
A, Axial image. The white matter lateral to the posterior horn of the lateral ventricle appears to be divided into four layers. They are probably, from medial to lateral, the tapetum (red, arrowheads), internal sagittal stratum (dark blue, open arrowheads), external sagittal stratum (bright blue, arrows), and white matter containing the superior longitudinal fasciculus (red, open arrows). The pulvinar of the thalamus appears yellowish green (*).
B, Coronal image. The posterior limbs of the internal capsules are identified as red bands (arrowheads). The external and the extreme capsules (cannot be separated) are seen as reddish sheets (arrows). The superior longitudinal fasciculi appear greenish blue (open arrows). The cingula appear blue (open arrowheads). The inferolateral parts of the temporal lobes show artifact because of the failure to correct severe distortion.

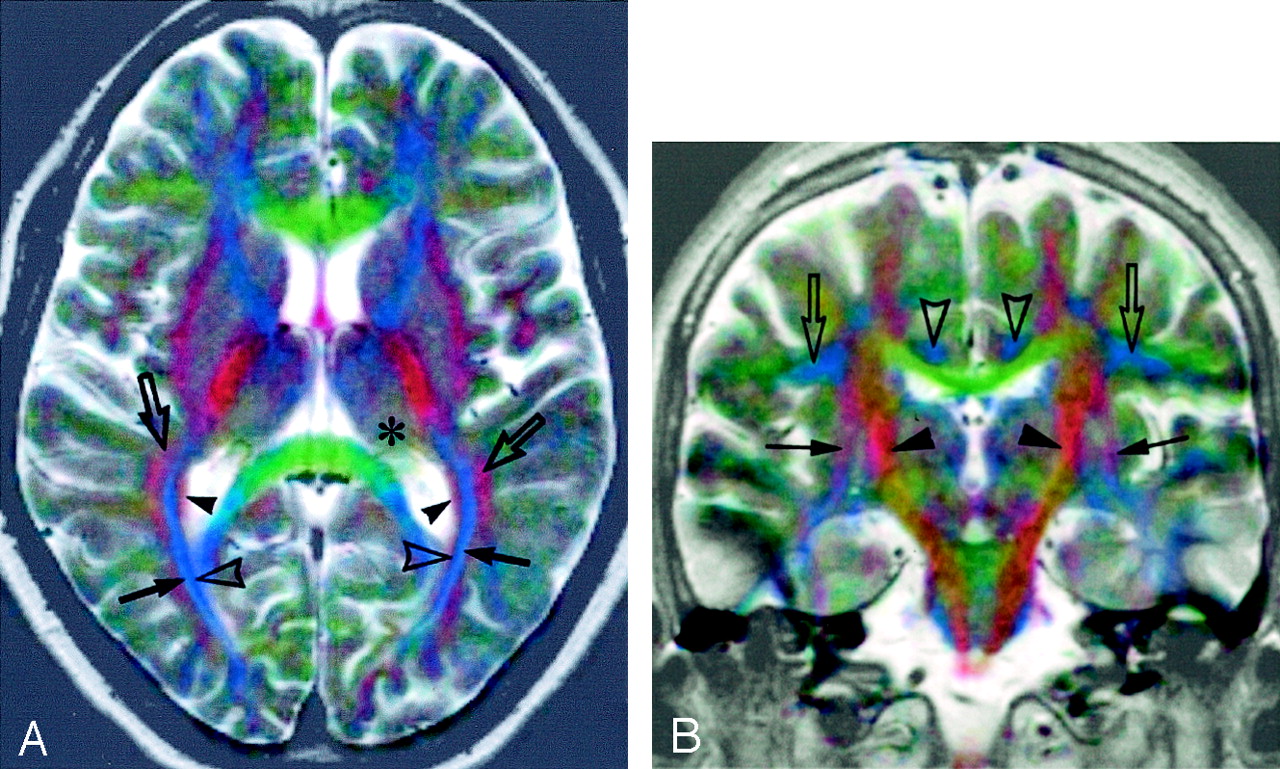
Images obtained in an 84-year-old man with multiple lacunar hemorrhages and infarcts.
A, Spin-echo T2-weighted image shows multiple small foci of hyper- and hypointensity in the basal ganglia and thalami. Linear hyperintensity (arrow) is seen near the right posterior limb of the internal capsule. Spatial relations between the internal capsule and these lesions are unclear.
B, On the superposed image, the posterior limbs and anterior limbs of the internal capsule appear red and blue, respectively. They are easy to identify, and the right internal capsule is situated medially to the linear hyperintensity (arrow).
Uncinate fasciculus.
The uncinate fasciculus connects the cortex of the ventral and lateral surface of the frontal lobe with that of the anterior temporal lobe (33, 34). It passes under the cortex of the limen insulae. The structure probably representing this part of the uncinate fasciculus appeared red to magenta in 94% of the cases (Fig 5).

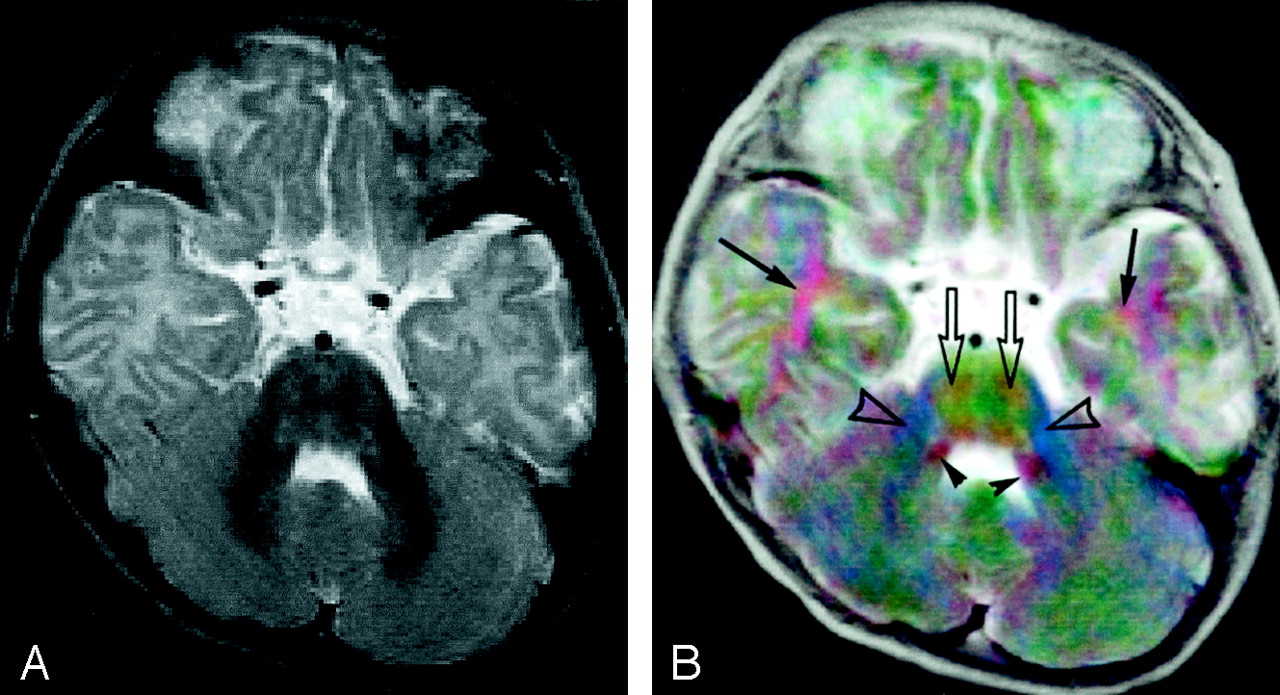
Images of a 6-month-old male patient with epilepsy. No abnormality is found by MR imaging examination.
A, Spin-echo T2-weighted image.
B, Superposed color image. The white matter anterolateral to the inferior horn of the lateral ventricle appears red (arrows). This is probably part of the uncinate fasciculus running up from the temporal pole to the inferior margin of the extreme and external capsule. The pyramidal tract in the basis pontis (red, open arrows) is distinguished from the transverse pontine (pontocerebellar) fiber (green) by the difference in hue. Both the inferior (lateral part) and superior (medial part) cerebellar peduncles appear red (arrowheads) between the fourth ventricle and the middle cerebellar peduncle (blue, open arrowheads).
Commissural Fibers
Corpus callosum and tapetum.
The body of the corpus callosum is not clearly visible on spin-echo T2-weighted axial images (34). It clearly appeared green on the color-coded images in all our cases (Fig 2). Some fibers in the posterior part of the corpus callosum extend inferiorly along the lateral wall of the lateral ventricles and form the tapetum (Fig 1). The structure that would represent the tapetum was clearly identified as a red sheet along the lateral wall of the posterior and inferior horns of the lateral ventricle in 92% of our cases (Figs 3 and 6).

Coronal view images of a 45-year-old woman with lymphoma in the splenium of the corpus callosum.
A, Spin-echo T2-weighted image shows white matter edema around the lateral ventricles. The corpus callosum cannot be clearly recognized.
B, Superposed color image. The corpus callosum is clearly identified as a green structure (arrow). The white matter lateral to the left lateral ventricle appears to have at least three layers: medial to lateral, red (tapetum, arrowhead), blue (internal and external sagittal strata, open arrow), and red layers. The asymmetrically widened tapetum on the left indicates extension of peritumoral edema in this region.
Projection Fibers
Internal capsule.
The posterior limb of the internal capsule was distinct on the color image as a red structure in all our cases (Figs 2–4 and 7) and was always easily identified. The spatial relation between lesions and this structure was clearly seen (Fig 4).

Left sphenoid ridge meningioma in a 54-year-old woman.
A, Spin-echo T2-weighted image.
B, Superposed color image shows the meningioma with certain colors: the anterior and posterior parts appear violet, and the left and right parts are green, which can be interpreted (although it has not been confirmed histologically) to mean that this tumor, as a whole, has a radially oriented internal structure. The posterior limb of the left internal capsule (arrow) appears redder and thinner than the contralateral limb (arrowhead). This indicates that the tumor compresses the limb and deflects its direction vertically.
Optic radiation.
The deep white matter lateral to the posterior and inferior horns of the lateral ventricle is composed of the fiber bundles named (from medial to lateral) the tapetum, the internal sagittal stratum, the external sagittal stratum, and the association bundle containing the superior longitudinal fasciculus (35). The optic radiation is a principal part of the external sagittal stratum. Both sagittal strata run anteroposteriorly in this position and were obvious in 98% of our cases as a blue bundle, in which the inner part appeared dark and outer part appeared bright in 28% of cases because of residual T2-weighted contrast (Fig 3).
Other Features
The pulvinar of the thalamus appeared green (Figs 3 and 4). The superior and inferior cerebellar peduncles were seen as red structures (Fig 5). The pyramidal tract in the basis pontis (red) was distinguished by hue from the transverse pontine fiber (green) (Figs 3 and 5).
The time required to generate both the inverted, color diffusion-weighted image (Fig 2B) and the ADC map (Fig 2C) without registration to the spin-echo T2-weighted image was approximately 10 minutes. The time required to produce the superposed image (Fig 2D) was approximately 40 minutes. Most of the time was spent marking anatomic landmarks.
Discussion
Several methods that use diffusion anisotropy have been proposed to depict the white matter fiber pathways (12–23), and some of those methods use colors (12, 13, 15, 17, 22). Calculation of the diffusion tensor in each voxel is needed to correctly know the fiber direction. However, signal-to-noise ratios of image data are generally degraded by this calculation. The color-encoding approach is not straightforward because of the nonlinearity of human color perception, and accurately quantified representation with the use of colors may be impossible (22). Therefore, calculating complete diffusion tensor elements may not necessarily be the best way to visualize white matter pathways in color representation. When reading images, recognition of anatomic details may be more important than detection of the accurate direction of the fiber. Thus, we assigned color components directly to diffusion-weighted images in a way similar to that reported by Nakada et al (15). The color image obtained in this way will not show accurate direction of the white matter fiber but will have information regarding internal structure of the white matter that may be useful for recognizing precise locations of lesions.
Color images are not suitable for printing on films. They are appropriate for reading on a computer screen. Digital picture archiving and communication systems are now available by virtue of progression in information technology (38). Such systems will be adopted in most hospitals and other health care facilities in the near future. MR images and other digital images will be read routinely on computer displays. Hence, color displaying and registration techniques will be increasingly available and important for reading images.
The appearance of the color image may depend on the choice of the computer display, such as the choice of color scale or screen. The color image generated in our method, however, represents approximate orientation of the white matter fibers. Therefore, a small change in colorization may not impede the recognition of the internal structure of the white matter.
A diffusion-weighted image contains strong T2-weighted contrast due to the long TE of the sequence (29). Therefore, the color image that is created directly from inverted diffusion-weighted images contains inverted T2-weighted contrast, and superposition of the color image on a T2-weighted image will offset the T2-weighted contrast. The use of weighting factors such as C and 1 − C in superposition of the inverted diffusion-weighted and reference spin-echo T2-weighted images, respectively, can further reduce T2-weighted contrast in the color images at the expense of high-resolution anatomic information, as shown in Appendix B. In the present study, we confirmed that the registration and superposition of the color image and the corresponding spin-echo T2-weighted image created a contrast resembling that of an ADC map and that this method produced images showing anatomy at a high spatial resolution with detailed, accurate information regarding the internal structure of the white matter. In particular, the posterior limb of the internal capsule was invariably identified in every case. Generally, identification of this important structure on a spin-echo T2-weighted image is difficult (36, 37).
In a study on the structure of the white matter lateral to the posterior horn of the lateral ventricles, Kitajima et al (35) described the signal intensity of the external sagittal stratum as higher than that of the internal sagittal stratum on T2-weighted images and noted the mean thickness of the external sagittal stratum as 1 mm. In the superposed color image obtained in the present study, the imaging voxel size of the diffusion-weighted images was 220/128 = 1.72 mm in the readout direction, 220/96 = 2 .29 mm in the phase-encoding direction, and 5 mm in the direction perpendicular to the imaging plane. Smaller structures than these will not be recognizable. However, the 1-mm-thick external sagittal stratum, which was smaller than the spatial resolution of a diffusion-weighted image, was distinguished from the internal sagittal stratum in some cases, the former being more hyperintense than the latter. We ascribe this distinction to the high-resolution spin-echo T2-weighted image and residual T2-weighted contrast. Thus, consistent with the results reported by Kitajima et al (35), our findings indicated that on the superposed image, the white matter structure lateral to the posterior horn of the lateral ventricle may be identified from the medial to lateral direction as four separate layers: the tapetum (red), internal sagittal stratum (dark blue), external sagittal stratum (bright blue), and association fibers containing the superior longitudinal fasciculus (red).
Low-spatial-resolution echo-planar images in addition to high-resolution anatomic images have increasingly been acquired during clinical MR imaging examinations. When reading the low-spatial-resolution images, it is important to compare them with the corresponding anatomic images. At our institute, a film of low-resolution diffusion-weighted images is placed on an image viewer side by side with a film of high-resolution spin-echo T2-weighted images. However, the comparison of low- with high-resolution images with different contrast properties is problematic. Image registration makes the comparison straightforward and may help make reading of images easier and more accurate.
We adopted the color, inverted diffusion-weighted image (Fig 2B) to be superposed. If the color ADC map (Fig 2C) or the natural logarithm of the signal intensity of the image was used in the image processing, the intensity of the generated image would reflect ADC more accurately. However, a preliminary study showed that these processes produced images of inferior quality. This is presumably because of a relative decrease in signal-to-noise ratio for small signal intensities when the logarithm is applied.
During clinical MR imaging examinations, spin-echo T1-weighted and spin-echo T2-weighted images are routinely acquired and used for diagnosis. Between them, spin-echo T2-weighted images generally depict more pathologic lesions than do spin-echo T1-weighted images. Other sequences, such as inversion recovery images, were not obtained in our clinical practice. We therefore selected spin-echo T2-weighted images as the anatomic reference. Further study including inversion recovery sequences may help in the understanding of the general characteristics of color, fused images.
In this present study, registration between the diffusion-weighted images could be accomplished semiautomatically to an accuracy of one pixel size. In contrast, registration between the low-b-value image and the spin-echo T2-weighted image was performed manually, resulting in poor accuracy in regions where image distortion was severe. This was also a time-consuming procedure. An automatic registration method is desirable for routine clinical applications (39).
Conclusion
Superposition of a weighted spin-echo T2-weighted image and a weighted color-coded image that was constructed from three echo-planar diffusion-weighted images with orthogonal motion-probing gradients provided excellent contrast without image degradation. The contrast resembled that obtained from the corresponding three orthogonal ADC maps. The procedure added information regarding direction of fibers so that it delineated structures that were indistinct on the spin-echo T2-weighted image. The white matter fiber pathways, in particular the superior longitudinal fasciculus, corpus callosum, tapetum, optic radiation, and internal capsule, were clearly identified. Recognition of the anatomy of white matter will be easier and more accurate on superposed images than on conventional images, and this improved recognition can be clinically useful in the diagnosis of diseases that affect the white matter. For routine clinical practice, development of quick and reliable registration methods is desirable.
Appendix A
Images obtained with single shot echo-planar imaging are distorted because of static magnetic field inhomogeneity. Pixel positions shift in the phase-encoding direction in proportion to the variation of the magnetic field strength. Suppose that a sphere of a paramagnetic substance with a susceptibility, χ ≪ 1, and a radius, a, is placed in a homogeneous static magnetic field. Then the magnetic field change at a point (Q) outside the sphere is proportional to a3 (3 cos2 θ − 1) r−3 within the first order of χ, where r is the distance from the center of the sphere to Q, and θ denotes an angle between the direction from the center of the sphere to Q and the direction of the static magnetic field. Therefore, a point (x,y) in the imaging plane that inclines from the static magnetic field at an angle φ shifts in the phase-encoding direction in proportion to  where d is the distance from the center of the sphere to the imaging plane and (x0,y0) is the coordinate of the center of the sphere projected on the plane.
If a proportional constant is given, image shift can be calculated. A model was constructed by adding the effects of four spheres placed near the frontal sinus, the sphenoid sinus, and in the two temporal bones. The sizes of the spheres were assumed to be nearly the same magnitudes as those of the sinuses. The values of x0 and y0 were determined by investigation of where the sinuses were on the image. In addition to the paramagnetic spheres, linear and quadratic terms were considered to correct image size and part of the distortion: 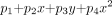 where p1–4 are parameters.
We obtained data for image distortion by manually marking anatomically corresponding points on the spin-echo T2-weighted image and on the low-b-value image. A model with nine parameters (the linear and quadratic terms, the proportional constant, and the 4 ds) was fitted to these data with use of a nonlinear least squares method.
Appendix B
The contrast of a red-green-blue color image is determined by the signal intensity of each red, green, and blue channel. Each color channel has 8-bit, 256 (0–255) gray levels. The brightness of each channel of the fused color image contains the signal intensity of the spin-echo T2-weighted image, I(3500/90; x,y), and the inverted intensity of the single shot echo-planar diffusion-weighted image, S−I(4700/118; b = 0; x,y) exp(−b ADC(ch, x,y)), where S is the maximum intensity of the image, x and y specify the position on the image, and ADC(ch, x,y) is the ADC for each of three color channels (red channel, green channel, or blue channel). The spin-echo T2-weighted image, I(3500/90; x,y), and the single shot echo-planar diffusion-weighted image, I(4700/118; b = 0; x,y), depend on the proton density, T1, and T2.
When the inverted diffusion-weighted image is added to the spin-echo T2-weighted image with a weighting factor, C, the intensity of each channel is equal to 255 [C {S − I(4700/118; b = 0; x,y) exp(−b ADC(ch, x,y))} + (1 − C) I(3500/90; x,y)]/S (1).
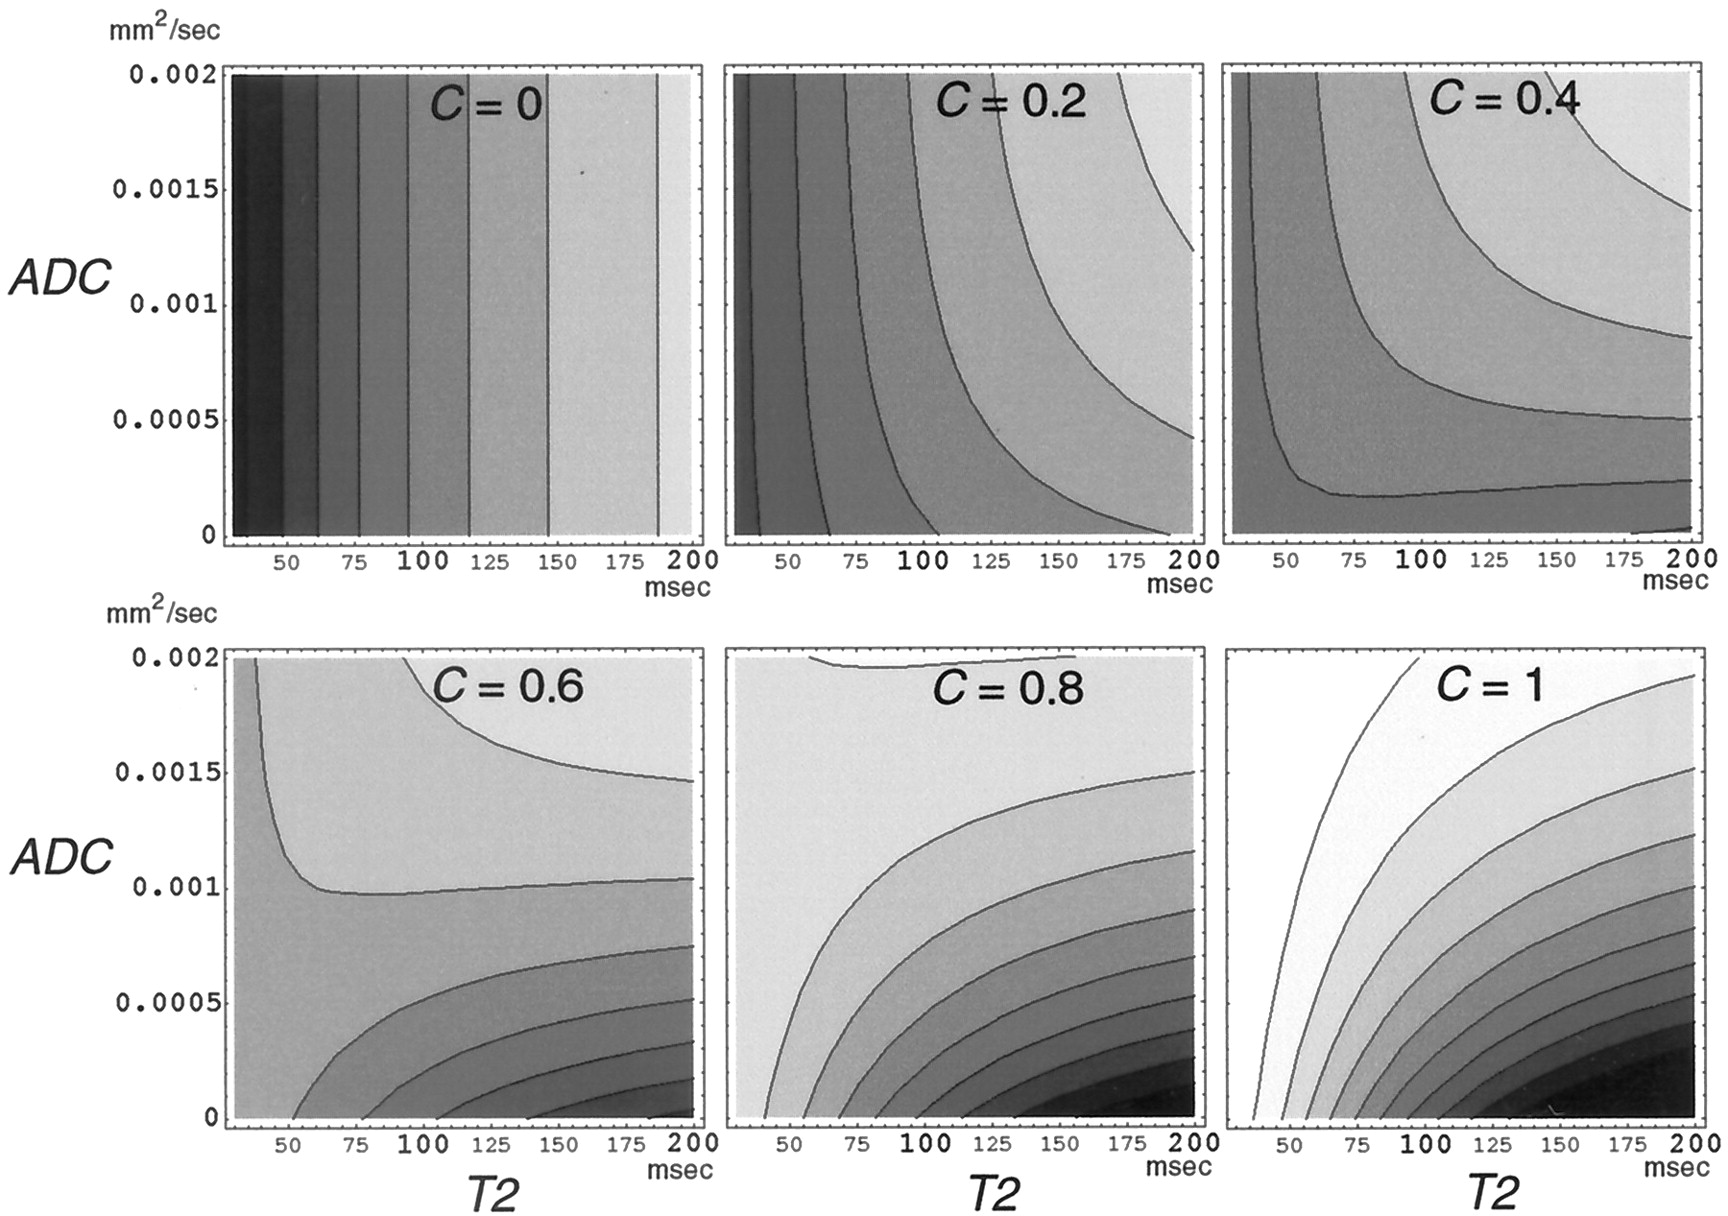
Although this intensity depends on T2 as well as ADC, its dependence on T2 will be less than that of the original diffusion-weighted or spin-echo T2-weighted hyperintensity. It is not clear from simply looking at this equation to what degree T2 affects the intensity. Therefore, a computer simulation with the use of typical signal intensities of the white matter on the spin-echo T2-weighted image and the diffusion-weighted image was performed on the assumption that the proton density and the T1 were constant. The intensity was calculated at various C, T2, and ADC.
The results are shown in Figure 8. When C was small (C = 0, 0.2), the intensity increased as T2 increased. On the other hand, as C grew larger (C = 0.4, 0.6), the change in the intensity with T2 became smaller, at first in the region with the small ADC and then in the region with larger ADC. Because the mean ADC in the normal white matter is approximately 0.0007 (ranging from approximately 0.0002 in the direction perpendicular to the white matter fiber to approximately 0.0014 in the direction parallel to the fiber) mm2/s (16), the change in intensity with T2 can be smallest at C ≈ 0.5. As C grew further (C = 0.8, 1), the intensity decreased with T2, at first in the region with the small ADC and then in the region with the larger ADC, in order.

Brightness of a color channel of the fused image (fusion of spin-echo T2-weighted image and inverted diffusion-weighted image) calculated from equation 1. The brightness is plotted with gray levels for T2 (x axis) versus ADC (y axis) for the weighting factor, C = 0, 0.2, 0.4, 0.6, 0.8, and 1. The brightness for C = 0 or C = 1 contains only the spin-echo T2-weighted contrast or the inverted diffusion-weighted contrast, respectively.
The value of C used in the present study was approximately 0.4, which is smaller than the most adequate value (approximately 0.5) to reduce T2 shine-through effect as shown above. However, the high-resolution anatomic information obtained from the spin-echo T2-weighted image will be lost when C is large.
These results depend on the assumed values of the single-shot echo-planar diffusion-weighted intensity and the spin-echo T2-weighted intensity. However, the dependence of the intensity on T2 will have a similar tendency on different assumptions of these values.
References
- Received January 1, 2001.
- Accepted after revision October 3, 2002.
- Copyright © American Society of Neuroradiology