Abstract
Summary: To our knowledge, this is the first report of hypogonadotropic hypogonadism, or growth hormone deficiency, in a patient without non-Pallister-Hall syndrome who had hypothalamic hamartoma diagnosed on the basis of MR imaging and MR spectroscopy findings. On short-TE proton MR spectra, the N-acetylaspartate concentration in the hamartoma was lower than that in the thalamus but similar to that in the amygdala. However, myo-inositol concentration was elevated in the hamartoma compared with that in the amygdala and thalamus. This report stresses the advantages of short-TE spectroscopy and demonstrates that regional variations in spectra should be considered when reference structures are used.
When hypothalamic hamartomas interfere with growth and pubertal development, they usually cause precocious puberty, acromegaly, or both. Other findings associated with hypothalamic hamartomas include intellectual impairment, seizures (especially gelastic seizures), pressure causing drive to laugh, and speech or behavioral disturbances (1, 2). We report MR imaging and short-TE proton MR spectroscopy findings in a patient who had a hypothalamic mass, behavioral disturbances, short stature, and endocrinologic findings consistent with those of hypogonadotropic hypogonadism and growth hormone deficiency.
MR imaging has become the most precise method for detecting a possible hamartoma, but it can offer only limited information regarding histologic or biochemical constituents. This limitation can impede differentiation of hamartomas from other suprasellar mass lesions, such as those associated with craniopharyngeoma, Rathke cleft cyst, or low-grade glioma. MR spectroscopy has been proposed as a diagnostic tool to supplement MR findings by providing a noninvasive determination of brain metabolites (3); however, reports are scarce because of the rarity of clinically diagnosed hamartomas, and because the central location of hypothalamic hamartomas is a challenge for spectroscopy due to field inhomogeneities of adjacent tissue (ie, air-filled sphenoid cavity and fat-containing structures). In two previous reports (4, 5), only the concentrations of the three main brain metabolites typically found on long-TE spectra, N-acetylaspartate (NAA), creatine (Cr), and choline (Cho), were evaluated.
Case Report
A 17-year-old male patient was evaluated at our pediatric endocrinology department because of short stature and delayed puberty. Neurodevelopmental symptoms had first been noticed at age 7 months, when he presented with deafness after bilateral acute inflammation of the middle ear. His psychomotor development had been notably delayed, especially with respect to balance and fine coordination. He had no history of seizures.
At 17 years old, the patient had the height and exhibited the behavior of a 12-year-old prepubertal boy; he had severe perceptive deafness despite use of a hearing-aid. Height was 150.5 cm with normal body proportions; weight, 42 kg (body mass index, 18.5, head circumference, 53.8 cm; genital development, Tanner stage I; and pubic hair, Tanner stage II. Apart from a very small volume of 0.7 mL each, findings at sonography of the testes were unremarkable. Bone age was 13.3 years. Neurologic examination revealed no evidence of disease. His speech was unclear, dyslalic, and dysgrammatical, but oral communication was, nevertheless, unproblematic. Reading was difficult; free rendering was incomplete and without much comprehension of what had been read. His behavior was childish but friendly and cooperative; he kept completely still during the MR and MR spectroscopy examinations. However, he had allegedly serious behavioral and concentration difficulties at his school for children with special needs. Thorough psychological evaluation led to the conclusion that these difficulties probably resulted from frustration imposed by verbal communication. He had a normal overall nonverbal IQ of 98 (Snijdjers-Oomen Nonverbal test SON-R 5.5-17).
Endocrinologic testing revealed incomplete growth hormone deficiency (IGF-I, 74 ng/mL; IGFBP3, 2670 ng/mL; peak growth hormone level after arginine stimulation, 5.6 mg/L; spontaneous nocturnal growth hormone peak, 5.2 mg/L [mean, 1.26 mg/L]); and a hypogonadotropic hypogonadism (testosterone level, 0.59 nmol/L; gonadorelin (GnRH) findings of basal luteinizing hormone [LH] and follicle-stimulating hormone [FSH] levels, 0.2 and 2.6 IU/L, respectively (both peaked after 30 minutes at 0.5 and 3.5 IU/L, respectively).
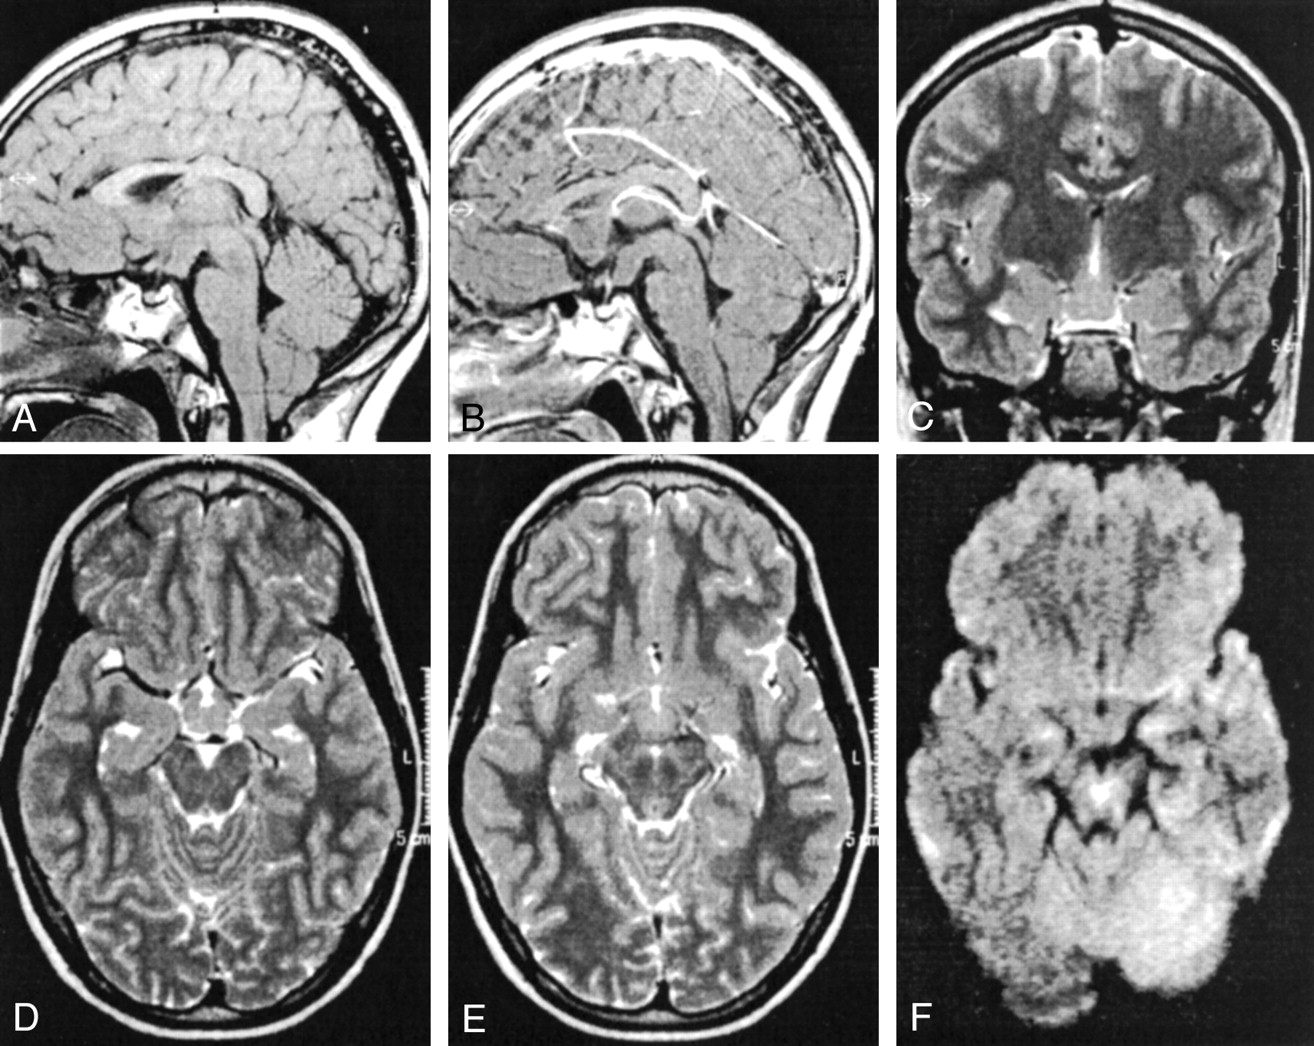
MR imaging and spectroscopy was performed with a 1.5-T whole-body imager (Magnetom Vision; Siemens, Erlangen, Germany). MR imaging consisted of T1-weighted spin-echo (500/12 [TR/TE]) and a T2-weighted turbo spin-echo (5000/119) sequences performed in sagittal, axial, and coronal planes (section thickness, 3 mm), and mean diffusion-weighted images in three orthogonal encoding directions (b = 1000 s/mm2). Images revealed a 1.5 × 1.5 × 1.2-cm tumorlike mass lesion extending from the floor of the third ventricle into the suprasellar cistern. The mass lesion was seen as arising from the thalamus and touching the optic chiasm anteriorly (Fig 1). The tumor base reached the interpeduncular fossa and involved the mamillary bodies. The tumor revealed no contrast enhancement properties, and signal intensity on T2- and diffusion-weighted images most closely resembled that of gray matter.

MR image of hypothalamic hamartoma. Top row, pre- (A) and postcontrast (B) T1-weighted sagittal images T2-weighted coronal image (C). Bottom row, T2-weighted axial images at the level of the supracellular cistern (D) and the interpenduncular fossa (E). Panel F shows a diffusion-weighted image acquired at the level of the interpenduncular fossa. Note the lack of contrast enhancement of the hamartoma (B); signal intensity of the harmartoma is similar to that of cortical gray matter and the amygdala (C). Dorsal fusion with the mammilary body is also apparent (F).
Single-voxel (2.0 × 1.5 × 1.5 cm) proton MR spectroscopy (3000/15) of the mass lesion, as well as control-voxel imaging of the right thalamus and right amygdala, was performed by using a stimulated echo acquisition mode sequence. The spectra were quantified with a modified version of the fit procedure LCModel (6, 7). The most prominent metabolites were NAA, Cho, Cr, myo-inositol (MI), and glutamine/glutamate (Glx).
Differences were considered significant when the respective 95% confidence intervals (calculated from the %SD from the LCModel output) did not overlap, resulting in P < .001 by use of the t test.
Results of MR Spectroscopy
The spectra of the three voxels are shown in Figure 2. Compared with the spectrum from the thalamus (2A), the spectrum of the hamartoma (2B) revealed decreased NAA, increased MI, and slightly elevated Cho (although Cho concentrations did not differ). The spectrum of the amygdala (2C), on the other hand, was quite similar to that of the hamartoma except for the hamartoma’s high MI peak. Table 1 shows the results of the quantification for the major metabolites. Concentrations ratios for NAA, Cr, and Cho were also calculated to provide a comparison with those reported in the literature.

Short-TE spectra of the thalamus (left), hamartoma (middle), and amygdala (right). The locations of the respective volumes of interest are shown in the MR images above the spectra.
Estimated concentrations (mmol/l) from LCModel fit
Discussion
Our patient’s hamartoma was broadly based but did not lead to displacement of the third ventricle. It can thus be classified according to Arita et al (2) as a parahypothalamic hamartoma. Arita et al reported 25 of 30 parahypothalamic hamartomas associated with precocious puberty, only two with seizures, and none with mental retardation, whereas 29 of 31 patients with intrahypothalamic hamartomas had seizures (13 of whom also had precocious puberty), and 20 had some degree of mental retardation. This supports the hypothesis that behavior problems in our patient are caused by factors (perceptive deafness) other than by the hamartoma, because only intrahypothalamic hamartomas are strongly associated with behavior problems.
The hypogonadotropic hypogonadism and growth hormone deficiency in our case remain unexplained. In the 187 publications on hypothalamic hamartoma or hamartoma of the tuber cinereum found in our search of the literature, we found no case of hamartoma associated with either of these symptoms (in a patient without the Pallister-Hall syndrome) or with deafness. The hamartoma may not be associated with our patient’s clinical symptoms; however, precocious puberty in patients with hypothalamic hamartoma is thought to be caused by excessive GnRH secretion by the mass lesion (8), and constant pulseless GnRH administration can suppress LH and FSH secretion (hence the use of GnRH analogs in precocious puberty). Our patient’s hamartoma may thus suppress normal pubertal development by secreting GnRH in unphysiologic pulses or amounts.
Table 2 shows a comparison between the two previous studies and our results. A quantitative comparison was not feasible because of differing MR spectroscopy methods and because, in our study, the ratios are concentration ratios rather than peak ratios. Furthemore, our results (Table 1) are given in terms of absolute concentrations, thus enabling the evaluation of metabolite changes on their own and not only with reference to other metabolites. Tasch et al (5) compared the hypothalamic hamartoma and temporal lobe spectra of five patients with gelastic seizures with spectra of the hypothalamus and temporal lobe of four healthy volunteers. The NAA peak in the hamartomas was reduced by nearly one half that of the hypothalamus and temporal lobe of the control subjects. The hamartoma spectrum had a similar appearance to that of our patient. Pascual-Castroviejo et al (4) described a patient whose hitherto intractable seizures had been controlled by partial hamartoma resection. MR spectroscopy of the hypothalamic hamartoma produced a decreased NAA/Ch ratio but highly increased NAA/Cr ratio as compared with the temporal lobes, a result which somewhat diverges from that of Tasch et al and our own.
Results of hypothalamus hamartoma spectroscopy compared with the literature
In our patient’s hamartoma, the NAA peak was lower than the NAA peak in the thalamus, just as in the report by Tasch et al in which the NAA peak in the hamartomas was lower than that of the reference structures. However, we found a similarly low NAA peak in the amygdala; MR imaging revealed no evidence of disease. Although a decreased NAA peak is regarded as a sign of neuronal degeneration in gliomas (9), it does not necessarily indicate pathologic changes. Studies on the regional dependency of brain spectra have shown marked regional differences, particularly for NAA concentration (10). These results demonstrate that regional variations in spectra should be considered when reference structures are used.
The short-TE sequence in our study also enabled the detection and evaluation of MI. The MI peak was higher in the hamartoma than in either the hypothalamus or amygdala, indicating that MI may be a more reliable marker of hamartomas than NAA. This stresses the advantages of the additional metabolites in short-TE spectroscopy compared with the few standard metabolites found in long-TE spectra as evaluated in the previous studies. MI, a precursor in the phosphatidylinositol second messenger system, is elevated in malignant tumors probably as a result of rapid cell division or neuronal degeneration with release of metabolites (11). Hypothalamic hamartomas, however, show neither rapid cell division nor neuronal degeneration, and little is known about their inositol signaling pathway. Short-TE spectra of tuber cinereum hamartomas with more typical clinical presentations may reveal different results for MI and Glx. The questions of whether a high MI peak is typical for hamartoma in general and whether short-TE spectroscopy allows differentiation of hamartoma from subtypes remain.
Conclusion
We have presented a case of parahypothalamic hamartoma associated not with precocious puberty, as would be expected, but with hypogonadotropic hypogonadism and growth hormone deficiency. Short-TE MR spectroscopy of the hamartoma was compared with that of the thalamus and amygdala. The divergent spectra of the two reference structures left myo-inositol as the only specifically elevated metabolite. Short-TE and careful selection of several reference structures is thus recommended in MR spectroscopy of aberrant brain parenchyma.
Acknowledgments
We thank Franziska Hösl for technical assistance.
Footnotes
Supported by grant NA 395/2–1 awarded by the Deutsche Forschungsgemeinschaft.
References
- Received July 9, 2002.
- Accepted after revision October 8, 2002.
- Accepted after revision October 8, 2002.
- Copyright © American Society of Neuroradiology