Abstract
BACKGROUND AND PURPOSE: The purpose of this study was to determine whether, in acute stroke patients treated with intra-arterial (IA) recanalization therapy, CT perfusion (CTP) can distinguish ischemic brain tissue destined to infarct from that which will survive.
METHODS: Dynamic CTP was obtained in 14 patients within 8 hours of stroke onset, before IA therapy. Initial quantitative cerebral blood volume (CBV) and flow (CBF) values were visually segmented and normalized in the “infarct core” (region 1: reduced CBV and CBF, infarction on follow-up), “penumbra that infarcts” (region 2: normal CBV, reduced CBF, infarction on follow-up), and “penumbra that recovers” (region 3: normal CBV, reduced CBF, normal on follow-up). Normalization was accomplished by dividing the ischemic region of interest value by that of a corresponding, contralateral, uninvolved region, which resulted in CBV and CBF “ratios.” Separate CBV and CBF values were obtained in gray matter (GM) and white matter (WM).
RESULTS: Mean CBF ratios for regions 1, 2, and 3 were 0.19 ± 0.06, 0.34 ± 0.06, and 0.46 ± 0.09, respectively (all P < .001). Mean CBV ratios for regions 1, 2, and 3 were similarly distinct (all P < .05). Absolute CBV and CBF values for regions 2 and 3 were not significantly different. All regions with CBF ratio <0.32, CBV ratio <0.68, CBF <12.7 mL/100 g/min, or CBV <2.2 mL/100 g infarcted. No region with CBF ratio >0.44 infarcted. GM versus WM CBF and CBV values were significantly different for region 2 compared with region 3 (P < .05).
CONCLUSIONS: In acute stroke patients, quantitative CTP can distinguish ischemic tissue likely to infarct from that likely to survive.
In anterior circulation strokes, intra-arterial thrombolytic agents appear beneficial when given within 6 hours of stroke onset,1 and mechanical clot retrieval has been used as long as 8 hours after the onset of stroke.2 Neuroimaging selection criteria for reperfusion therapy are usually based on CT findings.3, 4 Patients with intracrania hemorrhage, hypoattenuation throughout more than one third of the middle cerebral artery vascular territory, or intracranial masses are typically excluded.
Rapid and reliable distinction of irreversibly injured ischemic tissue from tissue that can be salvaged with reperfusion therapy in the first hours after stroke onset would be of great clinical value. First-pass CT perfusion (CTP) can characterize cerebral perfusion with quantitative parameters such as cerebral blood volume (CBV), cerebral blood flow (CBF), and mean transit time (MTT).5, 6 Previous studies have demonstrated that regions with low CBV correlate very well with initial diffusion MR imaging abnormality and with final infarct size, even in successfully recanalized patients.7, 8 Consequently, the CBV abnormality is considered a core of tissue highly likely to infarct.
Within hours of stroke onset, there is frequently a region characterized by normal CBV but abnormal CBF that is thought to contain ischemic penumbra.9 Previous studies have demonstrated significant differences in MR imaging CBF values in penumbra that infarcts versus penumbra that recovers, in patients who received conventional therapies.10–12 It is important to keep in mind that, in these MR imaging studies, penumbra was defined “operationally” as regions with normal diffusion-weighted images (DWIs) but abnormal CBF or MTT values. Other studies have also demonstrated good correlation between MR imaging and CT-defined CBV and CBF abnormalities.13
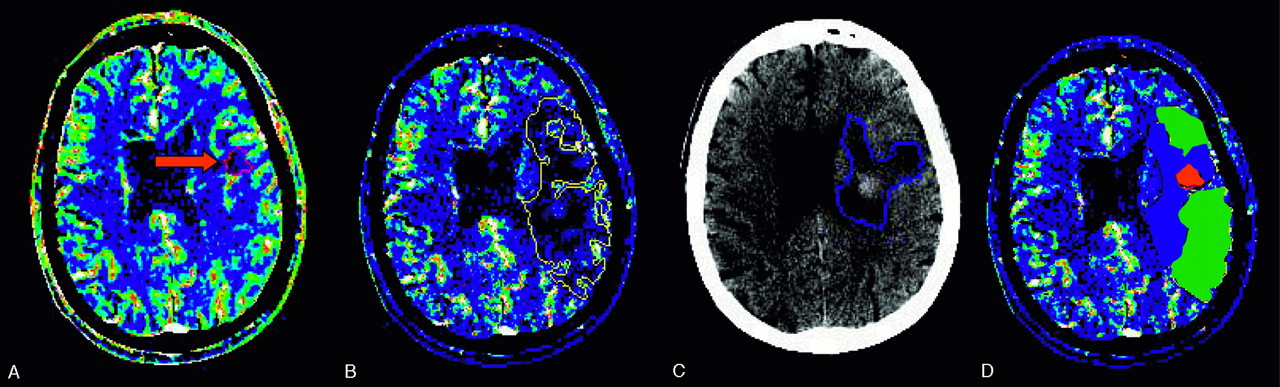
We hypothesized that CTP parameters may be important in differentiating hypoperfused but potentially viable tissue from irreversibly injured tissue following IA recanalization therapy. We assessed differences in CBF and CBV in 3 regions defined with CTP: (1) infarct core, (2) ischemic penumbra that infarcted, and (3) ischemic penumbra that recovered (Fig 1). Because normal gray matter (GM) and white matter (WM) have different absolute CBV and CBF values, we also investigated perfusion differences in ischemic gray matter (GM) versus white matter (WM).

A 61-year-old male patient with right hemiparesis imaged at 2.3 hours and 3 days. Abnormal areas are outlined on CBV (A), CBF (B), and follow-up CT (C) images. After coregistration, we defined 3 regions on CBF maps (D): region 1 (red), “infarct core”—abnormal on CBV, CBF, and follow-up CT images; region 2 (blue), “penumbra that infarcts”—normal on CBV but abnormal on CBF and follow-up CT images; and region 3 (green) “penumbra that recovers”—abnormal on CBF but normal on CBV and follow-up CT images.
Materials and Methods
Patient Selection
Records of all patients who underwent intra-arterial (IA) revascularization procedures within 8 hours of stroke onset between February 1, 2001, and October 31, 2003, were reviewed. Inclusion criteria for subsequent analysis were (1) ICA terminus, M1, or M2 occlusion on conventional angiogram; (2) CTP images acquired before revascularization; and (3) follow-up CT or T2-weighted MR images. Fourteen patients were identified. Medical records were reviewed for National Institutes of Health Stroke Scale, discharge modified Rankin scores, and all other clinical information. Our institutional review board approved the study.
Imaging
CT and CTP imaging were performed on a multidetector helical scanner (Light Speed; GE Medical Systems, Milwaukee, Wisc). Unenhanced head CT was obtained with 5-mm contiguous axial images, 140 kVp, 170 mA, 1-second rotation. CTP was performed as a 60-second cine series, beginning 5 seconds after the administration of 45 mL of contrast at 7 mL/s (Omnipaque, 300 mg iodine/mL; Amersham Health, Princeton, NJ). Imaging parameters were 80 kVp, 200 mA, 1-second rotation time, 4 contiguous sections, 60 images/section, and 5-mm section thickness.
Data Analysis
CBV and CBF maps with 0.49-mm pixel resolution were created from CTP data with perfusion analysis software (Advantage workstation, Functool 4.0; GE Medical Systems). To obtain arterial input and venous output functions, we placed 2–4-pixel squared endoluminal regions of interest in the largest orthogonal artery and vein, respectively. Typically, the contralateral distal ICA was used as the arterial input function, and the superior sagittal sinus in the region of the torcula was used as the venous output function. We were careful to avoid volume averaging and truncation of time course curves.
Areas of low CBV and CBF were outlined with image analysis software (ALICE; Hayden Image Processing Solutions, Denver, Colo). Follow-up images were coregistered with the CT angiography (CTA) source images (Medex; Sensor Systems, Sterling, Va), which in turn are implicitly coregistered with the CTP maps—obtained immediately following, and at the same angle as, the CTA source images. Following coregistration, visual inspection of identifiable anatomic structures demonstrated excellent correlation between the CTP maps and follow-up images. Subsequently, infarcted tissue (CT hypoattenuated or T2 hyperintense) was outlined on the follow-up images. Next, follow-up and CBV lesion outlines were copied onto the CBF maps. Three regions were defined (Fig 1): region 1, “infarct core”—infarcted tissue with decreased CBV and CBF on initial scans; region 2, “penumbra that infarcts”—infarcted tissue with normal CBV but decreased CBF; and region 3 “penumbra that recovers”—unaffected tissue with normal CBV but decreased CBF.
Regions similar to regions 1, 2, and 3 were obtained in uninvolved, contralateral brain on the CBF images. For normalization, we chose contralateral regions of interest with histologic composition (ie, GM-to-WM ratio) similar to that of the ischemic regions of interest, to minimize the effects of differences in baseline perfusion values in GM and WM on the resulting CTP ratios. The mean quantitative CBF value of each abnormal region was calculated and divided by the corresponding normal contralateral region value to obtain CBF ratios for each patient. All regions were transferred onto the CBV images. Mean quantitative CBV values and ratios were similarly obtained. Subsequently, by visual inspection, small 3 × 3 pixel regions of interest were arbitrarily placed in areas clearly identifiable as purely GM or purely WM in regions 2 and 3 on the CBF maps; these were subsequently copied onto the CBV maps. Absolute CBV and CBF values were obtained, though ratios were not obtained, because heterogeneity between varying proportions of GM and WM within the regions of interest was not an issue in this analysis.
Cerebral angiograms following treatment were graded with the Mori scale14: grade 0—complete occlusion; grade 1—distal movement of thrombus without improving perfusion; grade 2—partial recanalization with perfusion in <50% of the ischemic area; grade 3—partial recanalization with perfusion in >50% of the ischemic area; and grade 4—complete recanalization with full return of perfusion.
Statistical Analysis
Two-way analysis of variance for randomized blocks was used to compare mean values within the 3 regions for CBV and CBF ratios and absolute values in the 12 patients with all 3 regions defined. Pairs of regions were compared by post hoc analysis (least square mean) when the overall test for regions was significant. To compare GM and WM CBV and CBF in region 2 versus 3, we performed a paired 2-tailed t test. Regions were considered significantly different with P < .05. Receiver operator characteristic (ROC) curves were generated from the region of interest results for CT CBF ratios in the patients with substantial recanalization (5 patients with Mori grade 3 or 4) and in those without substantial recanalization (9 patients with Mori grade 0, 1, or 2) by using Internet-available software developed by University of Chicago statistician Charles Metz.
Results
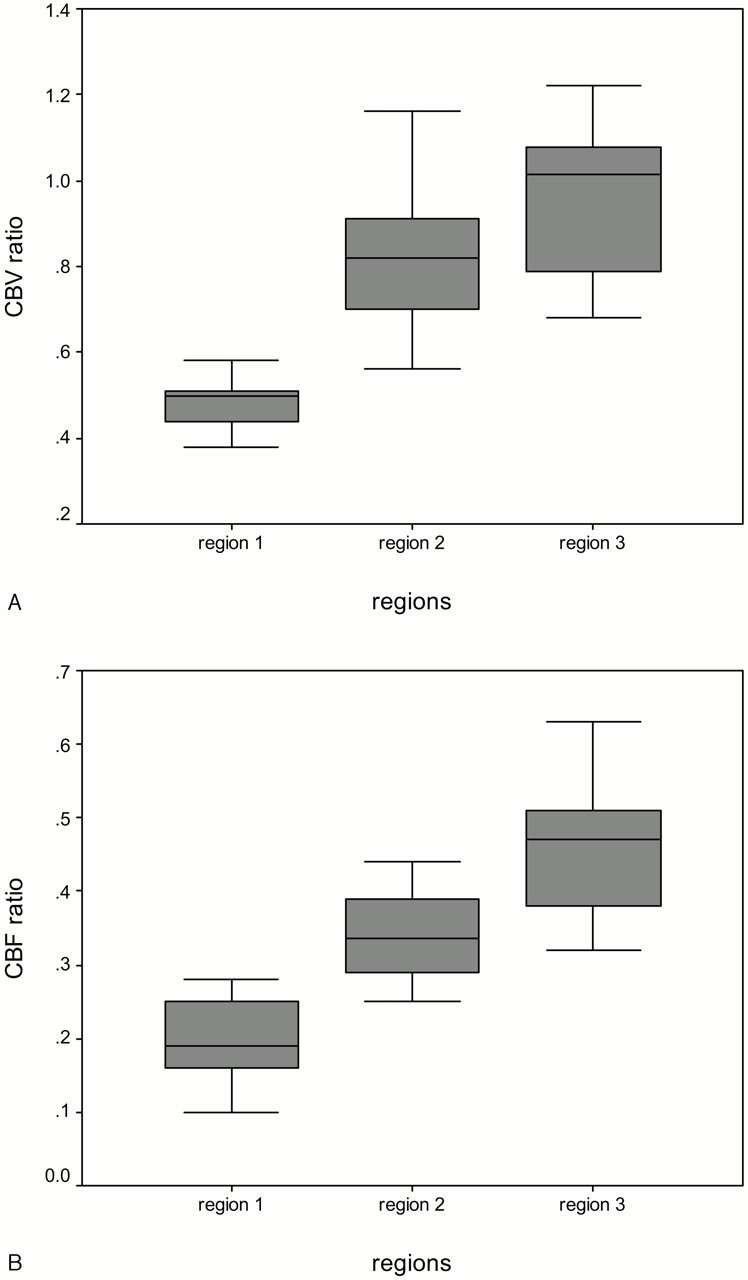
Demographic data and treatment characteristics are presented in Table 1; CBV and CBF mean absolute values and ratios for regions 1–3 are presented in Table 2; and Box and Whisker graphs of CBV and CBF lesion ratios are presented in Fig 2. Region 1 was present in 13 patients, region 2 in 14 patients, and region 3 in 12 patients. For CBV and CBF ratios and absolute values, there was a highly significant difference for region 1 versus region 2 (P < .0001 for all cases). There were also significant differences for region 2 versus region 3 for CBV and CBF ratios, but not for CBV and CBF absolute values. CBF ratio demonstrated the most significant difference for region 2 versus region 3 (P < .0001). All regions of interest with a mean CBF ratio <0.32 demonstrated infarction, whereas all regions of interest with a mean CBF ratio >0.44 appeared normal at follow-up. No region of interest with a CBV ratio <0.68, an absolute CBF < 12.7 mL/100 g/min, or an absolute CBV < 2.2 mL/100 g appeared normal at follow-up. In individual patients, regions 2 or 3, or both, had mean CBV ratio >1.

Box and Whisker graphs of normalized CBV (A) and CBF ratios (B) in regions 1–3.
Demographic data and treatment characteristics
CTP ratios and absolute values for regions 1–3
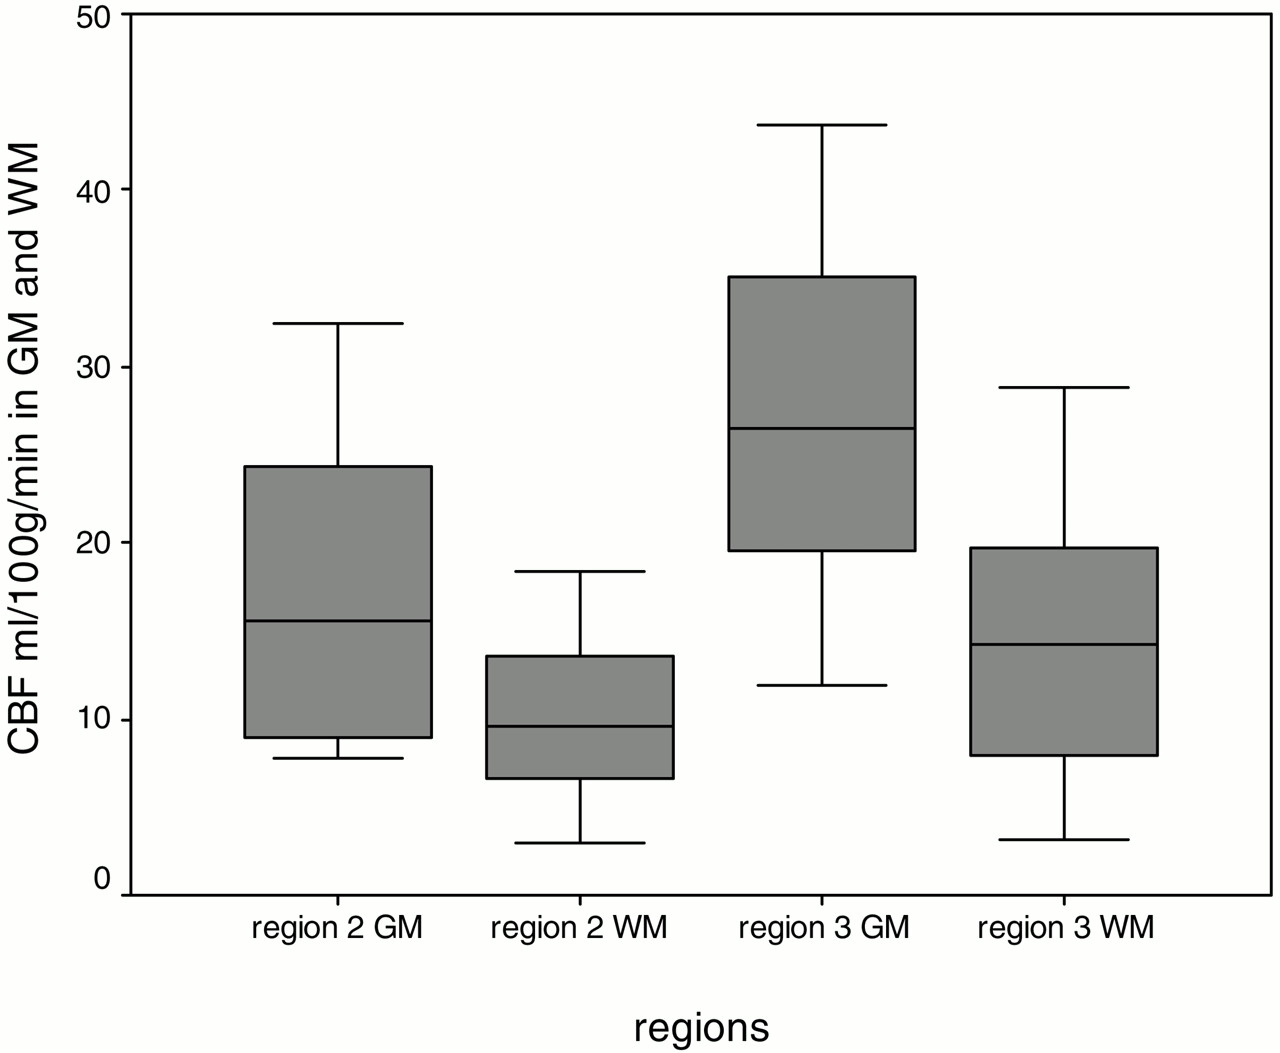
Mean CBV and CBF absolute values for regions 2 and 3 in GM and WM regions of interest are presented in Table 3; Box and Whisker graphs of CBF absolute values for GM and WM for regions 2 and 3 are presented in Fig 3. Mean GM versus WM CBF and CBV values were significantly different for regions 2 and 3 (P < .05). Mean GM CBF values for region 2 versus region 3 were significantly different (P = .01). All GM regions of interest with mean CBF > 32.4 mL/100 g/min appeared normal, whereas all GM regions of interest with a mean CBF < 11.9 mL/100 g/m were infarcted at follow-up. There was no significant difference between regions 2 and 3 for WM CBF, GM CBV, or WM CBV.

Box and Whisker graphs of mean GM and WM quantitative CBF values for each patient in regions 2 and 3.
CTP absolute values for penumbra that infarcts (region 2) and penumbra that recovers (region 3) in gray and white matter
In the 5 patients with substantial recanalization (post-treatment Mori grade 3 and 4), the mean CBF ratio in region 3 was 0.42 (range, 0.34–0.52), whereas in the patients without substantial recanalization, the mean CBF ratio in region 3 was 0.49 (range, 0.32 –0.63). The difference approached statistical significance (P = .068 single-tailed t test; P = .14 2-tailed t test). Similarly, in the 5 patients with substantial recanalization, the mean GM CBF value in region 3 was 21.99 mL/100 g/min (range, 11.86–34.7 mL/100 g/min), whereas in the 9 patients without substantial recanalization the mean GM CBF value in region 3 was 30.89 mL/100 g/min (range, 16.19–43.73 mL/100 g/min). The difference approached statistical significance (P = .060 single-tailed t test; P = .12 2-tailed t test). Also, in the 5 patients with substantial recanalization, the mean WM CBF value in region 3 was 9.18 mL/100 g/min (range, 3.07–21.37 mL/100 g/min), whereas in the 9 patients without substantial recanalization, the mean WM CBF value in region 3 was 17.46 mL/100 g/min (range, 10.03–28.84 mL/100 g/min). The difference was statistically significant (P = .04 single-tailed t test; P = .07 2-tailed t test).
ROC analysis demonstrated that ischemic regions with >66% reduction in CT-CBF ratio have a >95% positive predictive value for infarction, regardless of whether there is substantial recanalization. Ischemic regions with <50% reduction in CT-CBF ratio, however, have a >90% positive predictive value for survival even if there is not substantial recanalization.
Discussion
First-pass dynamic CTP allows quantitative assessment of CBF and CBV and has been effectively incorporated with CT and CTA into acute stroke protocols.9, 15–17 We sought to determine whether CTP maps are useful in evaluating an operationally defined ischemic penumbra in acute stroke patients treated with IA recanalization procedures. We demonstrated that CTP maps might be useful in differentiating hypoperfused tissue destined to infarct, from hypoperfused tissue destined to recover, and established thresholds for CBF reduction that distinguish these regions. Moreover, we demonstrated that these thresholds are significantly different in GM and WM.
Specifically, we found that the CT CBF ratio is the best parameter for distinguishing these 2 regions. No region of interest with a mean CBF ratio <0.32 appeared normal at follow-up, whereas all regions of interest with a mean CBF ratio >0.44 appeared normal at follow-up. ROC analysis suggested that ischemic regions with >66% reduction in CT-CBF ratio (ratio <0.34) have a >95% positive predictive value for infarction, regardless of whether there is substantial recanalization, whereas ischemic regions with <50% reduction in CT-CBF ratio (ratio >0.5), have a >90% positive predictive value for survival even if there is no recanalization. Although the mean CBV ratios and mean absolute values of CBF and CBV have more overlap, they provide adjunctive information. No region of interest with a CBV ratio <0.68, an absolute CBF <12.7 mL/100 g/min, or an absolute CBV <2.2 mL/100 g appeared normal on follow-up. The latter compares well with the CBV threshold for “core” of 2.5 mL/100 g selected by Wintermark et al.9 In that study, however, predefined threshold values for CBV and CBF were used and no distinction was made between viable and nonviable penumbra.
The original concept of penumbra derives from experimental studies in which 2 ischemic thresholds were defined.18 Below one CBF threshold, there was functional cessation of cortical function. Below a second CBF threshold, there were additional biochemical changes signifying cellular disruption. With advanced neuroimaging and new stroke treatments, an “operationally defined penumbra” that identifies hypoperfused but potentially salvageable tissue has gained acceptance.19, 20 With MR imaging, penumbra is considered tissue that is normal on diffusion but abnormal on perfusion images. Similar to previous CTP studies,9 we defined penumbra as the mismatch between the CT/CBV and CT/CBF lesion size. Although the physiology underlying acute stroke CBV changes is complex, multiple studies have suggested a strong correlation between CT/CBV and minimal final infarct size.7–9 CT/CBV lesions typically are not reversible.
Our results by using CTP—a fast, affordable, readily available imaging technique—are consistent with other literature addressing perfusion parameters in infarct core and operational penumbra in acute stroke patients. Our results for CBF ratios of 0.19, 0.34, and 0.46 for core, penumbra that infarcted and penumbra that recovered, respectively, are in agreement with a single-photon emission tomography study that showed that ischemic tissue with CBF >35% of cerebellar flow may be salvageable with recanalization within <5 hours of the onset of symptoms.21 Our results are also in agreement with MR studies (with operational penumbra defined as the DWI/CBF or DWI/MTT mismatch). Reported CBF ratios for core, penumbra that infarct, and penumbra that recover are 0.12–0.26, 0.35–0.42, and 0.58–0.78, respectively.19, 22, 23
With regard to CBV ratios, which were significantly different in the 2 penumbral regions, there was more overlap between CBV values than with the CBF ratios. Our results for the CBV ratios are also in agreement with those of MR studies that reported ratios ranging from 0.25–0.89 for core, 0.69–1.44 for penumbra that infarct, and 0.94–1.29 for penumbra that recover.11, 19, 22, 23 Furthermore, low CBV correlated with infarction at follow-up, though elevated CBV did not necessarily indicate tissue viability. Of interest, regions with elevated CBV were also not infrequently observed; both regions 2 and 3 included individual mean CBV ratios >1. The finding of elevated CBV in the penumbra is in accordance with positron-emission tomography studies demonstrating an initial rise in CBV to maintain CBF followed by a drop in CBV as capillary beds collapse and ischemic injury occurs.24
Variability in CBV and CBF mean region of interest values both within our study group and between the studies discussed above likely results from a number of factors. Timing and degree of reperfusion may be the most important factor, though time to scan also contributes. Jones et al demonstrated in monkeys that both severity and duration of CBF reduction for as long as 4 hours define an infarction threshold.25 The threshold for tissue infarction with reperfusion at 2–3 hours was 10–12 mL/100 g/min, whereas the threshold for tissue infarction with permanent occlusion was 17–18 mL/100 g/min. We divided our patient population into those with complete recanalization (Mori grades 3 and 4) with ischemia for a shorter time versus those with incomplete recanalization (Mori grades 0–2). Indeed, we found a trend toward lower mean CBF ratio, lower GM CBF, and lower WM CBF in penumbra that recovered in patients with complete recanalization versus those with incomplete recanalization.
Another important factor is histologic heterogeneity. Normal CBF and CBV for GM are approximately 60 mL/100 g/min and 4 mL/100 g, respectively, whereas normal CBF and CBV for WM are approximately 25 mL/100 g/min and 2 mL/100 g, respectively.26 Furthermore, with different cellular populations, GM and WM may respond differently to ischemia. These factors likely explain why, when we evaluated the entire visualized penumbra, there were significant differences between CBV and CBF ratios (normalized to regions with similar histologic composition) but not between CBV and CBF absolute values (affected by differing amounts of GM and WM) in the 2 penumbral regions. In fact, when we selected regions of interest in GM and WM of the 2 penumbral regions, we found that, for both regions, there were significant differences between the mean CBV and CBF values for GM versus WM. We also obtained statistically different values in region 2 versus region 3 for GM matter CBF, but not for WM CBF.
Technical factors are also important. In constructing CTP maps by using quantitative deconvolution software, it is critical to (1) avoid partial volume averaging by selecting the largest vessel perpendicular to the imaging plane for the arterial and venous regions of interest, (2) choose a region of interest pixel size to fit the lumen of the arterial and venous structures, and (3) limit truncation of the time-attenuation-curve inputs to the postprocessing software. This is important because even minor variations of certain user-defined inputs can significantly influence the quantitative CTP map values of acute stroke patients. Specifically, quantitation strongly depends on the choice of venous region of interest location, as well as pre- and postenhancement cutoff time points.27
Limitations of our study include initial and follow-up scan times, follow-up images (CT or MR), treatment (IA thrombolysis and mechanical clot retrieval), and the degree of recanalization varied. Tissue viability thresholds may be significantly lower in a homogeneous patient population with complete recanalization. Edema-enlarging infarct volume makes it difficult to determine whether stroke injury has spread into previously normal tissue or merely compressed it. It is important to bear in mind that we compared heterogeneous regions of interest rather than voxels of tissue. CTP images cover only 2 cm longitudinally, so we were unable to evaluate the entire ischemic region in any patient. Potential sources of error in the CBV and CBF map calculations include arterial input function selection, patient motion, beam-hardening artifact, and abnormal hematocrit. Poor cardiac output can also reduce the accuracy of the final maps, because of increased image noise. Finally, although the correlation of CBV and CBF lesion volumes with both tissue and clinical outcome may provide important information,7–9 we were unable to assess lesion volumes. Parenchymal coverage is limited to 2 10-mm- or 4 5-mm-thick sections on most current generation multidetector row CT (MDCT) scanners. With the advent of newer 64-section MDCT scanners and the increased use of 2-contrast bolus injections for CTP acquisition, however, limited coverage is becoming less of an issue and volumetric CTP data should soon be routinely clinically available.
Conclusion
CTP maps are useful in differentiating hypoperfused tissue that infarcts from hypoperfused tissue that recovers in acute stroke patients treated with IA procedures. The CT CBF ratio may be the best parameter for distinguishing between these 2 penumbral regions. Mean CBV ratios and CBF and CBV absolute values provide adjunctive information. Furthermore, there are significant differences between the GM and WM CBF and CBV values in these 2 penumbral regions. This information may be useful in determining how much tissue can be salvaged with reperfusion therapy versus how much tissue is likely to infarct despite intervention. An important practical implication of our results is that neuroimagers in clinical practice are likely overestimating “tissue at risk” for infarction with our current visual interpretation of CBF and MTT maps. New commercially available thresholding software may ultimately allow the rapid color coding of (1) tissue destined to infarct, (2) tissue destined to recover, and (3) tissue that may or may not recover, depending on the timing of reperfusion. CTP could have a major impact on selecting patients for recanalization procedures because CT scanners are widely available.
References
- Received March 4, 2005.
- Accepted after revision June 9, 2005.
- Copyright © American Society of Neuroradiology