Abstract
BACKGROUND AND PURPOSE: CSF loss with consecutive intracranial hypotension has been discussed as a possible pathogenetic mechanism in poor clinical outcome after uneventful neurosurgery and appears to be correlated to specific imaging findings. The purpose of this study was to describe the clinical and imaging findings of symptomatic intracranial hypotension likely induced by wound suction drainage.
MATERIALS AND METHODS: This is a review of previously published cases of patients in whom this condition developed after uneventful intracranial surgery. We performed an analysis of 3 more cases, of which 2 occurred after spinal surgery with accidental dural opening.
RESULTS: Sixteen patients who remained unconscious or did not become fully responsive after surgery showed symmetric bilateral thalamic/basal ganglia signal intensity changes on CT and MR imaging studies. Of these 16 patients, 4 died and 2 also had brain stem signal intensity changes. All patients had rapid and distinct intraoperative and postoperative CSF loss documented on CT and/or MR imaging studies by a transient increase of the sag ratio, defined as maximal anteroposterior midbrain diameter by maximal bipeduncular diameter.
CONCLUSIONS: The clinical course and typical MR imaging findings characterize the disease entity postsurgical intracranial hypotension. These findings also underline the potential danger of wound suction drainage in the case of possible CSF loss.
The clinical hallmark of spontaneous intracranial hypotension is orthostatic headache relieved by lying down.1 MR imaging signs include thickening and enhancement of the dura after contrast administration, subdural fluid collections, sagging of the brain, engorgement of venous structures with dilation of the intracranial dural sinuses and spinal epidural plexuses, and enlargement of the pituitary gland.1–6 CSF loss is suggested as a possible pathogenetic mechanism, though the exact location of CSF loss often remains undetected.7,8 According to the Monro-Kellie doctrine, in a closed compartment (as within the skull) the volume loss of 1 compartment—CSF in this disease entity—is compensated by an increase of the volume in the other ones. Because the CNS volume is likely invariable, compensation should occur through increase of the cerebral blood volume, especially of the venous blood, because veins are inherently less resistive to expansion than arteries.5
Recently, Savoiardo et al5 described 8 patients with diffuse brain swelling without subdural fluid collections. MR imaging scans of these patients showed severe brain sagging with transtentorial descent of the diencephalon and third ventricle. Some of these patients did well, whereas others were more severely affected; even fatal outcome was observed in some cases. Diffusion measurements with slightly increased apparent diffusion coefficients (ADC) and slightly increased signal intensity on T2-weighted images indicated mild vasogenic edema, which was explained by impairment of venous drainage through the internal cerebral veins and vein of Galen because of narrowing of the angle between the vein of Galen and the straight sinus.5 In 2003, we had reported on rare, but occasionally fatal, outcomes after uneventful brain surgery.6 This condition is likely related to intracranial hypotension because no additional cases have been noted after cessation of wound suction drainage following intracranial surgery. Here, we extend the spectrum with 3 more cases. Two of these cases occurred after spinal surgery with accidental dural opening and postoperative wound suction drainage. We also reviewed several previously published cases to test the above-mentioned hypothesis on the mechanism of thalamic/basal ganglia lesions.5
Materials and Methods
We reviewed previously published cases collected from several centers6 and performed an analysis of 3 more cases with sustained complications associated with rapid and distinct CSF loss after uneventful intracranial and spinal surgery with dural opening and wound suction drainage. Data from 10 male and 6 female patients with a mean age of 54 ± 15 years (age range, 34–88) years were analyzed. Imaging procedures were performed as part of the clinical work-up and included CT scans in all, MR imaging studies in 13 patients, and conventional angiography in 5 patients, respectively.
Image Analysis
The following items on CT scans, MR imaging studies, and/or digital subtraction angiography (DSA) images were analyzed by 2 neuroradiologists in consensus:
-
Dural thickening and enhancement after intravenous contrast administration on MR imaging.
-
Subdural fluid collections on CT and/or MR imaging.
-
Thalamic and basal ganglia hypodensities on CT scanning and/or hyperintensities on fluid-attenuated inversion recovery (FLAIR), proton attenuation, or T2-weighted fast spin-echo (FSE) MR images.
-
Brain stem hyperintensities and/or cerebellar hyperintensities on FLAIR, proton attenuation, or T2-weighted FSE MR images.
-
Midbrain sagging with CSF loss and downward placement of perimesencephalic cisterns on CT and MR images.
-
Engorgement of venous structures with dilation of intracranial dural sinuses and/or spinal epidural plexuses on sagittal or coronal MR images.
-
Enlargement of the pituitary gland on sagittal MR images.
The angle between the vein of Galen and the straight sinus was measured when sagittal MR, reformatted CTA, or lateral DSA images were available. A sag ratio was calculated on axial CT images by dividing the maximal anteroposterior diameter of the midbrain by the maximal bipeduncular diameter as described by Komotar et al.3
Clinical outcome at 3 months was determined by use of the Glasgow outcome score9 and modified Rankin scale.10
Statistics
Pearson nonparametric correlation coefficients for the following parameters were determined: modified Rankin scale, Glasgow outcome score, sag ratio and thalamic/basal ganglia hyperintensities and/or hypodensities. Significance was stated at the .05 level (2-tailed). We performed all statistical analysis using commercially available software (SPSS 17.0; SPSS, Chicago, Illinois).
Results
Patient characteristics, imaging procedures, and clinical outcome in 16 patients with intracranial hypotension are summarized in Table 1. Full recovery was observed in 5 (31%) of 16 patients, whereas 4 (25%) of 16 patients died. CT examinations 1 day after surgery were available in all patients who were included in the analysis. Additional MR imaging examinations were available in most cases (12/16; 75%), whereas DSA was only performed in a third of the study population (5/16; 31%).
Imaging modalities and clinical outcome in 16 patients with intracranial hypotension
The sag ratios before surgery (40 examinations), 1 day after surgery (16 examinations), and during immediate (18 examinations) and long-term follow-up (24 examinations) of the patients revealed a significant increase associated with the clinical observation of intracranial hypotension that resolved during clinical recovery and returned to preoperative values in follow-up studies that were obtained more than 7 days after surgery (Fig 1). Patients with initially higher sag ratios showed a strong tendency to have a worse clinical outcome; however, this finding was not statistically significant (Table 2).

Sag ratios defined as maximal anteroposterior midbrain/maximal bipeduncular diameter3 preoperatively (n = 12), on the day after surgery (n = 16), in the first week after surgery (n = 13), and on long-term follow-up examinations (n = 7). Note the temporary significant increase of the sag ratio and complete resolution at long-term follow-up. Error marks indicate SDs of measurements (n = number of patients).
Imaging findings in 16 patients with intracranial hypotension
Imaging findings (Table 3) included typical changes suggestive of CSF loss as well as hyperintensities in the thalamus/basal ganglia, brain stem, and cerebellum (Fig 2). Because of the inconsistent use of CT, DSA, and/or MR imaging and varying MR imaging protocols depending on clinical requirements, many items in Table 2 could not be safely determined. However, subdural fluid collections, which are considered a hallmark of intracranial hypotension, were found in 5 (31%) of 16 patients only and did not correlate with clinical outcome parameters (Table 3). All patients showed thalamic/basal ganglia hypodensities on CT scans and/or hyperintensities on FLAIR images resembling the drainage territory of the internal cerebral veins (Fig 3). Patients with severe thalamic/basal ganglia signal intensity changes had a significantly worse clinical outcome (Table 3). Thrombotic occlusion of the internal cerebral veins, the vein of Galen, or straight sinus was not found in any of the patients. The angle between the vein of Galen and the straight sinus showed a large intraindividual variability (Table 2) and did not correlate with the clinical outcome (Table 3).
Correlation of imaging findings with clinical outcome parameters in 16 patients with intracranial hypotension

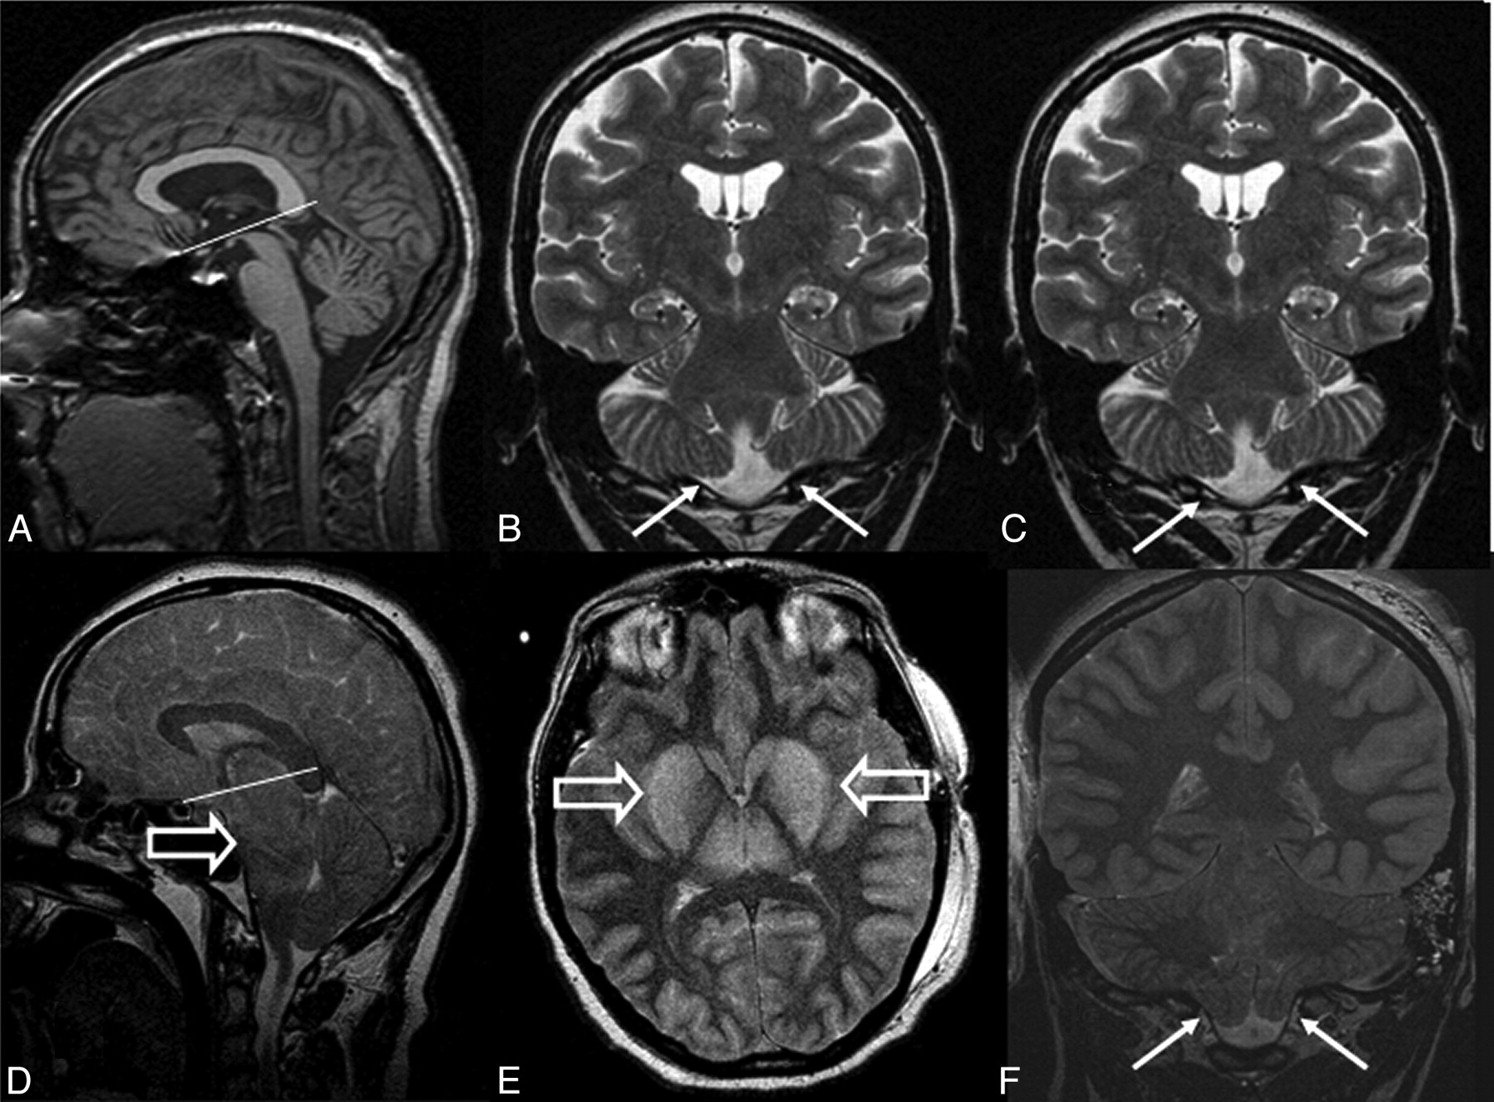
Sagittal T1-weighted spin-echo (A) and coronal T2-weighted FSE images (B,C) after depth electrode placement for presurgical work-up. Sagittal (D), axial (E), and coronal (F) T2-weighted FSE images 5 days after left-sided hippocampectomy. Vasogenic edema with increased signal intensity on T2-weighted images and elevated ADC values on diffusion-weighted MR imaging (not shown) is present in the basal ganglia (E; open arrows) and, to a lesser extent, in the brain stem (D; open arrow). CSF loss causes noisy T2-weighted images (D-F) and sagging of the brain stem and cerebellum (D,F). Normally, the iter in the aqueduct is within 2 mm below the incisural line connecting the tuberculum sellae and the entrance of the vein of Galen into the straight sinus (A). With severe CSF loss, the iter and the splenium corporis callosi are displaced downwards (D). Note tonsillar displacement into the foramen magnum (arrows in F compared with B and C).

Axial FLAIR before right-sided temporal lobe lesionectomy (A,B), 1 day after the lesionectomy (C,D), and 5 years later (E,F). Note that sections in A, B, E, F are angulated along the temporal lobe length axis, whereas sections in C and D are angulated along the c.a.-c.p.-line. However, apart from the resection defect (C; thick arrow), moderate thalamic and basal ganglia hyperintensities (D; open arrow) and compressed ambient cisterns (C; arrows) are clearly visible. From a clinical standpoint, this 36-year-old woman had a complete recovery with resolution of the imaging findings (E,F).
Cerebellar hyperintensities on FLAIR images occurred in 5 of 6 intracranial cases and both spinal cases, and brain stem hyperintensities occurred in 3 of 6 intracranial cases and also both spinal cases (Fig 4). All patients with brain stem hyperintensities also showed cerebellar hyperintensities. Cerebellar hyperintensities correlated significantly with the clinical outcome as defined by the modified Rankin scale and showed a strong tendency for correlation with the Glasgow outcome score. Patients with intracranial surgery who showed cerebellar or brain stem hyperintensities also had severe hyperintensities of the thalamus/basal ganglia, and 2 (40%) of 5 patients showed a fatal outcome within 3 days after surgery (Tables 1 and 2).

Intracranial hypotension after spinal fixation with dural opening. Axial CT images show compressed ambient cisterns (A; arrows) and basal ganglia hypoattenuation (B; open arrow). On midline sagittal reformatted CT angiogram (C), only sparse CSF space is visible in the posterior fossa. Axial ADC map (D) and coronal FLAIR images show mainly cytotoxic edema of the gray matter. Increased signal intensity is also visible in the cerebellum (E,F) and, to a lesser extent, in the pons (F). From a clinical standpoint, this 60-year-old woman who underwent spinal surgery for lumbar spondylodiskitis has recovered fully from symptoms of intracranial hypotension.
Discussion
Intracranial hypotension after intracranial and spinal surgery with dural opening is potentially life threatening if patients are left with a subfascial suction drainage and, thus, with continuous CSF loss under relatively high negative pressure. The distribution of MR imaging signal intensity changes in the thalamus/basal ganglia had been the result of impaired drainage through the internal cerebral veins and the vein of Galen into the straight sinus.5 However, none of our patients showed occlusions of the internal cerebral vein, vein of Galen, or straight sinus, and the measurement of the angle between the vein of Galen and the straight sinus revealed too large intraindividual variability to test this hypothesis. Diffusion-weighted images and ADC measurements in 6 patients were consistent with mixed cytotoxic and vasogenic edema, which is also present in venous stroke because of internal cerebral vein thrombosis.11
In this series, patients who did not awaken after uneventful intracranial or spinal surgery were initially studied with CT scans to rule out intracranial hemorrhage or other space- occupying lesions that could otherwise have explained the unexpected clinical course. Symmetric thalamic/basal ganglia hypodensities resembling the drainage territory of the internal cerebral veins resulted in the use of additional imaging modalities (either DSA or MR imaging). Before we realized intracranial hypotension as a pathogenetic mechanism, we rarely acquired sagittal MR images but, rather, focused on ischemic-hypoxic changes primarily ruling out perfusion abnormalities. After the use of wound suction drainage had been terminated, only 1 case with major CSF loss (see below) occurred after intracranial surgery, providing further evidence to the claim in our first publication.6 After prolonged postoperative unconsciousness following spinal surgery occurred in 2 patients, imaging studies demonstrated identical imaging abnormalities with an accidental and undetected dural opening in these patients. Another patient had this condition after evacuation of a subdural hematoma with use of hollow screws; he lost 450 mL of CSF in the immediate postoperative period and recovered with the Trendelenburg position (−15 to 30°).
Herniation secondary to postsurgical CSF hypovolemia has been described in 11 (8%) of 137 patients with aneurysmal subarachnoid hemorrhage who experienced signs of transtentorial herniation, most commonly between 2 and 4 days after clipping and intraoperative spinal drainage.3 The Trendelenburg position reversed the symptoms in all patients. Thalamus/basal ganglia hypodensities on CT scan have neither been described in these patients nor in various case reports,12–17 whereas global cerebral edema on admission CT scan and a longer operative time were identified as risk factors for the development of symptomatic CSF hypovolemia.3–4
A combination of thalamic/basal ganglia, cerebellar, and brain stem lesions in patients who had intracranial hypotension after intracranial surgery correlated with a worse clinical outcome. Brain stem and thalamic/basal ganglia lesions in patients undergoing spinal surgery were more severe in the patient with a fatal outcome compared with the patient who fully recovered from symptoms. In 2 patients with a fatal outcome or a vegetative state, postsurgical MR imaging was not available to identify possible cerebellar or brain stem hyperintensities. However, the combination of thalamic/basal ganglia, cerebellar, and brain stem lesions may be a prognostic factor for the clinical outcome. The sag ratio, on the other hand, was significantly increased in patients with intracranial hypotension compared with the same patients before surgery (Fig 1) but revealed no significant correlation with the clinical outcome. This finding suggests that this parameter is, rather, of a diagnostic value than a prognostic factor. Subdural fluid collections, which are considered a consistent finding in spontaneous intracranial hypotension, were only found in a minority of the cases, indicating a limited value of this parameter in the diagnosis of postsurgical intracranial hypotension.
Both from an imaging and a clinical point of view, internal cerebral vein thrombosis, diffuse hypoxia, and hypoglycemia are the most important differential diagnoses. Before recognizing the association of intracranial hypotension with signal intensity changes in the basal ganglia, we used the term pseudohypoxic brain swelling because extensive laboratory investigations and careful anesthetic monitoring had remained uneventful.6 Severe hypoglycemia and diffuse hypoxia were considered unlikely to be concurrently causative because cortical structures were not involved and signal intensity changes were very prominent. Moreover, in severe hypoglycemia and diffuse hypoxia, there are typically only subtle intracranial volume changes. Significant intracranial volume changes and, sometimes, subtentorial cerebellar hemorrhage as a well-known phenomenon of intraoperative CSF loss may guide clinicians to the correct diagnosis.
Conclusions
In conclusion, neurosurgeons and neuroradiologists should be aware of symmetric thalamic/basal ganglia lesions associated with other imaging signs of CSF loss likely induced by postsurgical wound suction drainage. A differentiation between the mechanism of development of this lesion (formerly termed pseudohypoxic brain swelling) and true hypoxia must be carefully made.
Acknowledgment
The authors thank D. Van Roost for providing clinical information.
References
- 1.
- 2.
- 3.
- 4.
- 5.
- 6.
- 7.
- 8.
- 9.
- 10.
- 11.
- 12.
- 13.
- 14.
- 15.
- 16.
- 17.
- Received March 30, 2009.
- Accepted after revision May 25, 2009.
- Copyright © American Society of Neuroradiology