Abstract
BACKGROUND AND PURPOSE: Individuals with autism spectrum disorders often exhibit atypical language patterns, including delay of speech onset, literal speech interpretation, and poor recognition of social and emotional cues in speech. We acquired functional MR images during an auditory language task to evaluate systematic differences in language-network activation between control and high-functioning autistic populations.
MATERIALS AND METHODS: Forty-one right-handed male subjects (26 high-functioning autistic subjects, 15 controls) were studied by using an auditory phrase-recognition task, and areas of differential activation between groups were identified. Hand preference, verbal intelligence quotient (IQ), age, and language-function testing were included as covariables in the analysis.
RESULTS: Control and autistic subjects showed similar language-activation networks, with 2 notable differences. Control subjects showed significantly increased activation in the left posterior insula compared with autistic subjects (P < .05, false discovery rate), and autistic subjects showed increased bilaterality of receptive language compared with control subjects. Higher receptive-language scores on standardized testing were associated with greater activation of the posterior aspect of the left Wernicke area. A higher verbal IQ was associated with greater activation of the bilateral Broca area and involvement of the prefrontal cortex and lateral premotor cortex.
CONCLUSIONS: Control subjects showed greater activation of the posterior insula during receptive language, which may correlate with impaired emotive processing of language in autism. Subjects with autism showed greater bilateral activation of receptive-language areas, which was out of proportion to the differences in hand preference in autism and control populations.
Language disturbances are among the most pronounced and clinically significant features and strongest predictors of outcome in autism.1,2 Auditory and language disturbances in autism include delayed onset of speech,3 widely varying impairments in comprehension and spoken language, stereotypical or idiosyncratic speech patterns,4 and hypersensitivity to distracting or unexpected auditory stimuli.5 Though much less studied, language impairment in autism may also involve reading ability.6 Qualitatively similar though milder delays in speech, spoken language, and reading are also found in family members of children with autism.7 The neural basis of language-related impairments in autism is critical to understanding brain mechanisms driving the clinical impairments, developing interventions to improve the function and prognosis of affected individuals, and identifying genes and other risk factors involved.
There is converging evidence from multiple modalities that language in autistic subjects shows atypical hemispheric lateralization in the brain. It has long been established that the metrics of hand preference show decreased right-hand dominance in the autistic populations.8-10 Dichotic listening tasks show reduced right-ear advantage for speech processing in autism.11 Single-photon emission tomography and positron-emission tomography imaging show decreased relative cerebral blood flow lateralization in the language-related cortex for subjects with autism.12,13 An electroencephalography examination found reduced left lateralization of temporal lobe μ rhythms in an autistic population.14 Anomalous age-related changes in lateralization of language areas during later childhood were found for autistic subjects in a magnetoencephalography study.15 Although abnormal volumetric asymmetry of frontal but not superior temporal language areas has been consistently found in autism,16-18 functional asymmetry of the superior temporal gyrus has been observed repeatedly.15,19-26
Lateralization of language has been examined directly by using functional MR imaging (fMRI). In an expressive language letter fluency task, 14 high-functioning adolescent and adult males with autism spectrum disorders (ASD) were found to have less left-lateralized activation in frontal language areas than 14 controls.22 A separate study by using a semantically based response naming task demonstrated a larger difference in percentage signal-intensity change between the Broca area and its right homolog in 12 controls compared with 12 high-functioning males with ASD.27
We investigated receptive-language processing by using an auditory language task, with a paradigm that examined phrase and sentence levels of language processing to determine whether differences in activation outside core receptive and expressive language regions were seen between autism and typically developing groups.
Materials and Methods
Subject Characteristics
Twenty-six high-functioning males with autism were compared with 15 male healthy volunteer subjects, group-matched by age. Table 1 compares group demographics of age, handedness, receptive-language function, verbal intelligence quotient (IQ), and performance IQ of the autism and control populations. There was a slight trend toward decreased right-handedness in the autism group, which was not statistically significant in our sample. One autism participant was left-handed, and 2 controls were ambidextrous. The participants had no history of hearing problems, and all had English as their first language. All controls had normal language function. As expected, language function was impaired in the autism participants as a group. Verbal and performance IQ scores showed small but significant decreases in the autism group. Experimental procedures were approved by the University of Utah institutional review board. Informed consent was obtained for all subjects.
Characterization of control and autism populations
Diagnosis and Exclusion Criteria
Diagnosis of autism was established by the Autism Diagnostic Interview-Revised,28 the Autism Diagnostic Observation Schedule-Generic (ADOS-G),29 the Diagnostic and Statistical Manual of Mental Disorders DSM-IV,3 and the World Health Organization International Classification of Diseases–10 criteria, under the direction of a board-certified child psychiatrist. Participants were excluded if medical causes of autism were identified by participant history, fragile-X gene testing, karyotype, and observation.
Control participants underwent tests of IQ and language function and standardized psychiatric assessments30 and were assessed with the ADOS-G29 to confirm typical development. Controls with any history of developmental, learning, cognitive, neurologic, or neuropsychiatric conditions were excluded.
Assessments
Handedness.
The Edinburgh Handedness Inventory,31 a standardized assessment of hand preference, was performed for each subject. This inventory consists of a numeric score between −100 and 100, in which −100 represents strong left-handedness and 100 represents strong right-handedness.
IQ.
Verbal IQ (vIQ) and performance IQ (pIQ) were measured with the Wechsler Adult Intelligence Scale (WAIS III) or the Wechsler Abbreviated Scale of Intelligence (WASI).
Language.
The Clinical Evaluation of Language Fundamentals, 3rd ed (CELF-3),32 was used to assess language skills. It is a comprehensive and nationally normalized clinical assessment tool that provides a quantitative measure of language level. The CELF-3 includes subtests that measure grammar, syntax, semantics, and working memory for language and provides an overall assessment of higher order receptive and expressive language and a total language level. We used the “Receptive” subtest score as a covariable in our analysis because our fMRI task was primarily designed to measure receptive-language function.
fMRI Acquisition
Images were acquired on a Magnetom Trio (Siemens, Erlangen, Germany) scanner. All fMRI subjects were fitted with MR imaging–compatible lenses to allow comfortable reading of the 8-point text within the scanner. Subject alertness was monitored throughout the examination by real-time eye tracking by using an infrared camera mounted on a 12-channel head coil (Siemens).
The scanning protocol consisted of an initial 1-mm isotropic magnetization-prepared rapid acquisition of gradient echo (MPRAGE) acquisition for an anatomic template. Blood oxygen level–dependent (BOLD) echo-planar images (TR = 2.0 seconds, TE = 28 ms, generalized autocalibrating partially parallel acquisition with acceleration factor = 2, 40 sections at 3-mm section thickness) were obtained during the auditory language task described below. Prospective motion correction was performed during BOLD imaging with a prospective acquisition-correction technique sequence.
We chose phrase- and sentence-level tasks rather than single-word tasks because the former are known to produce less variable and more sensitive activation maps compared with lexical-level tasks.33,34 The auditory language task consisted of a block-design alternating 20 seconds of auditory stimuli with 20 seconds of no stimuli. Auditory stimuli were delivered to sound-blocking pneumatic headphones (Silent Scan SS-3100; Avotec, Stuart, Florida) and consisted of phrases that described a common word. Examples of phrases include, “Jewelry we wear around our neck,” “The funny guys at the circus,” and “Water falling from the sky.” Subjects were instructed to think of a word that each phrase describes. Six phrases were presented during each block, with a 1-second pause between phrases for subjects to think of an appropriate word. During epochs with no stimuli, subjects were instructed to rest but keep their eyes open. A single run of the task, of 4-minute duration, was performed in all subjects.
The visual language task consisted of a similar 20-second block design. Visual stimuli were displayed via an LCD projector onto a screen in the bore of the scanner and were viewed by a mirror mounted on the top of the 12-channel head coil. Stimuli consisted of sentences with a blank at the end. Subjects were instructed to think of an appropriate word to complete the sentence. Sample sentences include, “She put the dishes in the _____,” and “He took a shortcut to go ____.” Eight sentences were presented per 20-second block. During epochs without sentences, subjects were instructed to fixate on a high-contrast mark in the center of the screen. A single run of the task, of 4-minute duration, was performed in 14 autism and 9 control subjects.
fMRI Postprocessing and Statistical Analysis
Off-line postprocessing was performed in Matlab (MathWorks, Natick, Massachusetts) by using SPM8b software (Wellcome Department of Imaging Neuroscience, London, UK). A field map sequence was acquired for each subject for distortion correction, and all images were motion-corrected by using a realign and unwarp procedure. No difference in head motion was seen between autism and control groups during retrospective motion correction. Using maximal detected motion in x-, y-, and z-directions by a retrospective motion-correction algorithm, we computed the square root (x2 + y2 +z2) for each subject as an index of head motion. For the autism group, this index measured 0.8 ± 0.32 mm (range, 0.32–1.3 mm). For the control group, maximal head motion measured 0.71 ± 0.31 mm (range, 0.24–1.2 mm). Findings were not significantly different by using a 2-tailed t test (P =.35). BOLD images were coregistered to MPRAGE anatomic image sequences for each subject. All images were normalized to Montreal Neurological Institute (MNI) template brain (T1.nii in SPM8b), and smoothing with an 8-mm kernel was performed on all images.
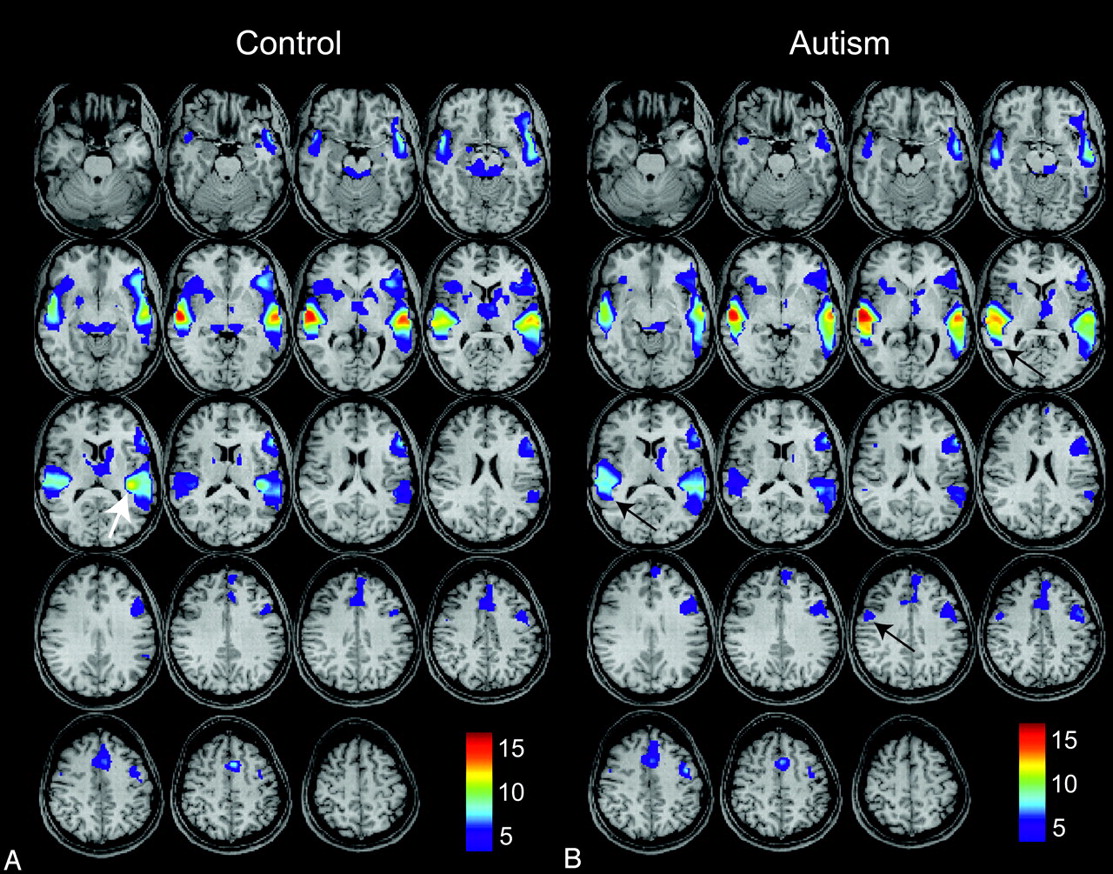
Activation maps were generated for each subject by using a general linear model to obtain t-contrast images. No minimal cluster size was specified in any of the analyses. Second-level random-effects analysis was then performed for autism and control subjects on t-contrast images for each subject. Age, handedness, receptive-language ability (CELF-3), and vIQ were included as covariables in the second-level analysis. Activation maps were obtained separately for the control group and for the autism group, with each thresholded at an acceptable false discovery rate (FDR) of P < .05 (Fig 1).

Group-level activation maps for an auditory phrase-recognition task for 15 control subjects (A) and for 26 high-functioning autistic subjects (B). Results for each group represent P < .05, false discovery rate (FDR), and color bars represent values for t-scores. Arrows show left posterior insular, right lateral premotor, and right Wernicke homolog areas where differences in activity are observed.
The visual sentence-completion task was analyzed by using a similar procedure, and auditory > visual contrast across all subjects was thresholded at an acceptable FDR, P < .05, to identify brain regions active preferentially during the auditory task, which is shown for typically developing controls in Fig 2(blue). This auditory > visual contrast yielded activation maps of bilateral superior temporal gyri in expected locations of the primary auditory cortex. To identify receptive-language clusters in each subject, this auditory > visual contrast was used as a mask to exclude voxels in the primary auditory cortex from the analysis. Maximal clusters were selected bilaterally from activated voxels posterior to the primary auditory cortex in the superior temporal, middle temporal, and supramarginal and angular gyri regions by using P < .05, FDR, as the threshold for each subject. The number of activated voxels in the left and right receptive-language clusters was used to calculate the fMRI laterality index by using the formula (left − right)/(left + right) to obtain a measurement between −1 (strongly right dominant) and 1 (strongly left dominant).

Group-level activation maps for 15 control subjects for auditory > visual tasks (blue) and auditory tasks (red) after masking the auditory > visual tasks. Both results show P < .05, FDR.
Results
Magnitude of Activation during the Auditory Task
Activation maps for control and autism populations during the auditory language task are shown in Fig 1. All subjects showed activated clusters in expected language regions (Wernicke area, Broca area, lateral premotor cortex, supplementary motor area, left dorsolateral prefrontal cortex) when thresholded at an acceptable FDR, P < .05. Population activation maps showed remarkable similarity in the spatial distribution of activation, with similar t-scores and spatial coordinates of local maxima in the core language regions (Table 2). A few notable differences were seen. There was a focus of activation in the left posterior insula much greater than that in the control map (Fig 1, white arrow), and activation in the right Wernicke homolog extended farther posteriorly in the autism map than in the control map (Fig 1, black arrows). A trend toward increased activation in the right lateral premotor cortex in the autism map (Fig 1, black arrow) was not statistically significant in our sample. We detected no significant difference in the magnitude of auditory stimulus responses in the primary auditory cortical regions between groups. Cerebellar activation was also noted for most subjects, but the infratentorial brain was not consistently included in the FOV for all subjects and does not appear on activation maps.
Activation of core auditory language regions
Differences in Auditory and Visual Task Activation
The visual task showed a similar spatial distribution of language activation, with additional posterior parietal, lateral temporo-occipital, and visual cortical areas. The difference between auditory and visual task activation, thresholded at an FDR of P < .05, is shown in blue in Fig 2, rendered on the MNI template brain image, with the remaining auditory task activation from all subjects shown in red. The auditory task showed significant increases in activation over the visual task in the bilateral superior temporal gyrus, corresponding to that in the primary auditory cortex, with an additional activation of the left greater than the right posterior insula. No significant posterior insular activation was seen during the visual task.
Differences between Populations in Auditory Task Activation
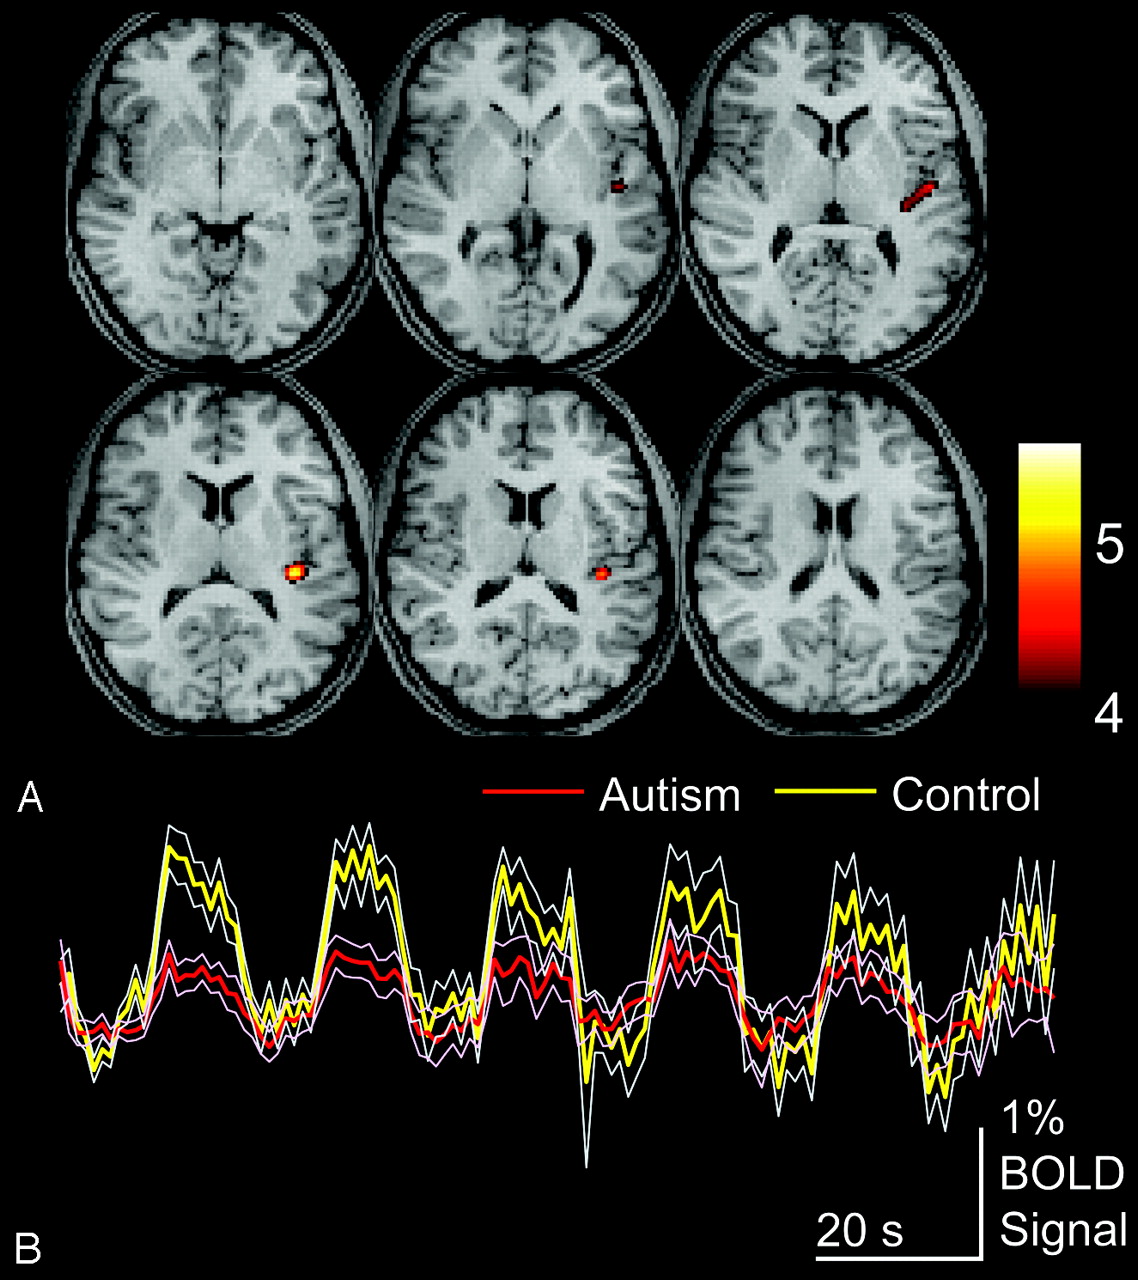
To compare autism and control populations, we performed a second-level, 2-sample t test design, and control > autism and autism > control contrasts were evaluated. Fig 3illustrates control > autism contrast, shown for an acceptable FDR of P < .05. Activity was seen for this contrast only in the left posterior insula, with peak activity at MNI coordinates x = −39, y = −28, z = 16, and a t-score of 5.7, corresponding to the FDR-corrected P value of .0087. No other areas of significantly differential activation were seen.

Areas of greater activation for control than autism subjects for auditory language tasks. A, Control > autism activation for P < .05, FDR. Color bar shows t-scores. B, Blood oxygen level–dependent time series data for clusters are shown above for the entire auditory language task in autism and control populations, averaged across subjects for each group. Thin traces show standard error of the mean across subjects for each group.
Autism > control contrast demonstrated a cluster in the right posterior middle temporal gyrus, along the posterior inferior aspect of the Wernicke homolog at MNI coordinates x = 48, y = −55, z = 4, with a t-score = 4.1. To further evaluate this region, we performed a small volume correction by limiting evaluation to the right Wernicke homolog, given our a priori hypothesis that autistic subjects would show increased right-hemispheric activation of language regions. We limited evaluation by searching within a 2-cm diameter sphere that enclosed all significantly activated voxels in the right Wernicke homolog region on the group-activation map obtained from all subjects. With this correction, this cluster was significant at P = .004, FDR. No other foci of significantly different activation were seen for autism > control contrast.
Laterality Indices in Control and Autism Populations
To test for significant differences in language lateralization between autism and control samples, we identified receptive-language clusters in the left and right hemisphere for each subject. Receptive-language regions were selected because our task was designed primarily for receptive-language activation.
Left and right hemispheric clusters in the Wernicke region and homolog were identified for each subject after masking out the primary auditory cortex by using auditory > visual contrast. Laterality indices are shown in Fig 4, with population statistics listed in Table 1. There was significantly greater relative activation of right-sided language regions in the autism group, which was out of proportion to slight differences in hand preference as measured by the Edinburgh Handedness Inventory, indicating that language lateralization is not merely a consequence of known population biases toward decreased right-handedness in autism. Moreover, these differences in laterality were observed in data for which variance associated with hand preference were already included as a regressor in the group-level analysis.

Hand preference and language laterality for autism and control subjects. Histograms show the number of subjects exhibiting scores between −100 and 100 (Edinburgh Handedness Inventory) or between −1 and 1 (functional MR imaging [fMRI] laterality index), in which 100 represents strong right-handedness and 1 represents strong left-hemispheric language dominance.
Effect of Age, vIQ, and Standardized Language Scores on Activation
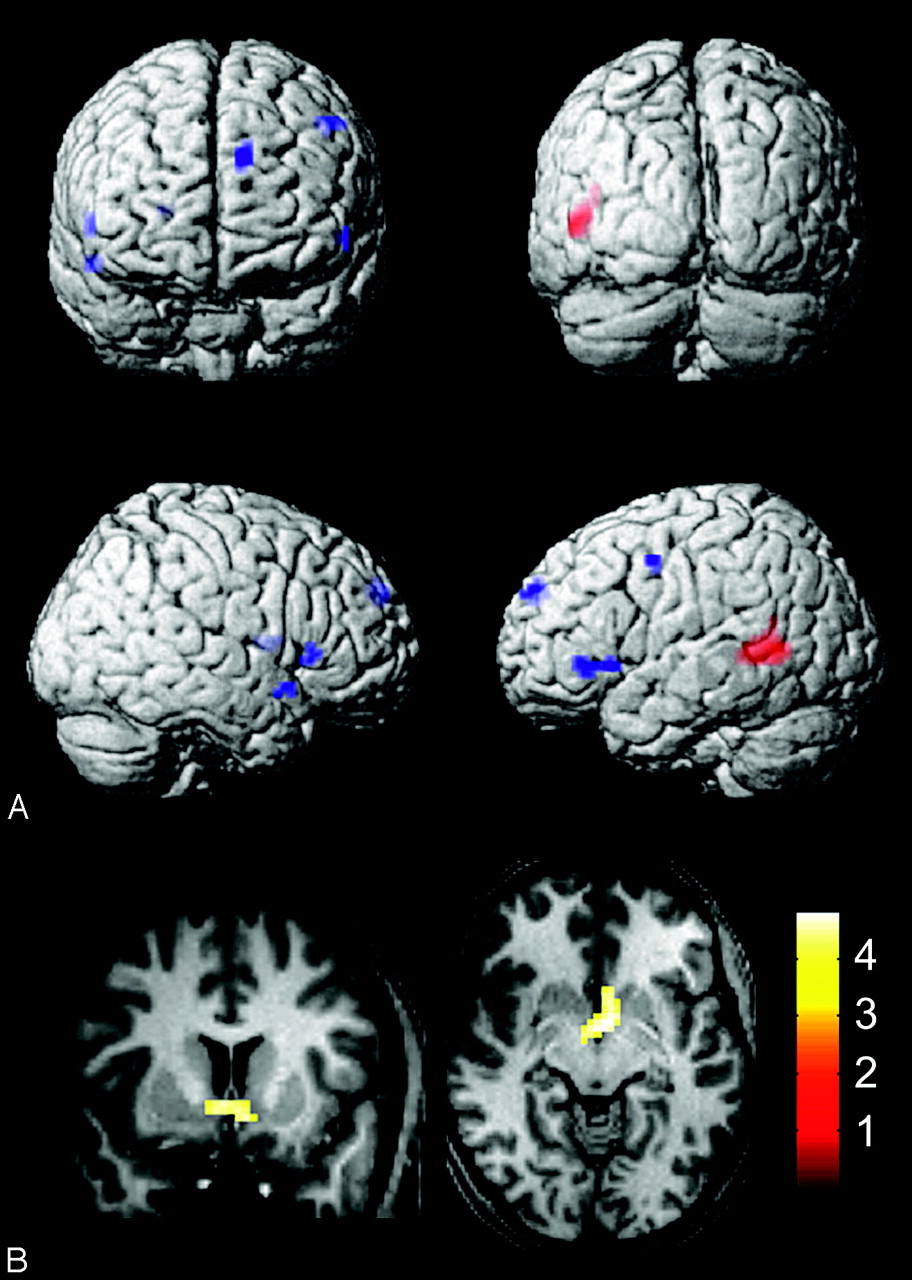
Four covariables were included in the regression when evaluating group-level activation: age, handedness, vIQ, and CELF-3 receptive-language function score. No significant foci of differential activation were associated with handedness. Increased proficiency on receptive-language testing (CELF-3) was associated with increased activation in the posterior left Wernicke area (Fig 5A, red), significant at P < .05, FDR. Increased vIQ scores were associated with a trend toward activation in the bilateral posterior inferior frontal gyrus (left Broca area and right hemispheric homolog), right putamen, left dorsomedial prefrontal cortex, left lateral premotor cortex, and right anterior temporal pole (Fig 5A, blue). These clusters were all significant at P < .001, uncorrected, but did not survive FDR correction at P = .05. MNI coordinates of activation associated with CELF-3 and vIQ tests are listed in Table 3. With younger age, activation was seen in the region of the bilateral nucleus accumbens, with peak activity at x = −3, y = −1, z = −5, t-score = 4.8, corresponding to an acceptable FDR P value of .031. This cluster is shown in Fig 5B. No significant differential activation was associated with older age, lower vIQ score, or lower CELF-3 score.

Associations between auditory language activation and covariables for all subjects. A, Activity associated with higher receptive-language (Clinical Evaluation of Language Fundamentals, 3rd ed) scores (red, P < .05, FDR) and higher verbal intelligence quotients (blue, P < .001, uncorrected). B, Activity associated with younger age (P < .05, FDR).
MNI coordinates of increased activation associated with standardized test scores
Discussion
Decreased Posterior Insular Activity during Language in Autism
We found a significant decrease in activation in the posterior insula during auditory language processing in autism compared with typically developing participants. This area showed striking activation during the language task for controls, with a t-score second only to that in the primary auditory cortex, greater than scores for either the Wernicke area or Broca area on the left. The posterior insula was activated only during our auditory and not our visual language task; this finding suggests an auditory processing function to this region. This idea is supported by a recent study in which electrophysiologic recordings in rhesus monkeys (which also show a close proximity of the posterior insula to the Heschl gyrus) demonstrated selective responses in posterior insular neurons to sounds associated with vocal communication.35
A longitudinal study in children 5–11 years of age (younger than participants in our study) showed decreased left posterior insular activity with age in virtually identical coordinates to the focus we detected,36 a finding that may suggest an even more important role for this region in language development. The posterior insula has also been implicated in other features relevant to the autism phenotype, including emotive processing of stimuli such as experiencing pain,37 processing negative emotions such as disgust,38 and emotional responses to aversive facial stimuli.39
Language Hemispheric Lateralization in Autism
We found similar activation magnitude in the Broca area and in its right homolog in the autism and control groups. All autism studies measuring lateralization during language tasks by using the fMRI BOLD response or blood-flow velocity have found left lateralization in the activation of the Broca area compared with its right homolog in autism, though the degree of lateralization and activation in autism relative to controls has differed across studies.22,27,40,41
In contrast to frontal language regions, the pattern of activation in the Wernicke area and its right homolog differed in our autism and typically developing control samples. Although the amount of activation in the Wernicke area in the left hemisphere was similar in autism and control participants, activation in the right homolog was more extensive in autism, as measured both by population-level activity in the right homolog, though this difference was small, and by population statistics on the laterality index that showed a greater right-sided spatial extent of activation. This difference in language laterality does not merely reflect the known differences in hand preference in our sample, because a quantitative metric of hand preference showed a slight, nonsignificant trend toward decreased right-handedness, whereas the language laterality observed with the fMRI laterality index was significant and much more pronounced.
Differential Activation Associated with Age and Standardized Testing
We noted several associations with standardized testing and our fMRI results. First, participants with higher scores for receptive-language proficiency, as measured by CELF-3, showed increased spatial extent of the left Wernicke area, with recruitment of more of the posterior middle temporal gyrus. This seems plausible given the known dominant receptive-language function of the left Wernicke area. Second, participants with higher verbal IQ scores demonstrated greater recruitment of frontal language areas, including the left Broca area and its right-sided homolog, as well as the dorsomedial prefrontal cortex and lateral premotor cortex. This finding is consistent with a more complex frontal language network in participants with higher IQs.
Finally, we saw activation of the bilateral nucleus accumbens in younger participants. This area has been associated with neural processing of rewards,42 including novel stimuli and natural reinforcement.43 It is possible that younger subjects experience a greater sense of intrinsic approval when “solving” the auditory-phrase task compared with older subjects.
Study Limitations
We included a higher total number of autism participants in the study to better account for the known clinical heterogeneity of autism but acknowledge that the observed findings may not be uniformly generalized to represent differing clinical autism phenotypes. We also elected not to have the subjects speak during the task to prevent head motion, which limited our ability to compare subject performance on the task between the groups. We observed very similar activation patterns, however, in most activated regions, suggesting that language network activation was similarly achieved in the 2 populations. Finally, the language stimuli used were short phrases that lack the context of normal conversation and may not generalize to conversational language.
Conclusions
High-functioning autistic subjects showed significantly decreased involvement of the left posterior insula during auditory language processing, a finding that may correlate with impaired perception of emotive content in language. We also found increased activation in the right hemispheric Wernicke homolog, consistent with prior reports of atypical functional lateralization in expressive language regions. These findings suggest targets for ongoing investigations of the neurophysiologic mechanism of language abnormalities in autism.
Acknowledgments
We thank Jim Lee, PhD, Melody Johnson, and Henry Buswell, of the University of Utah Center for Advanced Imaging Research, for technical assistance in data acquisition and paradigm design. We also thank Barbara Young and Celeste Knowles of the Utah Autism Neuroscience Program and express our sincere gratitude to the young people and their families who participated in the study.
Footnotes
-
This work was supported by grant RO1 MH080826 (J.E.L., A.L.A., N.L., E.D.B.) from the National Institutes of Health (NIH), an Autism Speaks Predoctoral Fellowship Grant (M.B.D.), and a University of Utah Multidisciplinary Research seed grant (J.S.A., J.E.L.). Additional support came from National Institute of Neurological Disorders and Stroke (NINDS) R01 NS34783 (NL), National Institute of Mental Health (NIMH) P50 MH60450 (NL), and Ben B. and Iris M. Margolis Foundation (J.S.A.). The content is solely the responsibility of the authors and does not necessarily represent the official views of the NIMH, NINDS, or the NIH.
-
Paper previously presented in part at: Annual International Meeting for Autism Research, May 7–9, 2009; Chicago, Illinois.
Indicates open access to non-subscribers at www.ajnr.org
References
- 1.
- 2.
- 3.
- 4.
- 5.
- 6.
- 7.
- 8.
- 9.
- 10.
- 11.
- 12.
- 13.
- 14.
- 15.
- 16.
- 17.
- 18.
- 19.
- 20.
- 21.
- 22.
- 23.
- 24.
- 25.
- 26.
- 27.
- 28.
- 29.
- 30.
- 31.
- 32.
- 33.
- 34.
- 35.
- 36.
- 37.
- 38.
- 39.
- 40.
- 41.
- 42.
- 43.
- Received May 28, 2009.
- Accepted after revision June 15, 2009.
- Copyright © American Society of Neuroradiology