Abstract
BACKGROUND AND PURPOSE: Previous data have shown the feasibility of identifying ischemic penumbra in patients with acute stroke by using a semiautomated analysis of ADC maps. Here, we investigated whether the fate of ADC-defined penumbra was altered by HG. We also examined the interaction between HG and arterial recanalization on infarct growth.
MATERIALS AND METHODS: We examined 94 patients by using MR imaging within 6 hours of stroke onset and a follow-up MR imaging within 7 days. The ADC-defined tissue-at-risk was calculated from the early MR imaging. Patients were classified according to high (>7 mmol/L; n = 34/94, HG) or normal (n = 60/94) baseline SGL. The impact of HG status on infarct growth was assessed by using multiple regression models and analysis of the slopes of regression lines for each group. Interaction between HG status and arterial recanalization on infarct growth was investigated by using multiple regression analysis.
RESULTS: The slope of the predicted versus observed infarct growth regression line was steeper in HG than non-HG patients (P = .0008), suggesting that infarct growth within ADC-defined tissue-at-risk was increased in HG patients. The effect was 2.8 times more severe in nonrecanalized patients (P = .01) than in patients with recanalization (P = .001).
CONCLUSIONS: ADC-defined tissue-at-risk may represent ischemic penumbra because part of this area may be salvaged in normal SGL patients. The toxicity in HG patients seems to be more related to penumbra-infarction transition than reperfusion injury in humans because the effect was larger in nonrecanalized than in recanalized patients.
HG in acute stroke has been associated with poor outcome in many clinical studies,1–4 but correlation does not mean causality. Possible causality is supported by experimental studies that have shown that HG worsened the conversion of penumbra into infarction5–7 and exacerbated reperfusion injury.5 In addition, 1 transcranial Doppler study suggested that HG may facilitate reperfusion injury in humans,8 and carefully designed perfusion-diffusion studies9–11 have reported that HG worsened the conversion of penumbra into infarction in a small series of patients.
Penumbra in acute stroke is usually investigated by using by the diffusion-perfusion mismatch, which requires a contrast agent injection.12–15 We have developed a new neuroradiologic method for imaging the ischemic penumbra in acute stroke patients, based on DWI without the injection of intravenous contrast material.16–18 The penumbra is defined on the initial ADC map by an algorithm based on the topobiology of natural infarct growth and the modeling of ADC abnormalities occurring in the penumbral tissue.19–23 We have previously shown that the at-risk penumbra size correlated with the actual infarct growth and is partially salvaged by arterial recanalization.18
In this study, we investigated the impact of the baseline SGL on the fate of ADC-defined penumbra. Our main hypothesis was that strict NG would result in preservation of a greater volume of penumbral tissue-at-risk as defined by the ADC method. We also examined the relationship and possible interactions between HG and arterial recanalization on cerebral infarct growth to explore whether HG seems to be more related to penumbra-infarction transition than reperfusion injury in humans.
Materials and Methods
Patients
The population of the study has been described previously.18 In brief, 98 consecutive patients admitted to the stroke unit who met the following criteria were included in the study: acute nonlacunar MCA stroke, admission MR imaging performed within the first 6 hours of stroke onset, and follow-up MR imaging without symptomatic hemorrhage performed within the following 7 days. MR imaging was the first brain imaging technique used in each patient. Stroke onset was defined as the last time that the patient was seen without any neurologic deficits. Baseline SGL was performed at admission before MR imaging acquisition and treatment. SGL was missing in 4 patients, who were excluded from the study. Patients may have received intravenous tissue plasminogen activator (rtPa, alteplase) within an expanded 5-hour time window, following the standard acute stroke protocol at our institution.
According to this protocol, intravenous rtPA was given based on specific clinical and MR imaging criteria, such as baseline NIHSS >4 without major improvement, acute cerebral ischemia on the MR imaging sequences, exclusion of hemorrhage, evidence of an intracranial occlusion, and absence of other contraindications. Patients with large infarcts were discussed case by case. In this cohort, 31 patients were not treated because of delayed admission (n = 6), no intracranial occlusion (n = 6), major improvement before MR imaging (n = 8) or before treatment (n = 4), anticoagulant treatment (n = 2), very large infarct (n = 1), and other contraindications (n = 4). Intracranial artery patency was determined on the initial MRA. Occlusions were classified in 4 types: 1) carotid “T” occlusions, 2) tandem intracavernous carotid occlusion and MCA trunk occlusion (ICA/MCA), or occlusions of 3) MCA trunk (M1) or 4) MCA trifurcation branch (M2). MCA recanalization was assessed independently on MRA at follow-up MR imaging by 2 observers, and a consensus was reached in cases of disagreement. MRA was available in all but 1 patient. Recanalization was assessed by using a 3-item scale: complete recanalization was rated 0, partial recanalization was rated 1, and persistent occlusion was rated 2. Partial recanalization was defined as at least minimal flow related enhancement in the region of a previously identified MCA clot or displacement of the initial clot to a more distal portion of the MCA. Patients with complete or partial recanalization were further considered as “recanalized” patients because partially recanalized patients had a more favorable course than patients with persistent occlusion in previous studies.24
All imaging and clinical data were extracted from the clinical files of patients admitted to our stroke center and were retrospectively analyzed for the purpose of this study. Therefore, according to French legislation, explicit informed consent was waived. However, the regulation concerning electronic health information was followed, and both patients and their relatives were informed that individual data might be used in retrospective clinical research studies. None denied consent. The study was approved by the local Ethics Committee Institutional Review Board.
MR Imaging Methods
MR Imaging Acquisition.
MR imaging was performed by using a 1.5T whole-body Signa Horizon EchoSpeed unit (GE Healthcare, Milwaukee, Wisconsin) with enhanced gradient hardware for EPI. MR imaging included 3 sequences: DWI, FLAIR, and intracranial time-of-flight MRA. Fast-FLAIR sequence parameters were as follows: axial plane, 5-mm section thickness with an intersection gap of 1.5 mm, 256 × 256 matrix, 240 × 240-mm2 FOV, TR = 8800 ms, TE = 140 ms, and TI = 2200 ms. Axial isotropic DWI spin-echo EPI included 24 sections of 5-mm section thickness, intersection gap of 0.5 mm, 280 × 210-mm2 FOV, 96 × 64 matrix, and TR/TE = 2825 ms/98.9 ms. A baseline T2 acquisition and a diffusion-weighted acquisition by using a b-value of 1000 s/mm2 were both acquired within 40 seconds. Time-of-flight spoiled gradient-recalled acquisition MRA was acquired by using the following parameters: 1.4-mm axial section thickness; 256 × 192 matrix; 240 × 180-mm2 FOV; TR/TE = 2825 ms/92.6 ms; flip angle, 20°; 36 locations per slab; and acquisition time, 2 minutes 39 seconds.
Quantitative ADC maps were generated by dedicated, commercially available software (Functool 2; GE Healthcare, Buc, France). ADC map thresholds were set between 150 and 1200 × 10−6 mm2/s to remove voxels contaminated by partial volume effects from CSF.21
Region Volumes Defined from MR Imaging.
The admission initial infarct volume was defined as the abnormal hyperintense area on the initial DWI image set and measured by interactive manual outlining on an Advantage Windows Workstation (GE Healthcare). The final infarct volume was evaluated by using identical methodology from the follow-up DWI. The observed infarct growth was defined as the difference between final and initial DWI volumes. These 2 analyses were performed by 1 examiner who was blinded to the clinical data (C.R.). The high degree of reproducibility of these volume measurements has been previously reported.18,25
Prediction of Infarct Growth.
This method is based on measurement of the slight ADC decrease that occurs in the ischemic penumbra around the area of increased signal intensity in the DWI image.18,20,21,23 The detailed technical description of the image processing algorithm has been published previously.16,17 In brief, the prediction of infarct growth is obtained by an automatic image model, which mimics the natural history of infarct growth by iteratively accumulating voxels with low ADC values around the initial core of the infarct. The growth model is controlled by minimizing a global energy index, which is predominantly defined by the evaluation of regional ADC measures, complemented with local ADC indices and controls on the regularity of the surface envelope of the lesion to avoid erratic growth patterns. At each step of the simulated growth, the average ADC value tends to increase in the growing infarct model as the volume increases from the core of the ischemic focus toward more peripheral regions. The growth process is automatically terminated when the global energy of the lesion model is minimized, which essentially occurs when the regional ADC value within the final infarct model has reached a prespecified cutoff value. The optimal ADC cutoff value was determined in a preliminary study,18 with an ADC ratio of 0.93. The normalized ADC cutoff value corresponds to 0.93 × normal contralateral ADC value as determined in a circular 0.73-cm3 region of interest placed on the deep white matter of the noninfarcted hemisphere. The growth model automatically yields a predicted final volume. The predicted infarct growth is defined as the difference between the predicted final volume and the admission lesion volume on the DWI (Fig 1). The total postprocessing time including image transfer, algorithm process, and interpretation was <10 minutes.

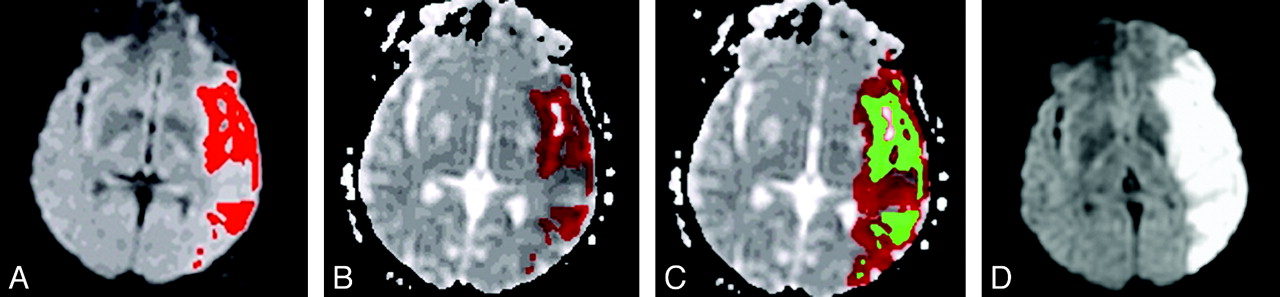
Prediction of MCA infarct growth in a hyperglycemic patient. The initial lesion was delineated on DWI images (A) and registered on the ADC map (B) in red; starting from the mask of the initial lesion obtained in B and represented in green (C), the region-growing model segmented the ADC map and iteratively added some voxels to the lesion mask, until a regional cutoff value was reached. (D) The observed final lesion visible as a bright area on the follow-up DWI.
Data Analysis and Statistical Methods
Comparison of HG versus NG Patients.
Patients were classified according to baseline SGL into 2 groups: hyperglycemic (>7 mmol/L) and normoglycemic (≤ 7 mmol/L) status. This threshold was chosen based on a recent Cochrane review that recommends 7 mmol/L as the upper level of acceptable SGL.26 This threshold value is within the range of the 6.1–8 mmol/L thresholds used for defining poststroke HG in several recent studies.2,8–11,27,28 We compared clinical, baseline, and final imaging data, including the amount of “spared tissue-at-risk,” defined as the difference between predicted and observed infarct growth in each patient, between the 2 groups. Our hypothesis was as follows: if the ADC-defined tissue-at-risk is part of the penumbra, HG patients would have higher observed infarct growth and smaller amount of spared tissue-at-risk. Quantitative data were compared with Mann-Whitney U nonparametric tests because the empirical probability distributions of the data were not normal, with the exception of ADC values that followed a normal distribution,23,30 and were compared with the Student t test. Proportions were compared with chi-squared22 tests. We further investigated the effect of SGL on the progression of infarction into the penumbral area by plotting observed versus predicted infarct growths for the 2 groups and by comparing the slopes and intercepts of the regression lines.
Multivariate Analysis.
We performed a broad analysis of the determinants of infarct growth by running a stepwise multiple regression model. The dependent variable was the observed infarct growth, and the independent variables were the predicted infarct growth, the baseline SGL (as a continuous variable), the dichotomized baseline SGL (ie, normo- or hyperglycemic status, binary variable), and the recanalization status; these variables were considered as potential predictors of infarct growth. Age, admission NIHSS score, initial DWI volume, and the stroke to MR imaging delay were considered as potential confounding variables. The variables were retained in the final model if they reached P < .05 level of significance. We then performed stepwise multiple regression models separately in the groups of patients with (n = 67, 72%) and without recanalization (n = 26, 28%) with the independent variables retained in the final model except the recanalization status. All statistics were done with MedCalc package, version 9.3.2.0 (MedCalc Software, Mariakerke, Belgium).
Results
Comparison of HG versus NG Patients
Among the 94 patients included in the study, 60 (64%) were in the normoglycemic group and 34 (36%) in the hyperglycemic group. Table 1 shows baseline and follow-up clinical and radiologic data in both groups. Besides baseline SGL, there was a significant difference for the baseline NIHSS score, which was higher in the HG than in the NG group. The amount of spared tissue-at-risk (defined as predicted − observed infarct growth) was significantly larger in the normoglycemic group, and observed infarct growth and final volume were significantly larger in the hyperglycemic group.
Clinical and radiologic characteristics in the hyperglycemic and nonhyperglycemic groups
The plots of observed versus predicted infarct growth are shown in Fig 2 for the hyperglycemic and normoglycemic groups. The slope of the regression line is close to 1 (0.98 ± 0.16) for the hyperglycemic group and is significantly steeper than that for the normoglycemic group (0.38 ± 0.08, P = .0008). Thus, normoglycemia was associated with reduced risk of transformation of penumbra into infarction.

Effect of SGL. Scatterplots of observed versus predicted infarct growths for hyperglycemic (open circles) and nonhyperglycemic patients (closed circles). The slope of the regression line for hyperglycemic patients (0.98 ± 0.16, P < .0001, R2 = 0.54) compared with the slope for nonhyperglycemic patients (0.38 ± 0.08, P < .0001, R2 = 0.27) was significantly higher (P = .0008).
Multivariate Analysis
The final model predicting observed infarct growth retained only 3 variables: predicted infarct growth, baseline serum glucose status, and MCA recanalization (Table 2). The variables that were not retained in the model were as follows: the baseline SGL (as a continuous variable), age, admission NIHSS score, initial DWI volume, and the stroke to MR imaging delay.
Coefficients of the multiple regression equations predicting observed infarct growth in the whole population and in the subgroups of nonrecanalized and recanalized patients
According to this model, in the entire group of patients, observed infarct growth was linearly related to the size of the penumbral area defined by ADC values (predicted infarct growth; regression coefficient: 0.73, P < .0001); the patients with MCA recanalization had on average 24 cm3 less infarct growth (P = .001) than those who did not recanalize, whereas the patients with HG had on average 29 cm3 more infarct growth (P = .0001) than the normoglycemic patients.
The effect of predicted infarct growth and baseline serum glucose status on observed infarct growth was independently tested in the patients who recanalized (n = 67/93, 72%) and in the patients who did not (n = 26/93, 28%). In both groups, the observed infarct growth was also significantly predicted by the predicted infarct growth and the baseline serum glucose status (Table 2). As expected, the regression coefficient of the observed versus predicted infarct growth relationship was larger in the nonrecanalized group (1.07) compared with the recanalized patients (0.56), in whom approximately half of the penumbral area did not progress to infarction. In addition, hyperglycemia is associated with 2.8 times larger infarct growth in patients who do not recanalize (51 cm3) compared with patients who recanalize (18 cm3).
Discussion
Consistent with our hypothesis, the volume of tissue-at-risk that evolved to infarction was larger in the HG group than in the NG group, and the deleterious effect of HG increased linearly with the size of the penumbra. These findings are consistent with the results of previously published perfusion-diffusion studies9–11 and thus confirm that HG is neurotoxic and facilitates cerebral infarct growth in the penumbra in a large series of patients. An alternative hypothesis is that HG may be at least in part a confounding factor or a marker of another still undetermined “neurotoxic” mechanism. This hypothesis is unlikely because HG toxicity in the ischemic penumbra has been experimentally demonstrated6,7 and is thought to be at least in part mediated by excess lactate production. Furthermore, a metabolic cascade has been demonstrated in stroke patients by combined MR spectroscopy and imaging data10: higher blood glucose in patients with perfusion-weighted imaging–DWI mismatch was associated with greater lactate production that, in turn, was independently associated with reduced penumbral salvage.
The toxicity of HG also is supported by the multivariate analysis, which explained infarct growth by only 3 independent variables—the size of the penumbra defined on DWI images by using ADC values, arterial recanalization, and HG baseline status—and ruled out the effect of possible confounding variables such as initial stroke severity or initial lesion volume. The parameters of the model allowed an average estimation of increased infarct growth associated with HG that is slightly larger than the estimated amount of tissue that did not progress to infarction in MCA recanalized patients.
The potential interactions between HG and arterial recanalization were further investigated by the multivariate subgroup analysis that first confirmed that recanalization reduced the transformation of penumbral area into infarction and then showed that HG was deleterious in both recanalized and nonrecanalized patients. In the latter group, HG was associated with 2.8 times larger ischemic transformation than in recanalized patients. Similar results have been reported by Ribo et al,11 who found that HG had a major impact on the speed of infarct growth in nonrecanalized patients. Thus, HG toxicity seemed to be related more to penumbra-infarction transition than to reperfusion injury in our patient population.
These data suggest that glucose control measures may be an effective therapeutic approach, but this conclusion needs to be tested in randomized trials. In such trials, it will be possible to test whether the 3 predictions logically derived from the results presented here contributed to the failure of the GIST trial.29 The “neuroprotective” effect of glucose control seemed to be “penumbra-dependent” and therefore may be “time-dependent,” so that treatment should be initiated during the therapeutic window and as soon as possible after stroke. In addition, effective neuroprotection may require very strict control of glucose level because in the present study dichotomized SGL rather than continuous glucose level seems to be toxic when glucose level is >7 mmol/L. This is in agreement with previous findings.4,9 Finally, the efficacy of the treatment may be more marked in patients with persistent intracranial arterial occlusion.
There are some of the limitations in this work. This study is a single center study and thus may not be generalizable. Also, DWI volumetry only allows an approximation of initial and final infarct size.18 Another limitation is that we did not assess the increased risk of hemorrhagic transformation that is potentially associated with HG,30 because we had to exclude patients with symptomatic hemorrhages to measure final infarct volumes. Finally, it would have been interesting to analyze potential confounding factors such as blood pressure data, initial collateral score, and time to recanalization.
Despite these limitations, this study confirmed the significance of ADC-based prediction, which is an entirely noninvasive method of assessment of the cerebral ischemic penumbra. The study also confirms that strict baseline NG may protect the fate of at-risk tissue. Insulin therapy has not yet proved to be effective therapy27–29,31–34 for acute stroke patients based on clinical end points assessments. Therefore, the ADC-based method could be used to study the effect of insulin therapy on smaller groups of patients, where end points are not solely dependent on clinical scales,35,36 thus obviating the confounding effects of functional specialization of different brain regions.
Conclusions
ADC-defined tissue-at-risk may represent ischemic penumbra, because part of this area may be protected in normal SGL patients. HG toxicity seems to be more related to penumbra-infarction transition than reperfusion injury in our patient population because HG is more toxic in nonrecanalized than in recanalized patients based upon multiple regression analysis of our data.
Acknowledgments
We are grateful to Prof. Lou Caplan for careful review of the manuscript and for helpful suggestions. We also are grateful to David Seidenwurm, MD, for review of the manuscript.
Footnotes
-
C.R. and Y.S. were partially supported in part by the Programme Hospitalier de Recherche Clinique EVAL-USINV (AOM 03 008).
-
Neurinfarct is protected by an international patent (WO 2008/000973) currently owned by Intelligence in Medical Technologies, Paris, France. C.R., S.D., N.H.-M., D.D., S.B., and Y.S. are co-inventors.
Indicates open access to non-subscribers at www.ajnr.org
References
- 1.
- 2.
- 3.
- 4.
- 5.
- 6.
- 7.
- 8.
- 9.
- 10.
- 11.
- 12.
- 13.
- 14.
- 15.
- 16.
- 17.
- 18.
- 19.
- 20.
- 21.
- 22.
- 23.
- 24.
- 25.
- 26.
- 27.
- 28.
- 29.
- 30.
- 31.
- 32.
- 33.
- 34.
- 35.
- 36.
- Received March 27, 2010.
- Accepted after revision October 3, 2010.
- Copyright © American Society of Neuroradiology