Abstract
SUMMARY: During the past decade, the application of advanced MR imaging techniques in neuropsychiatric disorders has seen a rapid increase. Disease-specific alterations in brain function can be assessed by fMRI. Structural GM and WM properties are increasingly investigated by DTI and voxel-based approaches like VBM. These methods provide neurobiologic correlates for brain architecture and function, evaluation tools for therapeutic approaches, and potential early markers for diagnosis. The aim of this review was to provide insight into the principles of functional and structural imaging and to delineate major findings in MCI, AD (Part 1), autism, and schizophrenia (Part 2), which are common psychiatric disorders covering different stages of the life span. Part 2 will conclude by summarizing current applications, limitations, and future prospects in the field of MR imaging−based neuroimaging.
ABBREVIATIONS
- ACC
- anterior cingulate cortex
- AD
- Alzheimer disease
- ASD
- autism spectrum disorders
- BOLD
- blood oxygen level–dependent
- DMN
- default mode network
- EEG
- electroencephalography
- FA
- fractional anisotropy
- GM
- gray matter
- ICA
- independent component analysis
- MCI
- mild cognitive impairment
- MD
- mean diffusivity
- PCC
- posterior cingulate cortex
- rsfMRI
- resting-state fMRI
- VBM
- voxel-based morphometry
The past years have seen significant advances in the areas of functional and structural neuroimaging, particularly in their application to the field of neuropsychiatric disorders.
MR imaging−based methods such as fMRI, DTI, and VBM provide neurobiologic correlates of neuropsychiatric disorders in vivo and potential early markers of disease for improved diagnosis. However, we still need to tune the available neuroimaging markers to provide an individually applicable marker of disease to predict the risk of an asymptomatic or oligosymptomatic subject developing a specific neuropsychiatric disease. This is most relevant for the design and conduction of future primary or secondary prevention trials of neurodegenerative disorders such as AD or genetically determined disorders, the course of which can be dramatically improved through early intervention, such as schizophrenia or ASD. To date the clinical application of MR imaging in neuropsychiatric diseases is mostly limited to the exclusion of macroscopic abnormalities. In this review, we discuss the methodologic basis and the scope and limitations of functional and structural MR imaging techniques and summarize major findings gained by applying these techniques to AD, schizophrenia, and ASD.
Brain Function as Assessed by fMRI
Classic task-dependent fMRI paradigms use the change in BOLD signal intensity evoked by the performance of a specific task in the scanner. The increase of BOLD signal intensity is an indirect measure of activation of a distinct brain region.1 rsfMRI is a novel approach in which the patient does not perform a task but lies quietly in the scanner. It allows the detection of functional resting-state connectivity of brain networks. Functional connectivity has been defined as “the temporal correlation of a neurophysiologic index measured in different brain areas.”2 In the context of rsfMRI, the neurophysiologic index is the BOLD signal intensity, which is known to display low-frequency spontaneous fluctuations in the resting brain (0.01–0.1 Hz)3 that can be distinguished from respiratory (0.1–0.5 Hz) and cardiovascular (0.6–1.2 Hz) signal-intensity frequencies.4 These signal-intensity fluctuations are spatially independent and show temporal correlation across largely separated cortical areas. These areas form functionally plausible networks that are crucial for perceptual, such as visual or auditory, processing5 or sensory-motor processing.5,6 Other resting-state networks include brain regions that are known to be involved in cognitive performance such as self-referential processing5,7 or attention.5,8
Attributing a specific function is based on inference from external evidence because by definition, the subject is not performing a specific task. This attribution is relatively obvious for some networks (eg, auditory and visual) but less straightforward for higher order cognitive networks. Such attributions often rely on patterns of task-induced activation revealed by classic task-dependent fMRI. The reliability of resting-state connectivity has been demonstrated9⇓–11 and might be further improved by mathematic modeling such as the dual-regression approach.12
The DMN is bridging the gap between task-induced and task-independent findings because it has been described as both a cluster of brain regions that are deactivated during the performance of other tasks and a network extractable from resting-state BOLD fluctuations. The localization of its components has furthermore been confirmed by PET,13 EEG,5,14 and magnetoencephalography.15 In simultaneous EEG-fMRI studies, slow EEG patterns were found to correlate negatively with functional connectivity in the DMN during the resting state.16,17 Moreover, structural data suggest that the DMN is predefined in the structural connectivity of its main components.18,19 Parietal and temporal components of the network are known to be involved in working memory and to serve as a storage for semantic knowledge.20 The PCC is engaged in the retrieval and modification of past experiences.21 The PCC seems to play a central role within the DMN22⇓⇓–25 and the attention network.26 Its activity was furthermore shown to be influenced by the process of physiologic aging.27 The ACC is active during affective and emotional processing28 and autobiographic memory retrieval29 to mention 2 major of many domains. In total, the DMN is a tonically active network involved in the perception, integration, and interpretation of internal and external stimuli30 and the application of past experiences for problem-solving and future plans.21
There are 2 most commonly used approaches to study resting-state connectivity. The first approach, ICA, allows data-driven whole-brain analysis of BOLD fluctuations and does, therefore, not depend on a priori hypotheses. As a tool of blind source separation, it can extract networks from the resting-state signal intensity on the basis of their spatial independence and similar BOLD time courses.31,32 The second approach uses predefined regions of interest as seed regions and determines functional connectivity by calculating regions composed of voxels displaying a significantly correlating BOLD signal intensity.6
Functional MR imaging has been widely used to discover between-group differences. The application of fMRI to detect early signs of disease in individual subjects has not yet been widely established. There are only a few examples of the clinical application on an individual patient level. The main clinical application has been in planning of epilepsy surgery. While invasive cortical mapping with subdural grids remains the criterion standard, task-dependent fMRI has been offered as a noninvasive means of functional mapping of distinct areas active during a particular task.33 Recent studies support the notion that resting-state functional connectivity MR imaging may provide an effective tool for presurgical mapping of eloquent cortex (eg, the motor cortex) and further brain systems34 as well as epileptogenic areas35 in a single scanning session.
The general paucity of clinical fMRI applications can be attributed to several limitations. One of the most important limitations is the poor signal intensity–to-noise ratio and the pronounced susceptibility to motion artifacts. A further important limitation, especially in neuropsychiatric disorders with prominent cognitive features such as dementia, schizophrenia, or autism, has been the dependence on language comprehension, concentration, and compliance for the performance of cognitive tasks within the scanner. Here, rsfMRI offers an intriguing novel approach that reduces the load of task fMRI on patients and their compliance.
Brain Structure as Assessed by DTI, Volumetry, and Morphometry
DTI
DTI is based on the measurement of diffusion properties of water molecules.36 It relies on the principle that diffusion of water molecules occurs unrestricted along all directions in CSF (isotropic), whereas in the WM, it is restricted axially and increases parallel to fiber bundles, leading to anisotropic diffusion. FA can, therefore, serve as an indirect measure reflecting the underlying structural integrity of fiber tracts.37 Greater FA values are believed to represent greater WM integrity.38 Lower FA values occur due to diminished myelinization, reduced amount of axons, decreased axonal diameter, and altered axonal interspaces in fiber tracts or bundles.39 In this review, we focus on DTI studies by using FA as an outcome marker. This is based on the premise that FA values currently represent the most commonly reported structural connectivity scale, compared with others such as MD or relative anisotropy.
The investigation of group differences in FA values can be performed by using a whole-brain voxel-based approach such as tract-based spatial statistics.40 By contrast, DTI tractography analyzes distinct preselected and segmented fiber tracts, allowing simultaneous quantification of volume and microstructural integrity.41
Volumetry and Morphometry
Assessment of brain anatomy includes volumetric and morphometric measurements. Brain structures such as the hippocampus can be evaluated by visual estimation and manual or automated volumetry. Regional GM changes can be assessed by cortical thickness measurement or morphometry. Morphometry is performed on the basis of local deformations42 or voxelwise GM attenuation (VBM). VBM is an adaptation of the statistical parametric mapping technique, which permits investigators to quantitatively examine whole-brain structural changes in a variety of conditions. It relies on the assumption that the recorded MR imaging T1-weighted voxel contains a mixture of distinct tissue types. These tissue types include GM, WM, and CSF. VBM allows a voxelwise comparison of regional GM and WM concentrations of spatially normalized images. Voxelwise parametric statistics can be performed on smoothed GM segments between groups. Recently, a new study even found GM changes after hours of learning new color names,43 indicating that VBM provides a possible basis for behavioral studies on the structural MR imaging domain. For an overview of MR imaging techniques used in neuroimaging, see Fig 1.

MR imaging−based modalities in neuroimaging research discussed in this review. In rsfMRI, the DMN of healthy subjects is shown. In DTI, the skeleton (green) is overlaid on the average FA image of healthy subjects. In VBM of healthy subjects, GM (blue-light blue), WM (white), and CSF (pink) can be extracted from T1-weighted structural data. All images are schematic representations of our own data, processed with Functional MR Imaging of the Brain Software Library, Version 1.7 (http://www.fmrib.ox.ac.uk).
AD and MCI
AD is a progressive neurodegenerative disease, accounting for ≤70% of all cases of dementia.44 It is characterized by impaired memory and decline of multiple other cognitive functions. In 2001, the estimated number of affected people worldwide was 24.3 million and was predicted to rise >40 million by 2020.45 MCI is defined as a mild-but-definite decline from the previous cognitive performance level, confirmed by a reliable observer, and clinically quantified by neuropsychological testing.46 The annual conversion rate from MCI to AD ranges between 8% and 16% in the literature.47,48 In this review, we will address the issues of detecting differences between MCI and AD and predicting future dementia in individuals with MCI.
Brain Structure
Medial temporal lobe volume loss, pronounced in the hippocampus and the entorhinal cortex, is the characteristic finding in structural MR imaging scans in patients with clinically apparent AD.49 Manual volumetry of the hippocampus discriminates AD and healthy control groups with high accuracy50 and displays a multicenter variability of <5%.51,52 It is, therefore, considered the best established imaging biomarker of AD to date.53 Hippocampal volumes and episodic memory performance have been shown to be correlated in AD.54 Structural studies by using whole-brain MR imaging volumetric approaches have furthermore demonstrated volume reduction, presumably as a sign of early atrophy, in the cingulate and precuneus regions and in the parietal cortex in patients with early AD.55,56 GM loss has been shown to be progressive throughout the clinically defined stages of AD.56
In MCI, decreased size of the hippocampal formation could be found in region-of-interest57 and voxel-based volumetric structural studies.58,59 The temporal lobe, as a whole, shows higher atrophy rates in MCI than in healthy controls.60 GM volume loss has also been sporadically described in frontal61 and parietal55 regions.
DTI studies in AD have yielded heterogeneous findings that, in summary, point to a loss of WM integrity, most likely secondary to cortical abnormalities in AD. A recent meta-analysis of 41 DTI studies in AD and MCI reported decreased FA values in AD in all regions except the parietal WM and internal capsule.62 Increased FA values were, for example, reported within fiber tracts of the temporal stem,63 splenium of the corpus callosum,64 cingulate bundle,65 and deep WM of the frontal, parietal, and temporal lobes.66,67 Sydykova et al68 could show that decreasing regional FA in callosal WM correlates with decreasing GM volume of association cortex areas. This led to the assumption that altered FA values reflect underlying degeneration of cortical neurons that rely on long-range projection fibers.
Diffusion tensor studies in MCI have, in general, demonstrated similar, sometimes less pronounced, patterns of decreased FA values in all WM regions except parietal and occipital regions,62 for example, in the cingulum bundle.65 In a follow-up study, Teipel et al69 could show that subjects with MCI had significant FA decline predominantly in the anterior corpus callosum, though DTI results on alteration of the corpus callosum have generally been nonuniform.65 The diagnostic use of DTI in AD and MCI has received little attention so far. In manifest AD, DTI-derived measures of FA and MD were not superior to more simple volume-based analysis of cortical GM volumes.70 However, in the MCI stage of disease, the hippocampus diffusion measurement was more accurate in separating patients from controls compared with hippocampus volume.71 These studies, however, need confirmation in larger samples. Evidence on multicenter stability of DTI measures for future application in large-scale studies is still limited. A recent study suggests that across a wide range of field strengths and acquisition parameters, variability of DTI-based FA measures is at least 50% higher than the variability of volumetric measures derived from structural MR imaging data.72
Brain Function
Most functional studies have enrolled patients with mild-to-moderate stages of AD because these subjects are more likely to be able to comply with the investigation, requiring minimal movement and high adherence to the task paradigm. Task-related fMRI studies in AD have mainly focused on encoding and memory paradigms. They revealed decreased activation of the parahippocampal and hippocampal regions in patients with AD compared with healthy controls73,74 and could establish association between memory-task performance and activation of the left superior temporal gyrus and the left prefrontal region.75 Besides decreased task-induced activation, patients with AD showed mainly prefrontal activation patterns not seen during task conditions in healthy comparison subjects,76,77 which can be interpreted as a compensatory activation of brain regions to preserve task performance in the presence of impaired task-related neuronal networks. In addition to decreased and increased task-induced activation, reduced task-induced deactivation of brain regions belonging to the DMN76 is a third principle of altered brain function in AD. Reduced deactivation in AD is especially pronounced in the medial parietal/posterior cingulate region78 and the ACC.79 Greicius et al80 could show that these networks also display strong connectivity with the hippocampus and that the connectivity between the PCC and hippocampus is decreased in AD.
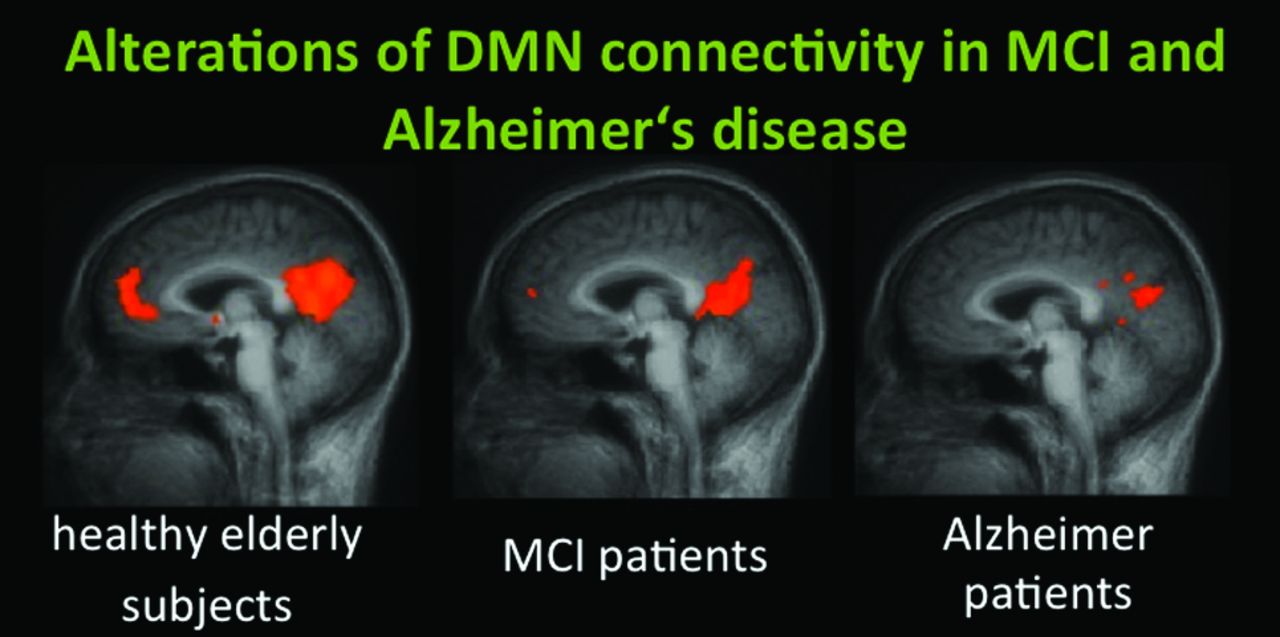
The DMN cannot only be assessed as a pattern of task-induced deactivation but can also be derived from the intrinsic resting-state BOLD signal intensity of the brain by means of resting-state connectivity analyses. When we applied 2 main approaches, VOI-based correlation analyses and whole-brain-based ICA to resting-state data of healthy controls, subjects with MCI, and patients with AD we found that time-course correlation analyses seem to outperform independent-component analyses in the identification of patients with AD (Fig 2).81 A study by Wang et al82 choosing the bilateral hippocampus as a VOI found disrupted connectivity predominantly between the right hippocampus and the main components of the DMN in AD.82

DMN connectivity of the ACC/medial prefrontal cortex and the PCC in healthy elderly subjects, those with MCI, and those with AD. A recent study by Koch et al81 demonstrated high classification accuracy by using multivariate analysis approaches.
fMRI studies in MCI have revealed altered cerebral activation in subjects with MCI during visual-processing83 and working-memory tasks.84 In subjects with MCI, medial temporal activation during memory tasks was shown to be increased, in contrast to reduced activation consistently observed in mild AD.84 However, according to Celone et al,76 this seemingly paradoxic hyperactivation of the hippocampus during memory tasks predominantly occurs in early stages of MCI, whereas more impaired MCI subjects revealed significantly decreased activation levels, similar to those in patients with AD. This increased medial temporal activation may be characteristic of a compensatory phase in subjects with early MCI, preceding the phase of decreased activation in the same regions with the transition from MCI to mild AD.85
Task-dependent functional connectivity among the medial temporal lobe, the PCC, and the parietal lobe has also been shown to be decreased in MCI, suggesting a disruption of connections between these memory and DMN regions by the characteristic early accumulation of AD-type neuropathology in these areas.86
Task-independent functional connectivity, as assessed by resting-state MR imaging, has likewise revealed reduced network connectivity between selected areas of the DMN and the executive attention network. In a study by Sorg et al.,87 functional connectivity between both hippocampi and the PCC of the DMN was present in controls but was not detectable in subjects with MCI. This functional-connectivity alteration was shown to be accompanied by decreased medial temporal lobe volumes as assessed by VBM.87
Conversion from MCI to AD
Structural and functional imaging may allow prediction of future conversion from MCI to AD. Hippocampal volume predicts conversion from MCI to AD with 70%–80% accuracy.88 Whole-brain longitudinal atrophy rates per se have been shown to predict conversion.89,90 More specifically, whole-brain VBM analysis reveals higher atrophy rates in converters in the hippocampal area, the inferior and middle temporal gyri, the posterior cingulate, and the precuneus.91 In a deformation-based morphometry study, Teipel et al42 detected a principal-component-analysis−derived pattern of regional brain atrophy, including the medial temporal lobes, neocortical association areas, thalamus, and basal ganglia, and consecutive CSF widening that allows discrimination between MCI converters and nonconverters with 80% accuracy based on CSF maps and 73% accuracy based on brain-atrophy maps.
DTI-based detection of higher baseline hippocampal MD has been shown to be associated with a greater risk of progression and may help identify patients with MCI who will progress to AD as well as or better than structural MR imaging measures of hippocampal atrophy.92,93
Increased fMRI hippocampal activation94 and decreased deactivation of posterior midline structures95 have also been found predictive of conversion. Lately, functional connectivity of the DMN has been shown to distinguish patients with MCI who undergo cognitive decline and conversion to AD from those who remain stable during the follow-up period.96
Conclusions
MR imaging−based neuroimaging can provide disease-specific patterns of functional and structural alterations in MCI and AD, some of which are predictors of conversion. However, most of these methods have just begun to be applied to predict disease on a single-subject level. Limitations, future prospects, and possible clinical scopes of the delineated MR imaging methods will be discussed in Part 2 of this review.
Footnotes
-
Disclosures: Stefan Teipel—UNRELATED: Grants/Grants Pending: Janssen-Cilag, Comments: grant provided from 2005 to 2009.
Indicates open access to non-subscribers at www.ajnr.org
References
- 1.
- 2.
- 3.
- 4.
- 5.
- 6.
- 7.
- 8.
- 9.
- 10.
- 11.
- 12.
- 13.
- 14.
- 15.
- 16.
- 17.
- 18.
- 19.
- 20.
- 21.
- 22.
- 23.
- 24.
- 25.
- 26.
- 27.
- 28.
- 29.
- 30.
- 31.
- 32.
- 33.
- 34.
- 35.
- 36.
- 37.
- 38.
- 39.
- 40.
- 41.
- 42.
- 43.
- 44.
- 45.
- 46.
- 47.
- 48.
- 49.
- 50.
- 51.
- 52.
- 53.
- 54.
- 55.
- 56.
- 57.
- 58.
- 59.
- 60.
- 61.
- 62.
- 63.
- 64.
- 65.
- 66.
- 67.
- 68.
- 69.
- 70.
- 71.
- 72.
- 73.
- 74.
- 75.
- 76.
- 77.
- 78.
- 79.
- 80.
- 81.
- 82.
- 83.
- 84.
- 85.
- 86.
- 87.
- 88.
- 89.
- 90.
- 91.
- 92.
- 93.
- 94.
- 95.
- 96.
- © 2012 by American Journal of Neuroradiology