Abstract
BACKGROUND AND PURPOSE: Identifying feeding arteries of intracranial AVMs is very important for preoperative evaluation. DSA remains the reference standard for diagnosis but is invasive. Our aim was to evaluate the diagnostic accuracy of vessel-encoded pseudocontinuous arterial spin-labeling in identifying feeding arteries of intracranial AVMs by using DSA as the criterion standard.
MATERIALS AND METHODS: Eighteen patients with AVMs were examined with vessel-encoded pseudocontinuous arterial spin-labeling and DSA. Three postlabeling delays (postlabeling delay = 1, 1.3, and 1.6 seconds) were applied in 6 patients, and a single postlabeling delay (1 second) was applied in the remainder. Perfusion-weighted images were decoded into individual vascular territories with standard and relative tagging efficiencies, respectively. The supply fraction of each feeding artery to the AVM was calculated. The within-subject ANOVA was applied to compare supply fractions acquired across 3 postlabeling delays. Receiver operating characteristic analysis curves were calculated to evaluate the diagnostic accuracy of vessel-encoded pseudocontinuous arterial spin-labeling for identifying the feeding arteries of AVMs.
RESULTS: There were no significant differences in supply fractions of the 3 major arteries to AVMs acquired with 3 postlabeling delays (P > .05). For vessel-encoded pseudocontinuous arterial spin-labeling with standard labeling efficiencies, the area under the receiver operating characteristic analysis curve was 0.942. The optimal cutoff of the supply fraction for identifying feeding arteries was 15.17%, and the resulting sensitivity and specificity were 84.62% and 93.33%, respectively. For vessel-encoded pseudocontinuous arterial spin-labeling with relative labeling efficiencies, the area under the receiver operating characteristic analysis curve was 0.957. The optimal cutoff of the supply fraction was 11.73%, which yielded an 89.74% sensitivity and 93.33% specificity.
CONCLUSIONS: The contribution fraction of each feeding artery of the AVM can be reliably estimated by using vessel-encoded pseudocontinuous arterial spin-labeling. Vessel-encoded pseudocontinuous arterial spin-labeling with either standard or relative labeling efficiencies offers a high level of diagnostic accuracy compared with DSA for identifying feeding arteries.
ABBREVIATIONS:
- ASL
- arterial spin-labeling
- AUC
- area under the ROC curve
- LICA
- left internal carotid artery
- PLD
- postlabeling delay
- RICA
- right internal carotid artery
- ROC
- receiver operating characteristic analysis
- VA
- vertebral artery
- VE-PCASL
- vessel-encoded pseudocontinuous arterial spin-labeling
Intracranial AVMs are congenital vascular abnormalities with ≥1 feeding artery and without a normal intervening capillary bed. The principal presentation of an AVM is parenchymal hemorrhage, which accounts for 2%–4% of overall hemorrhagic strokes1 and confers significant morbidity and mortality. AVMs may increase in size and show vascular remodeling with time. The management of AVMs includes microsurgery, stereotactic radiosurgery, embolization, and multimodality treatments. Residual lesions may exist after microsurgery, though with a low incidence.2,3 Complete obliteration with stereotactic radiosurgery requires approximately 1–3 years to complete, and a cure is not always achieved.4 For a large AVM, partial embolization is performed to make it amenable to further surgery or radiosurgery.5 The identification of feeding arteries of an AVM and calculation of corresponding contribution fractions are helpful for standard microsurgical operations, in which the arterial feeders are generally occluded first, followed by excision of the nidus, and finally resection of the draining veins.6 Information about feeding arteries can also help in determining the sequence of arteries to be managed. A reliable, safe, and convenient imaging technology with the capability of identifying feeding arteries would be highly desirable for frequent examinations of AVMs.
DSA remains the criterion standard for the diagnosis and evaluation of intracranial AVMs. In our institution (Beijing Tiantan Hospital), it is usually performed just before the operation to identify feeding arteries and corresponding draining veins. As an invasive technique, DSA exposes both doctors and patients to the radiation of x-rays and carries potential risks related to contrast agents and the experience of the operators.7 Although these results are rare, DSA may cause vessel injury, stroke, and even death, which is most concerning.8 Various MRA techniques have been explored for the evaluation of AVMs, such as 4D time-resolved dynamic MRA with or without contrast enhancement.9,10 Arterial spin-labeling (ASL) offers a method for quantifying regional CBF by using magnetically labeled arterial blood water as an endogenous tracer.11 While delayed arterial transit may cause underestimation of tissue perfusion in patients with stroke, the opposite effect—the rapid transit of labeled blood through arteriovenous shunts—can be exploited for direct visualization and, potentially, quantification of arteriovenous shunting.12,13 More recently, pseudocontinuous ASL has been introduced, which uses a train of discrete radio-frequency pulses to mimic flow-driven adiabatic inversion and combines the continuous superior signal-to-noise ratio of ASL and the higher tagging efficiency of pulsed ASL.14 Vessel-encoded pseudocontinuous arterial spin-labeling (VE-PCASL) is a time-efficient method for mapping multiple vascular territories by using x and y gradients to encode arteries within the labeling plane.15 It has been applied in the evaluation of collateral circulation in ischemic cerebrovascular diseases in previous studies.16,17
In this study, we applied VE-PCASL in patients with intracranial AVMs to identify feeding arteries of AVMs on the basis of the estimated supply fractions of the arteries. Due to the presence of noise in the supply fraction maps and potential contamination of ASL signals between vessels, a cutoff or threshold was applied on the estimated supply fraction to identify the “true” feeding arteries of AVMs. The accuracy of VE-PCASL for identifying feeding arteries at various cutoff values of the supply fraction was evaluated by using DSA as the criterion standard.
Materials and Methods
Patients
This study was approved by the institutional review boards, and written informed consent was obtained from all participants. The inclusion criteria were patients diagnosed with intracranial AVMs and without other brain lesions who were scheduled for DSA examination at Beijing Tiantan Hospital. The general contraindications for MR imaging examination were applied as the exclusion criteria.
DSA Technique
DSA was performed according to a standard protocol during routine clinical examinations on a biplane angiography system (Advantx LCV+; GE Healthcare, Hertfordshire, UK). A 5F diagnostic catheter was navigated into the bilateral internal carotid, external carotid, and vertebral arteries (VAs) (6 vessels), respectively, via the right femoral artery to acquire standard anteroposterior and lateral projections, each by manual delivery of a 5- to 7-mL iodinated contrast agent injection per run (iodixanol, Visipaque; GE Healthcare, Co. Cork, Ireland).
MR Imaging
MR imaging was performed on a 3T Tim Trio system (Siemens, Erlangen, Germany) by using a body coil transmitter and a 12-channel head coil as a receiver. First, a sagittal localizer scan was performed for anatomic reference; then TOF MRA was performed to select the right and left ICAs and vertebral arteries, on the basis of which the tagging plane was determined (Fig 1). The labeling offset from the center of the imaging slab was 80 mm. In this axial tagging plane, the ICAs and vertebral arteries had an approximately trapezoidal arrangement and the direction of flow was predominantly inferior-to-superior. The image sections were positioned parallel to the labeling plane. Postlabeling delay (PLD) was set at 3 time points (1, 1.3, and 1.6 seconds) in 6 patients and at a single time point of 1 second in the remaining 12 patients. Imaging parameters were as follows: TR/TE/flip angle = 3000 ms/10 ms/90° for PLD = 1 second (while TR = 3.3 seconds for PLD = 1.3 seconds and TR = 3.6 seconds for PLD = 1.6 seconds), FOV = 220 × 220 mm2, 12 sections with a 6-mm thickness and 1.5-mm gap, matrix size = 64 × 64, 7/8 partial k-space, 120 measurements, and 2D EPI readout. We performed 6 cycles of VE-PCASL: global tag, control, tag of the left-versus-right ICA, tag of ICA versus the vertebrobasilar artery.15 The total scanning time was 6.2 minutes for 1 PLD and 20 minutes for 3 PLDs.

Labeling plane on the coronary (A) and transverse (B) MRA images. Arrows show RICA (R), LICA (L), and vertebrobasilar arteries (B).
Data Processing
Raw EPI images were corrected for motion. Global perfusion-weighted images were obtained by subtraction of the globally tagged images from the control images. CBF was calculated according to previous studies.18 A standardized 12-voxel region of interest was placed in the contralateral basal ganglia on the signal-intensity difference (global perfusion) image to measure the mean value and SD. Basal ganglia signal (mean) + 8 SDs was set as the threshold to generate a mask for the AVM lesion on the global perfusion image.12
The 6 cycles of EPI images were averaged and decoded into individual vascular territories corresponding to the left ICA, right ICA, and VA, with standard and relative tagging efficiencies,15 respectively. The standard tagging efficiency matrix was adopted from previous studies.15 In addition, the relative tagging efficiency for each artery (assuming that the efficiency of nonselective labeling is 1) was measured directly from the experimental data by using the histogram method in each subject.19 The estimated relative tagging efficiencies were then used in the construction of the modified Hadamard encoding matrix (Table 1).
Modified Hadamard encoding matrix based on estimated relative labeling efficiencies of the 18 patients with AVMs
The AVM mask determined on global perfusion images was overlaid on individual perfusion maps of the 3 main feeding arteries. The contributions of the 3 main arteries to the AVM lesion were quantified by calculating supply fractions.19 The supply fraction was defined as CBF values of all voxels within the AVM mask on individual CBF maps (CBFind) divided by the summation of CBF values of the 3 main arteries—that is, CBFind/(CBFLICA + CBFRICA + CBFVA) × 100%.
Analysis
Two experienced neurosurgeons (both with >10 years' experience) who were blinded to the results of VE-PCASL reviewed DSAs in a random order to identify the major arteries that supplied the AVM lesions. In each patient, each of the 3 major arteries (a total of 54 arteries) was labeled zero or 1 as feeding arteries of the AVM. In cases of disagreement, a consensus was sought. Two experienced researchers reviewed the ASL perfusion-weighted images independently in a random order. Image quality was scored from 5 to 1, corresponding to excellent, good, fair, poor, or uninterpretable, respectively. The Cohen κ was obtained to evaluate interobserver agreement on image quality. The κ coefficient of agreement was graded as follows: 0–0.2 = poor to slight; 0.21–0.4 = fair; 0.41–0.6 = moderate; 0.61–0.8 = excellent; 0.81–0.99 = nearly perfect; 1.0 = perfect.20
Receiver operating characteristic analysis (ROC) curves were generated from the supply fractions of the 3 major arteries obtained by VE-PCASL with PLD = 1 second, by using the Statistical Package for the Social Sciences, Version 16.0 (IBM, Armonk, New York). The area under the ROC curve (AUC) was calculated to compare the diagnostic accuracy of VE-PCASL with standard and relative labeling efficiencies, respectively. The cutoff of the supply fraction was determined as the value that achieved a targeted balance between sensitivity and specificity. In the present study, the value of the supply fraction associated with the maximal sum of sensitivity and specificity was chosen as the optimal cutoff.
Statistical analyses were performed by using within-subject ANOVA to compare supply fractions acquired with different PLDs. The data processing was performed with Matlab R2009a (MathWorks, Natick, Massachusetts).
Results
Patients
Between December 2011 and November 2012, eighteen consecutive patients (8 women/10 men; mean age, 32.8 ± 10.8 years) with intracranial AVMs were recruited for this prospective study. All 18 patients demonstrated no other lesions in the brain, and 1 patient had an interventional operation to partially embolize the AVM lesion. The demographic data of the studied population are listed in Table 2. The time interval between preoperative DSA and VE-PCASL was 2∼40 days (mean = 11.7 ± 14.1 days).
Demographic data on the studied population and characterization information of AVMs
Image Quality
The identification of feeding arteries of the AVM was consistent between the 2 neurosurgeons on the basis of DSA reports. VE-PCASL was performed successfully in all 18 patients in whom AVM lesions could be identified with obviously high CBF values. The average score of image quality of the ASL maps was 4.36 ± 0.72. The κ coefficient was 0.723 between the 2 raters, which indicates excellent agreement.
Reliability of VE-PCASL
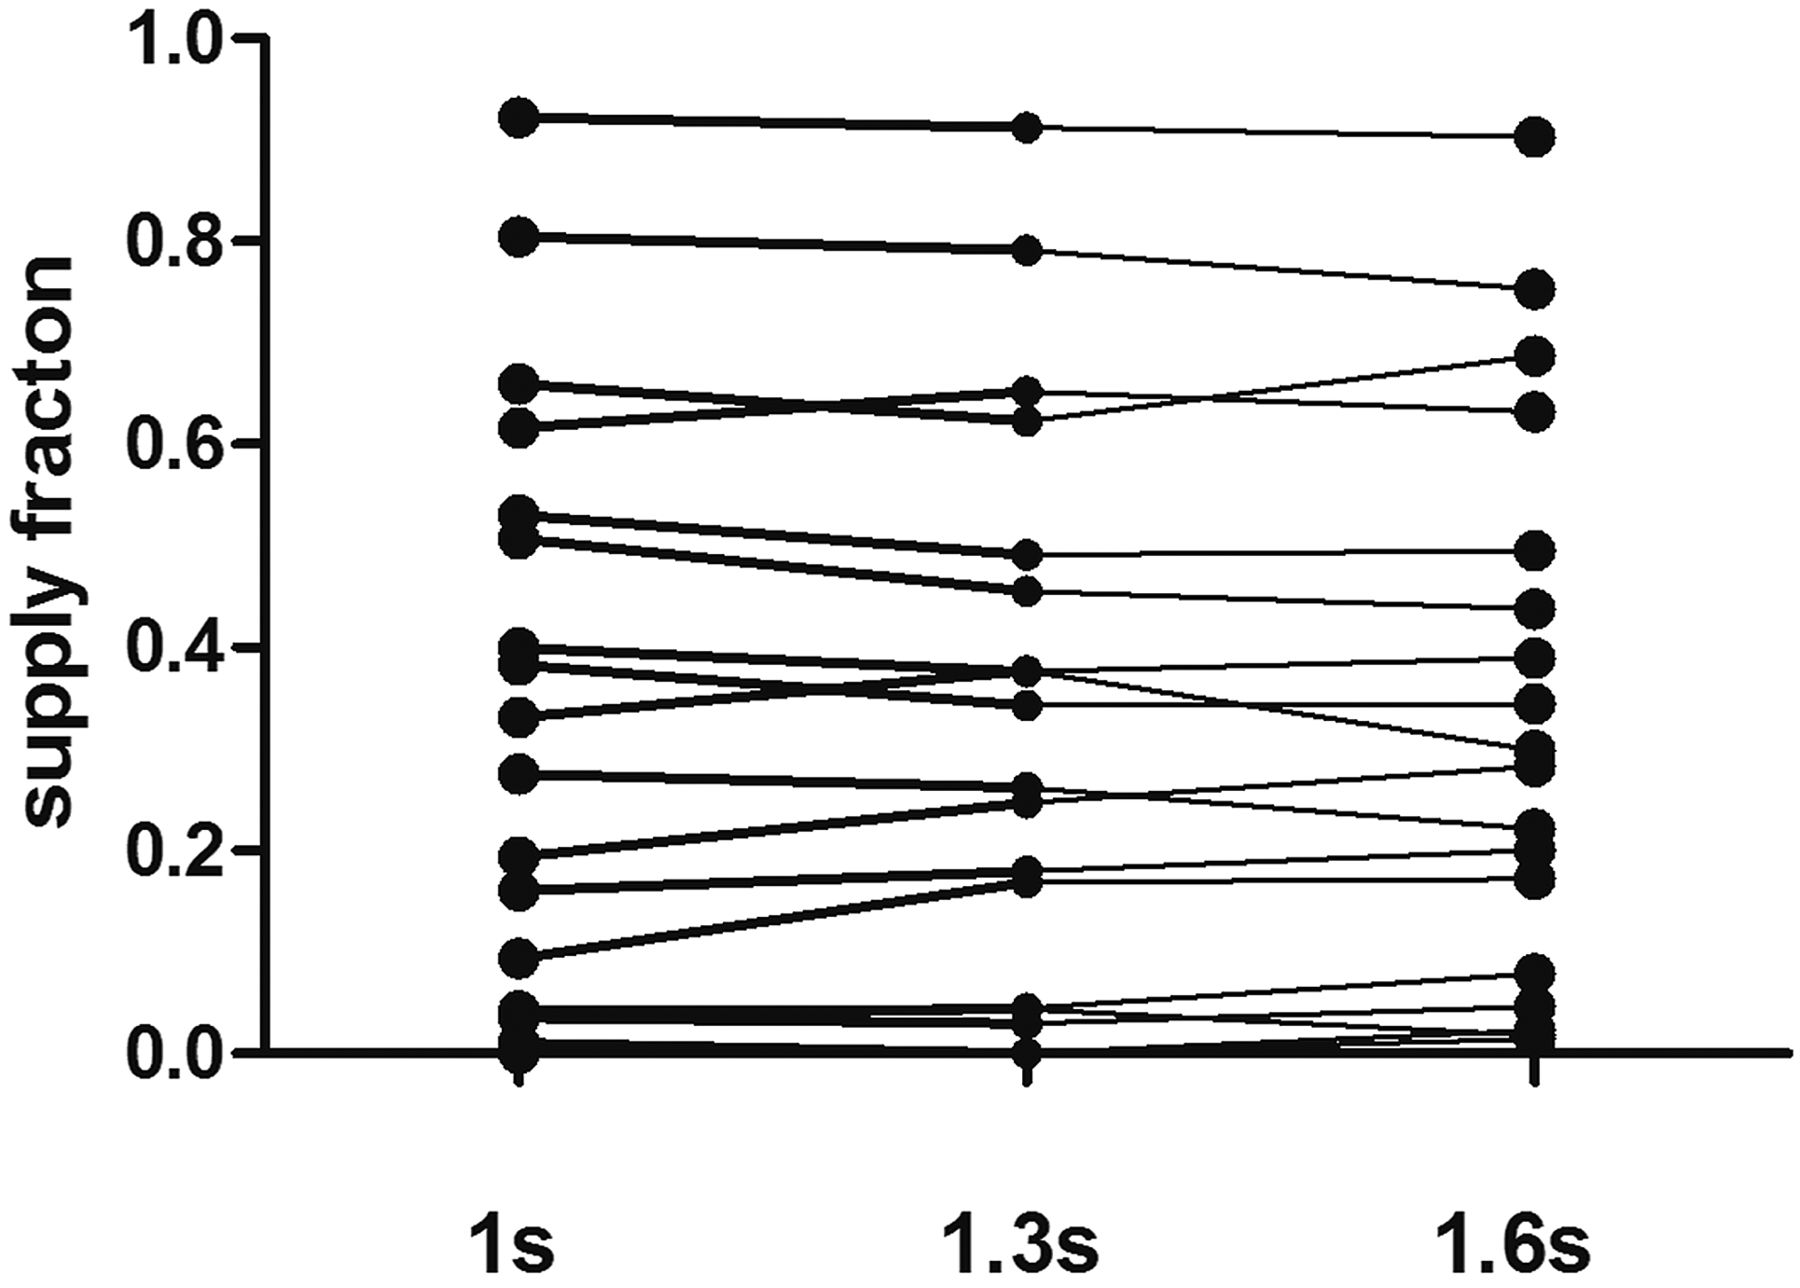
Supply fractions of individual feeding arteries to the AVM lesions were successfully obtained by using both standard and relative tagging efficiencies, respectively. For the 6 patients with 3 PLDs, there were no significant differences in the supply fractions obtained at 3 PLDs (P > .05, Fig 2).

For the 6 patients (18 vessels) with 3 PLDs, there are no significant differences in the supply fractions with relative labeling efficiencies (P > .05).
Diagnostic Accuracy of VE-PCASL
The diagnostic accuracy of VE-PCASL assessed by ROC showed high sensitivity and specificity at various cutoff levels for both standard and relative labeling efficiencies (Table 3). Both methods yielded a high diagnostic accuracy with an AUC > 0.9 (P < .01) (Fig 3).
Different cutoff values of the supply fraction of feeding arteries of the AVM and the resulting sensitivity and specificity with standard or relative labeling efficiencies respectively

ROC curves of VE-PCASL with standard (blue line) and relative (green line) labeling efficiencies, respectively, for the identification of feeding arteries, and the AUC is larger for relative labeling efficiencies.
For VE-PCASL encoded with standard labeling efficiencies, the ROC curve showed that the cutoff of 15.17% supply fraction is optimal for identifying feeding arteries to the AVM. For that cutoff level (ie, supply fraction ≥15.17%), the sensitivity was 84.62% and the specificity was 93.33%, the positive predictive value was 97.06%, and the negative predictive value was 70%. The AUC was 0.942 (P < .01), indicating a high level of accuracy (Fig 4).

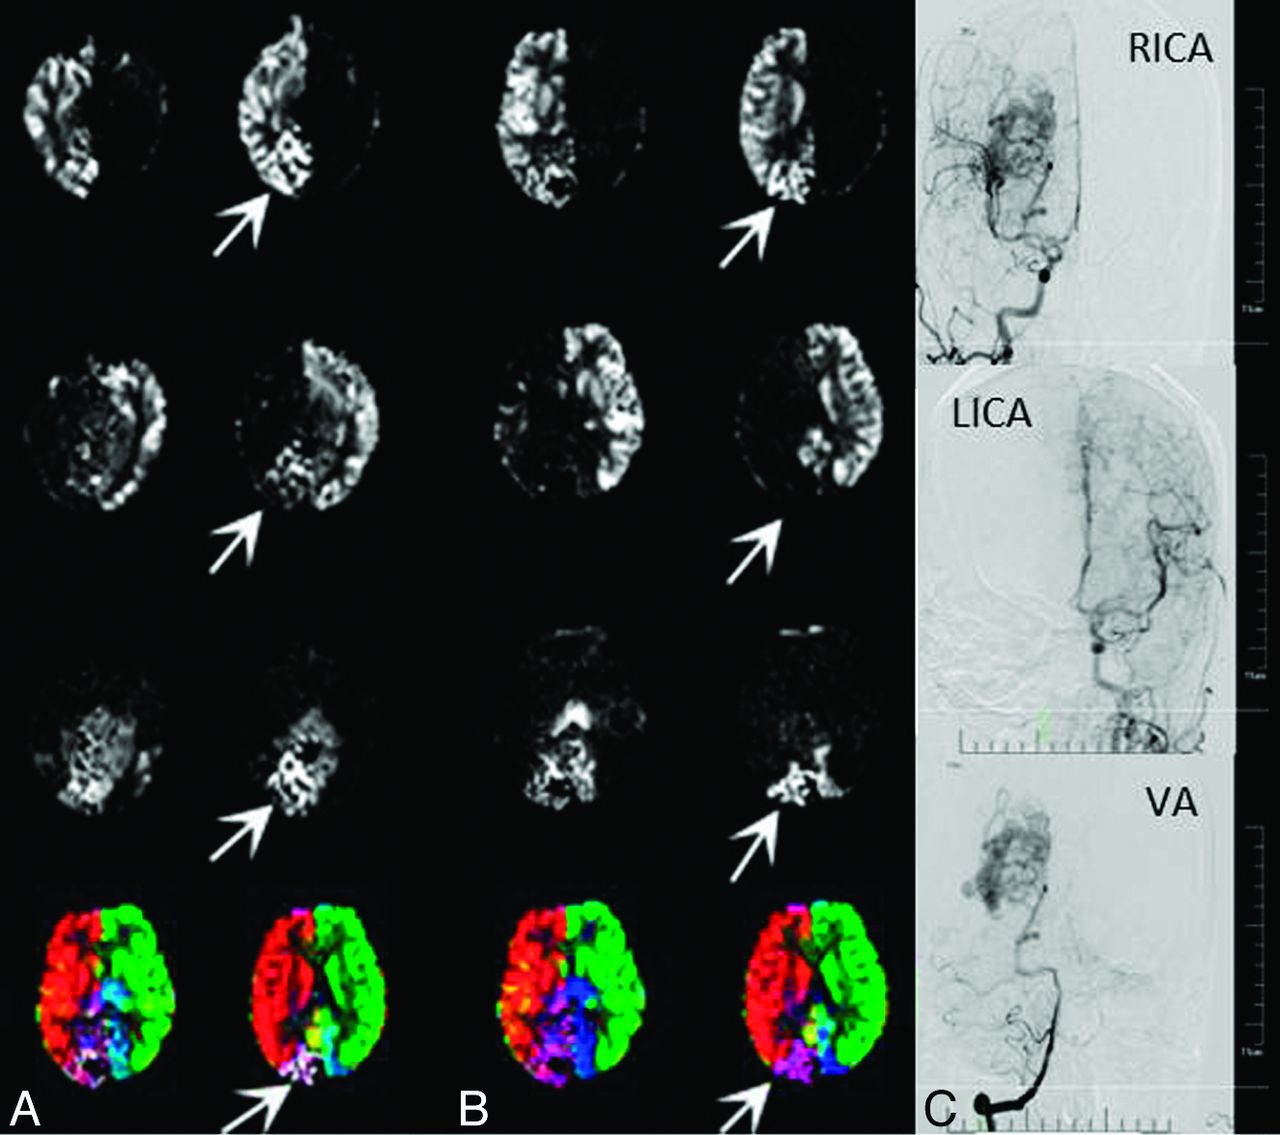
Patient 1, a 23-year-old man. He had headaches and blurred vision in both eyes for half a year. The supply fractions of the left ICA, VA, and right ICA were 52.59%, 46.75%, 0.66% and 49.27%, 50.71%, 0 with standard and relative labeling efficiencies, respectively, showing good agreement between the 2 methods. A, VE-PCASL with standard labeling efficiency (arrows show the AVM lesion). B, DSA shows that the AVM lesion is fed by the left ICA and VA.
VE-PCASL with relative labeling efficiencies showed an improved ability to discriminate ASL signals from different arteries. This resulted in an improved sensitivity while maintaining the specificity with a decreased cutoff of supply fractions. The AUC for this method was 0.957, and the optimal cutoff of the supply fraction was 11.73%, which led to an 89.74% sensitivity, 93.33% specificity, 97.22% positive predictive value, and 77.78% negative predictive value. The AUC by using relative labeling efficiencies was greater than that of standard labeling efficiencies, though there were no significant differences between the AUCs of the 2 decoding methods (Fig 5).

Patient 13, a 27-year-old woman. She had a sudden severe headache accompanying a visual field defect 2 months ago, which was confirmed as spontaneous intraventricular hemorrhage by CT. A, VE-PCASL with standard labeling efficiencies shows relatively poor separation of left-versus-right ICA perfusion territories, and there are abnormally high signals in the left ICA perfusion territory with the supply fraction of 14.31%, mismatching the results of DSA. B, VE-PCASL with relative labeling efficiencies shows an improved separation, and there are fewer abnormally high signals from the left ICA perfusion territory with the supply fraction of 1.14% (arrows show the AVM lesion). C, DSA shows that the AVM lesion is fed by the VA and right ICA.
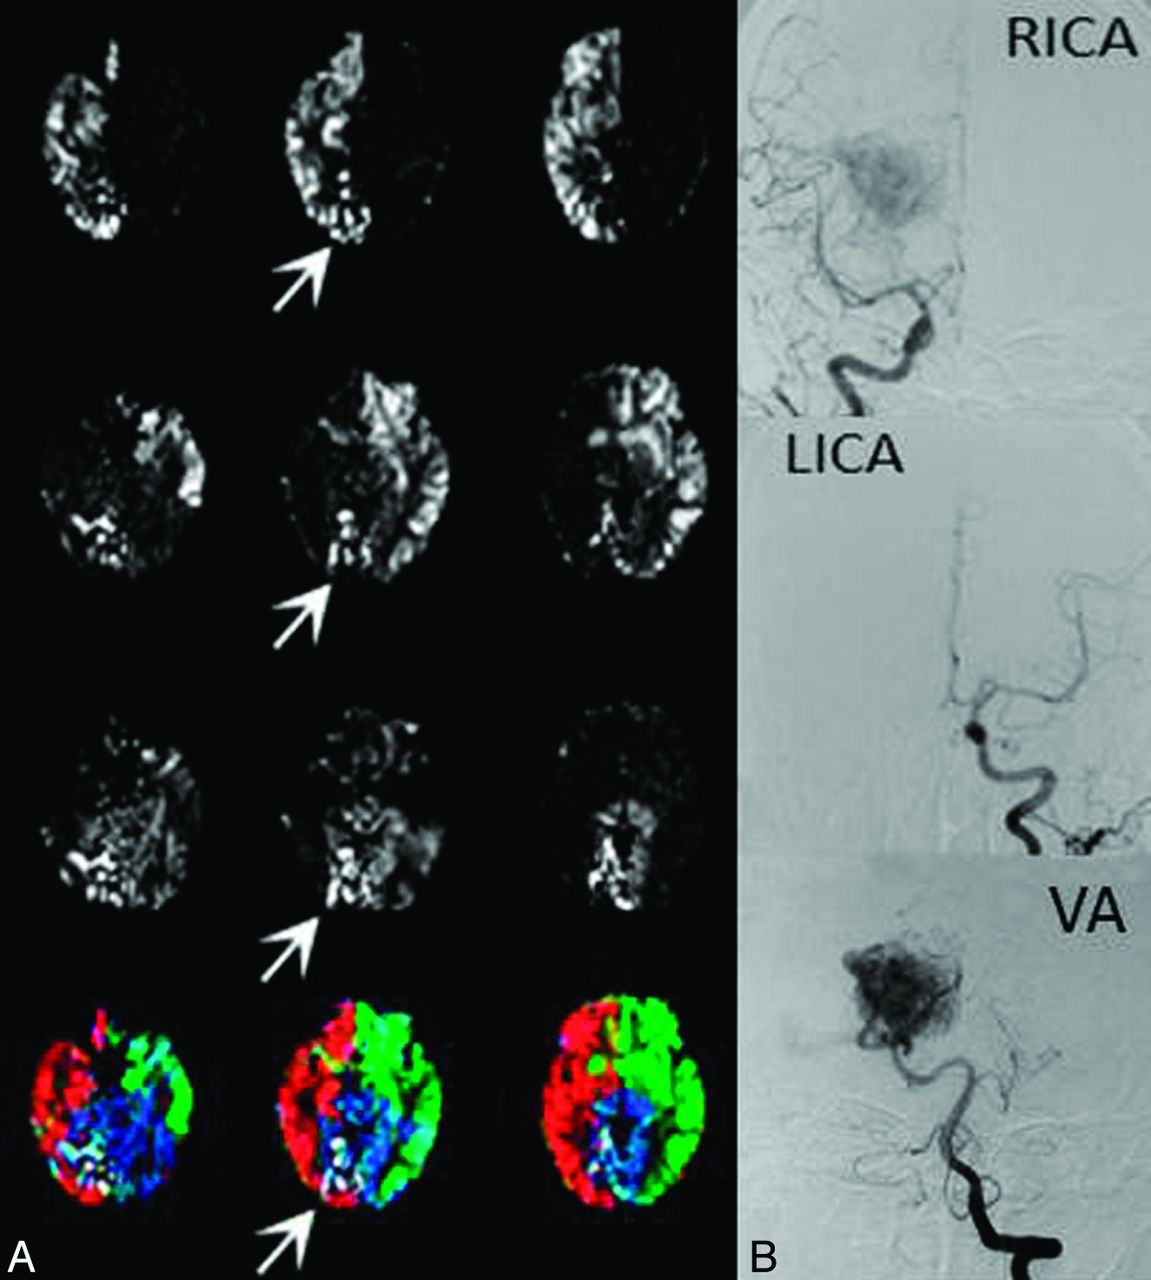
However, VE-PCASL with relative labeling efficiencies was not perfect. Figure 6 shows an AVM located in the right occipital lobe that was fed by the VA and right ICA on DSA. VE-PCASL with standard labeling efficiencies showed abnormally high signals in the left ICA perfusion territory with a supply fraction of 27.53%, mismatching the results of DSA. VE-PCASL with relative labeling efficiencies reduced the supply fraction of the left ICA to 25.67% but still failed to match the results of DSA. There were still hyperintensities in the left ICA perfusion territory.

Patient 9, a 31-year-old woman. She had dizziness for approximately 2 years. VE-PCASL with standard labeling efficiencies showed abnormally high signals in the left ICA perfusion territory with the supply fraction of 27.53%, mismatching the results of DSA. A, VE-PCASL with relative labeling efficiencies shows reduced abnormal signals with the supply fraction of 25.67% but still fails to match the results of DSA (arrows show the AVM lesion). B, DSA shows that the AVM lesion is fed by the VA and right ICA.
Discussion
VE-PCASL is a recently introduced time-efficient method for mapping multiple vascular territories. It can estimate the fraction of CBF supplied by each artery by using x-y gradients to encode the major arteries within the labeling plane. The imaging process is conceptually similar to that of conventional angiography without the use of x-rays or iodinated contrast agents. As a result, VE-PCASL has engendered increasing attention in the evaluation of cerebrovascular disorders such as steno-occlusive disease, aneurysms, and AVMs. However, 1 shortcoming of VE-PCASL is its sensitivity to magnetic field inhomogeneity effects at the labeling location, which affects tagging efficiencies of individual arteries.21 Furthermore, for AVMs, there is clearance of tagged blood by venous flow due to the lack of a normal capillary network, which would lead to inaccuracy in quantifying CBF. In the present study, we estimated the relative tagging efficiencies of 3 major arteries in each individual patient by using the histogram method. We also applied 3 different PLDs to check whether the supply fraction can be estimated reliably. The results were relatively stable across different PLDs; this finding indicates that VE-PCASL can provide a reliable estimation of supply fractions of individual arteries despite several potential confounding factors such as relaxation and venous outflow of the labeled blood.
Optimal Hadamard encoding assumes that all inflowing blood is either fully inverted or fully relaxed for each tagging cycle, and there are equal numbers of tag and control conditions for each vessel.15 This assumption may not be realistic because of vessel geometry and variations in tagging efficiencies due to field inhomogeneity effects. As a result, the discrimination of arteries may not be perfectly achieved and there may be contamination of ASL signals from different arteries. This result may not be prominent in healthy populations but would be noteworthy in AVM lesions in which CBF is abnormally high. To circumvent this problem, Wong15 proposed a histogram-based method for estimating vessel-specific labeling efficiencies from VE-PCASL data, which were applied in the construction of the encoding matrices to improve the separation of supplying arteries within vascular territories.
Overall, VE-PCASL with both standard and relative labeling efficiencies showed a high level of accuracy in identifying feeding arteries (AUC = 0.942 and 0.957). In the present study, the optimal cutoff was chosen as a balance between sensitivity and specificity (maximal sum). Because no statistical significance was observed, it is too soon to conclude that VE-PCASL with relative labeling efficiencies has better performance compared with that of standard labeling efficiencies. VE-PCASL with both standard and relative labeling efficiencies awaits further evaluation in larger scale clinical studies.
Various MR imaging techniques have been applied as noninvasive and radiation-free methods for the evaluation of intracranial AVMs. However, the subjective interpretation of feeding arteries may be viewer-dependent. VE-PCASL evaluates feeding arteries and AVM lesions differently than TOF-MRA or DSA. It does not display the vascular architecture directly but provides a quantitative estimate of supply fractions of individual arteries, which can be displayed in color scales. The fractional supply was calculated to evaluate the role of each feeding artery quantitatively rather than by qualitative approaches without standardization. In addition, it can help to determine dominant feeding arteries, the pattern of which would influence the chances for complete or subtotal obliteration of AVM lesions.22 The cutoff or threshold of the supply fraction should be determined according to the clinical purpose. For example, if the purpose was for preliminary screening of feeding arteries, the lower cutoff (higher sensitivity) should be applied, while a higher cutoff (higher specificity) should be chosen for precise identification of feeding arteries.
In addition to the advantages of a quantitative evaluation of supply fractions, VE-PCASL can display the spatial relationship between AVM lesions and functional or eloquent cortices, which would provide valuable information for neurosurgical operations. Furthermore, VE-PCASL can evaluate hypoperfused areas around the AVM to probe a potential “steal phenomenon” related to the AVM lesion.12 Recently, VE-PCASL has also been expanded to encode branches of the circle of Willis, even without prior knowledge of vessel positions.23
A limitation of our study is that the number of patients was relatively small; thus, the selection of the cutoff may serve as a reference rather than a criterion. Another limitation is that we did not label bilateral external carotid arteries with VE-PCASL, which may also contribute to the feeding of intracranial AVMs (1 AVM in this study was confirmed to be fed partially by ipsilateral external carotid artery on DSA). However the latter problem has recently been resolved technically17 and labeling bilateral external carotid arteries can be applied in assessments of AVM lesions in the future.
Conclusions
Quantitative supply fractions of feeding arteries to intracranial AVMs can be reliably estimated with VE-PCASL. VE-PCASL with either standard or relative labeling efficiencies demonstrated a high level of accuracy for identifying feeding arteries of AVMs. Even though VE-PCASL cannot replace DSA for clinical diagnosis currently, it can act as preoperative adjunct to estimate relative contributions of feeding arteries.
Footnotes
Disclosures: Rong Xue—RELATED: Grant: Ministry of Science and Technology of China,* Chinese Academy of Sciences Knowledge Innovation Project.* Danny J.J. Wang—RELATED: Grant: National Institutes of Health. *Money paid to the institution.
This work was supported by Natural Science Foundation of China of Tiantan Hospital (30830101), the National Institutes of Health (grants R01-MH080892, R01-NS081077 and R01-EB014922), the Ministry of Science and Technology of China (grant 2012CB825500), and the CAS Knowledge Innovation Project (grant KSCX2-YW-R-259).
Indicates open access to non-subscribers at www.ajnr.org
REFERENCES
- 1.
- 2.
- 3.
- 4.
- 5.
- 6.
- 7.
- 8.
- 9.
- 10.
- 11.
- 12.
- 13.
- 14.
- 15.
- 16.
- 17.
- 18.
- 19.
- 20.
- 21.
- 22.
- 23.
- Received December 31, 2012.
- Accepted after revision March 17, 2013.
- © 2014 by American Journal of Neuroradiology