Abstract
BACKGROUND AND PURPOSE: 3D turbo field echo with diffusion-sensitized driven-equilibrium preparation is a non–echo-planar technique for DWI, which enables high-resolution DWI without field inhomogeneity–related image distortion. The purpose of this study was to evaluate the feasibility of diffusion-sensitized driven-equilibrium turbo field echo in evaluating diffusivity in the normal pituitary gland.
MATERIALS AND METHODS: First, validation of diffusion-sensitized driven-equilibrium turbo field echo was attempted by comparing it with echo-planar DWI. Five healthy volunteers were imaged by using diffusion-sensitized driven-equilibrium turbo field echo and echo-planar DWI. The imaging voxel size was 1.5 × 1.5 × 1.5 mm3 for diffusion-sensitized driven-equilibrium turbo field echo and 1.5 × 1.9 × 3.0 mm3 for echo-planar DWI. ADCs measured by the 2 methods in 15 regions of interests (6 in gray matter and 9 in white matter) were compared by using the Pearson correlation coefficient. The ADC in the pituitary anterior lobe was then measured in 10 volunteers by using diffusion-sensitized driven-equilibrium turbo field echo, and the results were compared with those in the pons and vermis by using a paired t test.
RESULTS: The ADCs from the 2 methods showed a strong correlation (r = 0.79; P < .0001), confirming the accuracy of the ADC measurement with the diffusion-sensitized driven-equilibrium sequence. The ADCs in the normal pituitary gland were 1.37 ± 0.13 × 10⁻³ mm2/s, which were significantly higher than those in the pons (1.01 ± 0.24 × 10⁻³ mm2/s) and the vermis (0.89 ± 0.25 × 10⁻³ mm2/s, P < .01).
CONCLUSIONS: We demonstrated that diffusion-sensitized driven-equilibrium turbo field echo is feasible in assessing ADC in the pituitary gland.
ABBREVIATIONS:
- DSDE
- diffusion-sensitized driven-equilibrium
- EP
- echo-planar
- TFE
- turbo field echo
DWI is widely used to diagnose cerebrovascular diseases, intracranial tumors, and inflammation.1⇓⇓⇓⇓⇓⇓⇓⇓–10 However, it is difficult to evaluate skull base structures by the most common imaging technique used with echo-planar (EP)-DWI. Previous studies have revealed the efficacy of DWI for skull base tumors such as pituitary adenoma; however, they are mostly limited to macroadenomas large enough to calculate the ADC by using EP sequences.3⇓⇓⇓–7 Compared with EP-DWI, 3D diffusion-sensitized driven-equilibrium turbo field echo (DSDE-TFE) obtained DWI has higher spatial resolution and fewer susceptibility artifacts.11 To our knowledge, to date, the diffusivity of the normal pituitary gland has not been fully evaluated, especially in those glands surrounded by aerated sphenoid sinuses. Therefore, the purpose of this study was to evaluate the feasibility of DSDE-TFE in evaluating diffusivity in the normal pituitary gland.
Materials and Methods
The study was conducted with approval of the involved institutional review boards. Written informed consent was obtained from each participant. First, we validated DSDE-TFE and compared it with EP-DWI. Then, ADC measurement in the anterior lobe of the pituitary gland was performed.
Imaging Technique
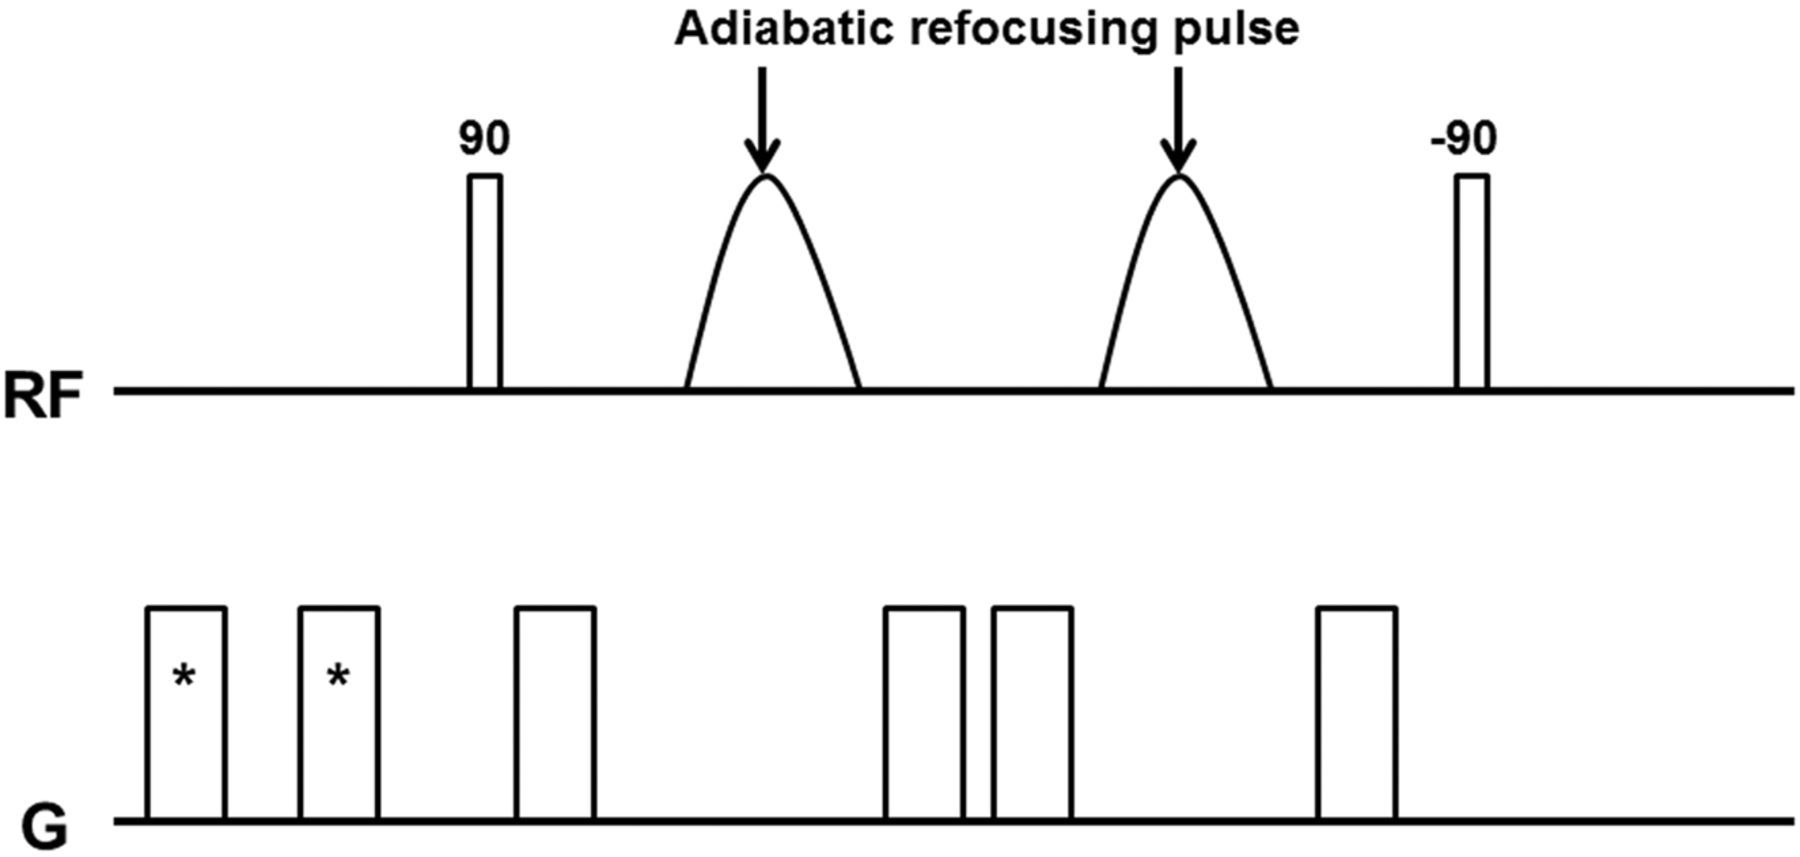
All participants underwent MR imaging with a 3T system (Achieva Quasar Dual; Philips, Best, the Netherlands) with an 8-channel head coil. Figure 1 shows a diagram of our DSDE preparation sequence. The DSDE-TFE has 2 distinct components: first, the DSDE preparation and, second, the segmented 3D TFE data acquisition.11 The DSDE preparation is an extension of the motion-sensitized driven-equilibrium preparation, which has been used for black-blood imaging of large vessels.12,13 Motion-sensitized driven-equilibrium preparation has also been applied to brain imaging for the detection of metastatic tumors.14 Compared with motion-sensitized driven-equilibrium preparation, the DSDE-prepared sequence has stronger motion-sensitizing gradients, which enable diffusion-weighting in the anteroposterior direction. DSDE preparation was originally developed to reduce distortion in the imaging of peripheral nerves,11 and it was then optimized for skull base imaging in the present study. Adiabatic refocusing pulses and additional gradients inserted in front of the sequence were used to reduce B0 and B1 inhomogeneity and eddy current effects.11,15 Data acquisition by using TFE was performed immediately after the DSDE preparation. To eliminate T1 effects in the acquired signal by TFE, we used a phase-cycling scheme.16,17

Diagram of DSDE sequences used in this study. Asterisk indicates prepulse gradients for eddy current compensation.
The imaging parameters for the DSDE-TFE were as follows: TR/TE = 6.2/3 ms, flip angle = 10°, echo-train length = 75, b factors = 0, 500 s/mm2, sensitivity-encoding factor = 2, FOV = 240 mm, voxel size = 1.5 × 1.5 × 1.5 mm3, number of signal averages = 2, and acquisition time = 5 minutes 22 seconds. The imaging parameters for the EP-DWI were as follows: TR/TE = 3000/62 ms, b factors = 0, 500 s/mm2 (anteroposterior direction), sensitivity encoding factor = 2.5, FOV = 240 mm, matrix = 160 × 128, section thickness/gap = 3/0 mm, voxel size = 1.5 × 1.9 × 3 mm3, number of signal averages = 2, and acquisition time = 48 seconds. Because coverage of DSDE-TFE was limited by 36-mm thickness, acquisition of EP-DWI coincided with that of DSDE-TFE. Sagittal T1-weighted images were also obtained to separate the anterior and the posterior lobes of the pituitary gland. The imaging parameters for T1-weighted images were as follows: TR/TE = 450/13 ms, FOV = 150 mm, matrix = 224 × 180, section thickness/gap = 3/0 mm, voxel size = 0.7 × 0.8 × 3 mm3, number of signal averages = 2, and acquisition time = 2 minutes 44 seconds.
Analysis
Validation Study.
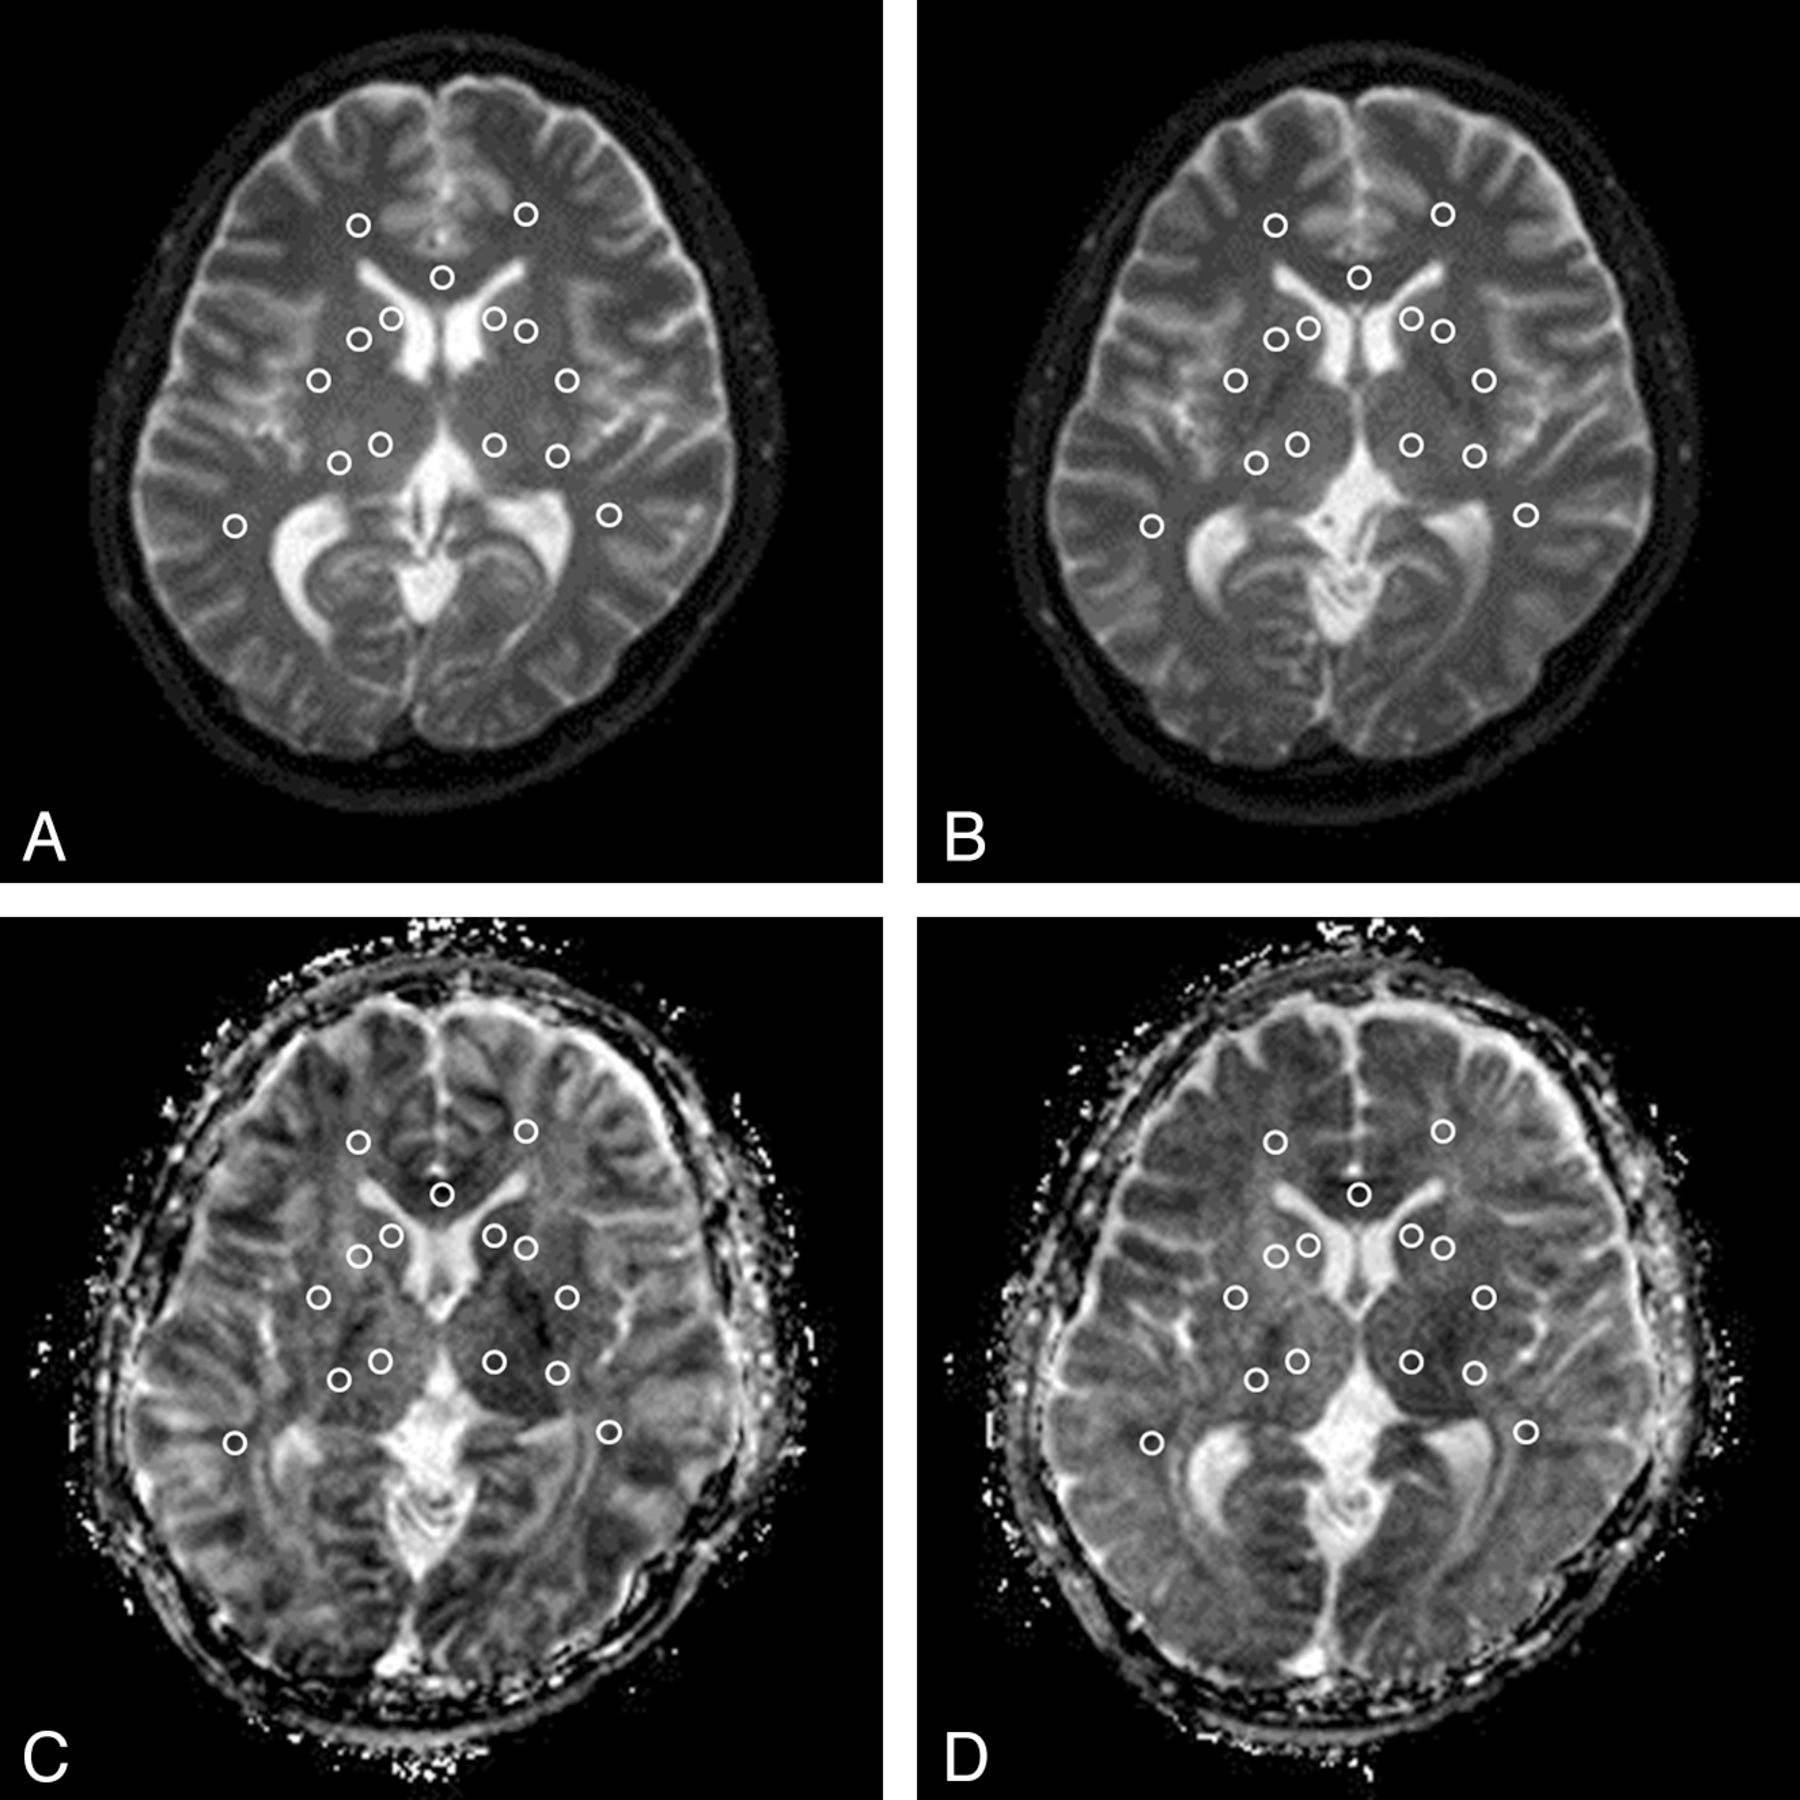
The DSDE-TFE dataset was originally imaged in the axial plane. The data were reformatted to the axial plane (3-mm-thick). Both the DSDE-TFE and EP-DWI datasets were saved in the DICOM format. ADC maps were calculated on a personal computer by using ImageJ, Version 1.44p, for Windows software (National Institutes of Health, Bethesda, Maryland). Fifteen ROIs were placed on b0 images and then were copied to ADC maps. They were located at the bilateral caudate head, putamen, thalamus, anterior limb of the internal capsule, posterior limb of the internal capsule, frontal white matter, temporal white matter, and the genu of the corpus callosum by a neuroradiologist (A.H., with 15 years' experience in neuroradiology, Fig 2). Statistical analysis was performed by the same author by using the statistical software JMP, Version 9.0.2 (SAS Institute, Cary, North Carolina). The Pearson correlation coefficient was used for analysis. P values < .05 were considered significant.

ROI placement. Fifteen ROIs were placed at the bilateral caudate head, putamen, thalamus, anterior limb of the internal capsule, posterior limb of the internal capsule, frontal white matter, temporal white matter, and the genu of the corpus callosum on a b0 map (DSDE-TFE, A; EP-DWI, B) and then were copied to the ADC map derived from DSDE-TFE (C) and EP-DWI (D).
ADC Measurement in the Pituitary Gland.
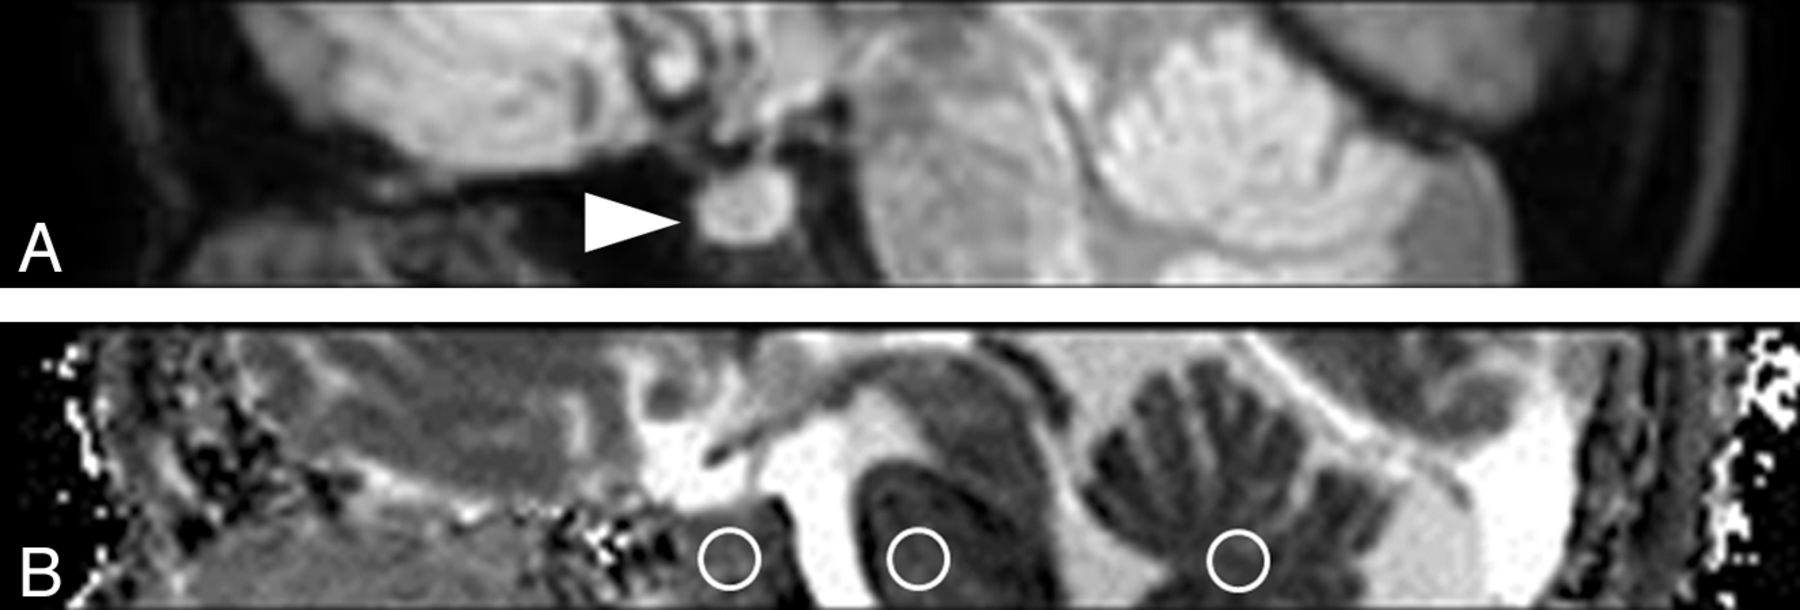
The DSDE-TFE data were reformatted to the sagittal plane (3-mm-thick). Both the DSDE-TFE and EP-DWI datasets were saved in the DICOM format. ADC maps were calculated in the same manner. Three ROIs were placed at the anterior lobe of the pituitary gland, pons, and vermis on the midsaggital plane by the same rater (Fig 3). The posterior lobe of the pituitary gland was excluded by sagittal T1-weighted images for comparison. The statistical analysis was performed with a paired t test in the same manner as that used for the validation study above. P values < .05 were considered significant.

Sagittal reformatted DWI (A) and ADC map derived from DSDE-TFE (B). The normal anterior lobe of the pituitary gland is clearly visualized without image degradation (arrowhead, A). Three ROIs are placed at the anterior lobe of the pituitary gland, pons, and vermis (circles, B).
Results
Validation Study
The validation study included 5 healthy volunteers (5 men; age range, 30-46 years; median age, 36 years).
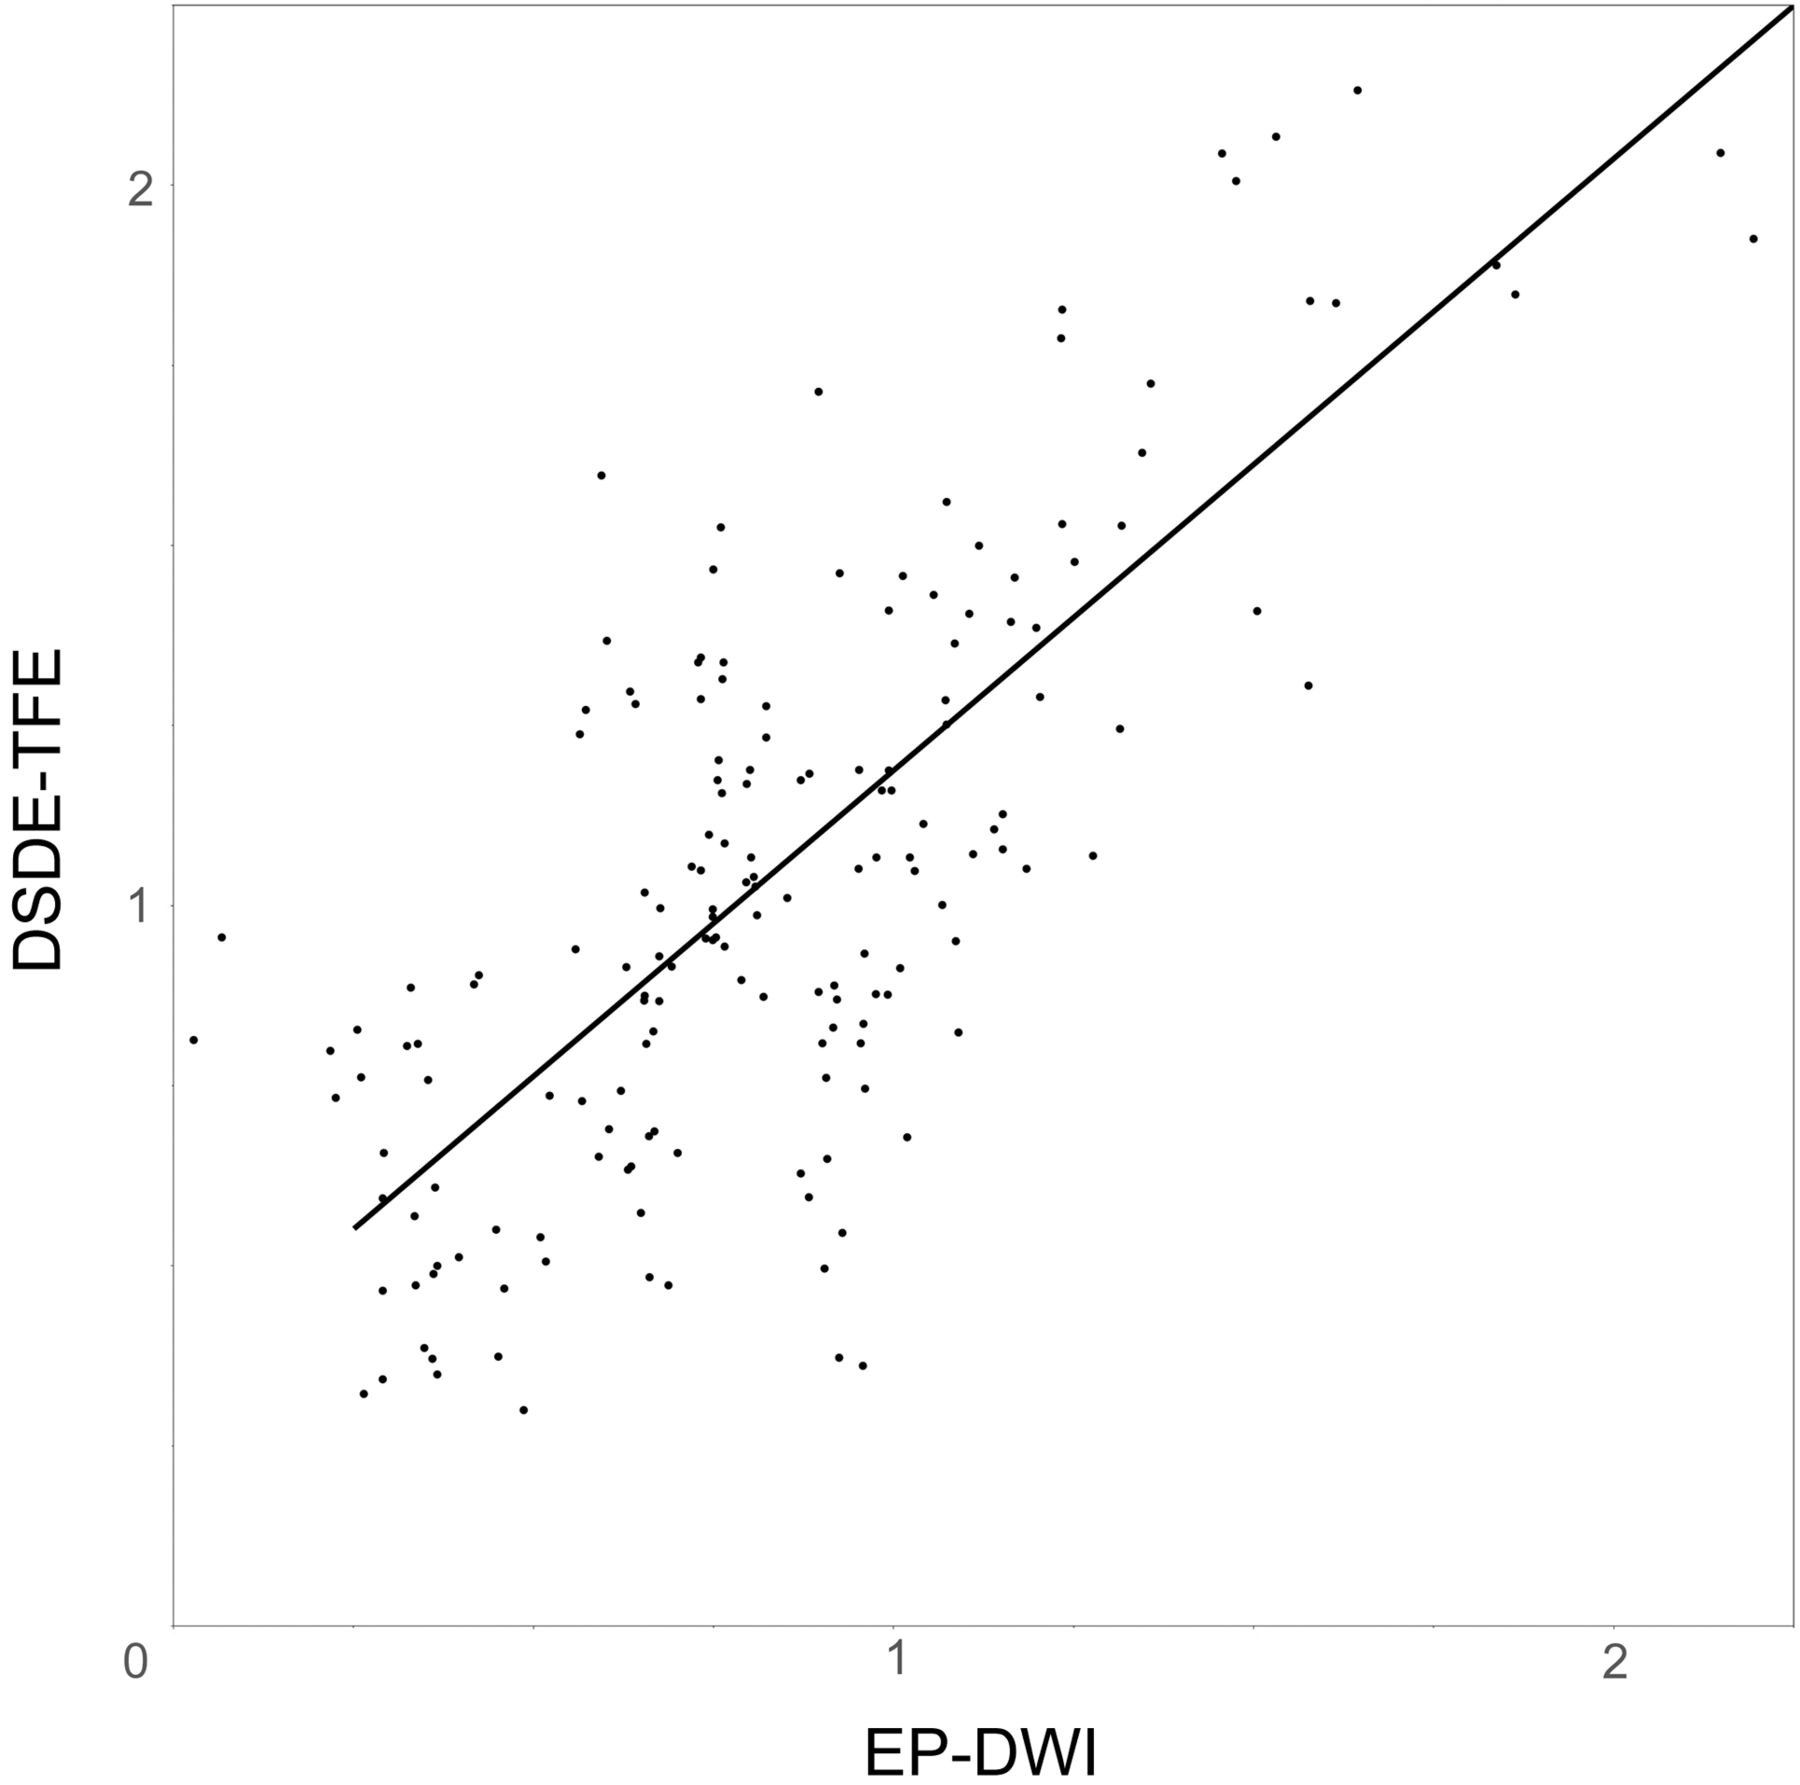
On DSDE-TFE, the ADCs of the 15 ROIs ranged from 0.32 × 10⁻³ mm2/s to 2.13 × 10⁻³ mm2/s (mean, 1.07 ± 0.41 × 10⁻³ mm2/s). On EP-DWI, the ADCs ranged from 0.26 × 10⁻³ mm2/s to 2.19 × 10⁻³ mm2/s (mean, 0.86 ± 0.38 × 10⁻³ mm2/s). There was a significant correlation in the ADC measurement between DSDE-TFE and EP-DWI (r = 0.79, P < .0001; Fig 4).

Graph shows the relationship of ADC between DSDE-TFE and EP-DWI (×10−3 mm2/s). There is a significant correlation in ADC measurements between DSDE-TFE and EP-DWI (r = 0.79, P < .0001). ADCDSDE-TFE = ADCEP-DWI × 0.849 + 0.340.
ADC Measurement in the Pituitary Gland
ADC measurement in the pituitary gland included 10 healthy volunteers (6 men and 4 women; age range, 25–46 years; median age, 33 years).
DSDE-TFE provided images of the pituitary gland without distortion in all 10 subjects. The ADCs in the anterior lobe of the pituitary gland ranged from 1.16 × 10⁻³ mm2/s to 1.54 × 10⁻³ mm2/s. In the pons, the ADCs ranged from 0.68 × 10⁻³ mm2/s to 1.38 × 10⁻³ mm2/s, and in the vermis, the ADCs ranged from 0.63 × 10⁻³ mm2/s to 1.35 × 10⁻³ mm2/s. The ADCs in the anterior lobe of the pituitary gland (mean, 1.37 ± 0.13 × 10⁻³ mm2/s) were significantly higher than those in the pons (1.01 ± 0.24 × 10⁻³ mm2/s) and vermis (0.89 ± 0.25 × 10⁻³ mm2/s, P < .01, Fig 5).

Graph of ADCs in the anterior lobe of the pituitary gland, pons, and vermis (×10−3 mm2/s). The ADCs in the anterior lobe of the pituitary gland (1.37 ± 0.13 × 10⁻³ mm2/s) are significantly higher than those in the pons (1.01 ± 0.24 × 10⁻³ mm2/s) and vermis (0.89 ± 0.25 × 10⁻³ mm2/s, P < .01).
Discussion
To our knowledge, this is the first report to evaluate the diffusivity of the normal pituitary gland. We revealed a strong correlation in ADC measurements between DSDE-TFE and EP-DWI (r = 0.79, P < .0001) in several brain structures in healthy subjects. The DSDE-TFE technique was originally reported as one of the nerve sheath imaging techniques.11 Obara et al11 reported a qualitative evaluation of DSDE-TFE, but there has been no quantitative evaluation. The present study is thus also the first to validate ADC calculations by using this technique.
We observed that the ADCs of brain structures obtained by using DSDE-TFE (1.07 ± 0.41 × 10⁻³ mm2/s) were higher than those obtained by using EP-DWI (0.86 ± 0.38 × 10⁻³ mm2/s). For DSDE-TFE, adiabatic refocusing pulses and additional gradients inserted in front of the sequence were used to reduce B0 and B1 inhomogeneity and eddy current effects.11,15 However, further development is required to achieve less variation in measurement.
In this study, DSDE-TFE provided visualization of the pituitary gland without distortion of the images in all 7 subjects. Due to the severe susceptibility artifacts, it is impossible to evaluate the normal pituitary gland with EP-DWI. Therefore, previous studies by using EP-DWI were mainly limited to pituitary macroadenoma, apoplexy, abscess, or other parasellar lesions.3⇓⇓⇓–7 Other researchers applied non-EP-DWI such as single-shot fast spin-echo,8 line scan,9 and periodically rotated overlapping parallel lines with enhanced reconstruction10 DWI for sellar and parasellar lesions to overcome image degradation. In the present study, we used DSDE-TFE, which enabled us to obtain a 3D dataset and high spatial resolution (1.5 × 1.5 × 1.5 mm3). We may apply this technique to other skull base and head and neck structures in the future.
We observed that the ADCs in the anterior lobe of the pituitary gland (1.37 ± 0.13 × 10⁻³ mm2/s) were significantly higher than those in the pons (1.01 ± 0.24 × 10⁻³ mm2/s) and vermis (0.89 ± 0.25 × 10⁻³ mm2/s). Even in the previous reports that used non-EP-DWI, there was no mention of the diffusivity of the normal pituitary gland. We suspect that the lack of myelination and hypervascularity in the normal pituitary gland may contribute to the increased diffusivity compared with the pons and vermis.18,19 Further studies are needed to investigate this possibility.
Limitations of this study included the low b-values and 1 direction of the diffusion-weighting. We were able to obtain DWI with DSDE-TFE at b-values higher than 500 s/mm2, but it was sometimes difficult to obtain ADC maps, probably due to insufficient eddy current compensations. We are trying to apply DWI in >3 directions, but further technical developments are required. We also tried to evaluate the diffusivity of the posterior lobe, but it was difficult, despite the high spatial resolution of our images (1.5 × 1.5 × 1.5 mm3). Limited coverage (36 mm) and the longer acquisition time (5 minutes 22 seconds) of DSDE-TFE (36 mm) compared with EP-DWI are other disadvantages. We could not compare the pituitary gland, vermis, and pons on the sagittal plane consistently. The absence of a criterion standard for pituitary ADC is also a limitation. We did not have a normal pituitary gland on postmortem examination or in surgical specimens in this study. Histopathologic correlation is required in the future.
Conclusions
By using DSDE-TFE, it was possible to obtain ADC maps with high resolution and fewer susceptibility artifacts compared with EP-DWI. The 3D DSDE-TFE technique enabled us to evaluate the diffusivity in the normal pituitary gland, which was higher than that in the pons and vermis.
Footnotes
Disclosures: Koji Yamashita—RELATED: Grant: Grants-in-Aid for Scientific Research, Comments: Grant-in-Aid for Young Scientists (JSPS KAKENHI grant number 23791432).
Indicates open access to non-subscribers at www.ajnr.org
REFERENCES
- 1.
- 2.
- 3.
- 4.
- 5.
- 6.
- 7.
- 8.
- 9.
- 10.
- 11.
- 12.
- 13.
- 14.
- 15.
- 16.
- 17.
- 18.
- 19.
- Received February 8, 2012.
- Accepted after revision March 26, 2012.
- © 2014 by American Journal of Neuroradiology