Abstract
BACKGROUND AND PURPOSE: The extensive application of advanced MR imaging techniques has undoubtedly improved our knowledge of the pathophysiology of amyotrophic lateral sclerosis. Nevertheless, the precise extent of neurodegeneration throughout the central nervous system is not fully understood. In the present study, we assessed the spatial distribution of cortical damage in amyotrophic lateral sclerosis by using a cortical thickness measurement approach.
MATERIALS AND METHODS: Surface-based morphometry was performed on 20 patients with amyotrophic lateral sclerosis and 18 age- and sex-matched healthy control participants. Clinical scores of disability and disease progression were correlated with measures of cortical thickness.
RESULTS: The patients with amyotrophic lateral sclerosis showed a significant cortical thinning in multiple motor and extramotor cortical areas when compared with healthy control participants. Gray matter loss was significantly related to disease disability in the left lateral orbitofrontal cortex (P = .04), to disease duration in the right premotor cortex (P = .007), and to disease progression rate in the left parahippocampal cortex (P = .03).
CONCLUSIONS: Cortical thinning of the motor cortex might reflect upper motor neuron impairment, whereas the extramotor involvement seems to be related to disease disability, progression, and duration. The cortical pattern of neurodegeneration depicted resembles what has already been described in frontotemporal dementia, thereby providing further structural evidence of a continuum between amyotrophic lateral sclerosis and frontotemporal dementia.
ABBREVIATIONS:
- ALS
- amyotrophic lateral sclerosis
- ALSFRS-R
- ALS Functional Rating Scale-Revised
- CTh
- cortical thickness
- FrSBe
- Frontal Systems Behavior Scale
- FTD
- frontotemporal dementia
- HCs
- healthy control participants
- PMC
- primary motor cortex
- SBM
- surface-based morphometry
- TDP-43
- transactivating responsive sequence DNA-binding protein 43-kDa
- UMN
- upper motor neuron
- VBM
- voxel-based morphometry
Despite the common view of amyotrophic lateral sclerosis (ALS) as a neurodegenerative disease that exclusively affects motor functions, convincing evidence supports the notion that ALS is a multisystem disease also affecting behavior, language, and cognition.1⇓⇓⇓⇓–6 Indeed, among patients with ALS, as many as 15% meet criteria for frontotemporal dementia (FTD), whereas up to 35% show a mild to moderate cognitive impairment.5,7 From the histochemical and genetic points of view, recent findings suggest that ALS may belong to a broader clinicopathologic spectrum, known as transactivating responsive sequence DNA-binding protein 43-kDa (TDP-43) proteinopathy, which also includes FTD.8⇓–10
Structural and functional MR imaging studies have corroborated the theory of a relevant frontotemporal impairment in ALS with approximately half of the patients displaying at least mild abnormalities.11⇓⇓⇓⇓⇓⇓⇓⇓–20
The development of advanced automated imaging analysis techniques, on the basis of construction of statistical parametric maps, has allowed detailed anatomic studies of brain morphometry. Voxel-based morphometry (VBM) allows a fully automated whole-brain measurement of regional brain atrophy by voxelwise comparison of GM and WM volumes between groups of participants.21 The most consistent finding of VBM studies in ALS involves GM atrophy in several regions of the frontal (ie, anterior cingulate, middle and inferior frontal gyrus) and temporal lobes (ie, temporal poles, superior temporal gyrus, temporal isthmus, hippocampus),11⇓–13,16,17,19 reporting significant correlations between GM atrophy and cognitive dysfunction mainly in patients with an ALS-plus syndrome (ie, ALS with cognitive and behavioral symptoms).20 However, the lack of agreement on cortical atrophy distribution22 has prompted the application of other advanced MR imaging approaches. Surface-based morphometry (SBM), allowing cortical thickness (CTh) measurements,23 has shown several advantages compared with VBM in reconstructing the cortical surface. This technique, indeed, allows decomposition of cortical volume into both thickness and surface area, respecting the cortical topology and enhancing reliability and sensitivity.24 Therefore, mainly to identify a more sensitive marker of upper motor neuron (UMN) degeneration, CTh analysis has been applied to the study of ALS, revealing cortical thinning not only in the precentral gyrus,18,25⇓–27 but also within the numerous frontotemporal, parietal, and occipital areas.26⇓–28 It is noteworthy that, so far, the correlation between regional cortical thinning and clinical features has not been fully assessed. On this background, we aimed to further investigate—without any a priori hypothesis—the pattern of both motor and extramotor cortical involvement in patients with sporadic ALS and to explore the relationship between MR imaging data and clinical and neuropsychological features.
Materials and Methods
Study Population
We investigated 20 patients with ALS (10 women and 10 men), who fulfilled the diagnostic criteria for probable or definite ALS, according to the revised El Escorial Criteria of the World Federation of Neurology. (See Table 1 for clinical and demographic data.) 29
Demographics and clinical features
The site of disease onset was the upper limbs in 10 patients and lower limbs in the remaining patients. All had a “classic” phenotype including bulbar signs in 9 patients. We excluded from the analysis patients with dominant lower motor neuron impairment (ie, progressive muscular atrophy, flail leg syndrome, pseudopolyneuritic form), progressive bulbar palsy, primary lateral sclerosis, postpoliomyelitis ALS, and motor neuron disease with multisystem involvement (ie, ALS dementia). The mean disease duration between the first symptom and study visit was 2.6 years. However, we included 5 patients with a survival time of longer than 4 years, 2 of whom were receiving artificial respiratory support (mean duration of noninvasive ventilation, 68 months). None of the patients needed percutaneous endoscopic gastrostomy, and none had other neurologic diseases. All patients were receiving treatment with riluzole (50 mg twice daily).
The average functional status, as measured by the ALS Functional Rating Scale-Revised (ALSFRS-R),30 ranged from 18–47. The disease progression rate, as measured by the ratio 48−ALSFRS-R/months of disease duration,31 ranged from 0.03–2.5. The quantitative assessment of clinical UMN involvement was based on a scale used in previous ALS neuroimaging studies,17,32 which evaluates the number of pathologic reflexes, elicited from 15 body sites: glabellum, orbicularis oris, masseter (jaw jerk), biceps, triceps and finger jerks bilaterally, and knee, ankle, and Babinski responses bilaterally. In our population this score ranged from 1–14.
No subjects had familial ALS or tested positive for the most common mutations related to ALS (ie, superoxide dismutase 1 or SOD1, transactive response DNA-binding protein or TARDBP, fused in sarcoma/translocated in liposarcoma or FUS/TLS and C9ORF72).
All patients with ALS underwent a brief neuropsychological assessment, including the Mini-Mental State Examination33 and phonemic and semantic fluency tasks,33,34 which showed normal cognitive performances (cutoff values were 24, 17.35, and 7.25, and mean values were 28.5 ± 1.7, 26.8 ± 9, and 15 ± 4.3, respectively, for the Mini-Mental State Examination and phonemic and semantic fluency tasks). The Frontal Systems Behavior (FrSBe) scale evaluation,35 a questionnaire that measures apathy, disinhibition, and executive dysfunction and quantifies changes with time by comparing baseline (retrospective) and current assessments of behavior in a standardized T score (T > 65 is defined as impaired behavior and executive functions), was also administered to our patients and their caregivers. In our population, the mean total T score was 110.8 ± 21.7, derived from the caregiver and referring to the present time; the T score was > 65 in 19 of 20 patients.
Eighteen age- and sex-matched healthy control participants (HCs) with no history of neurologic or psychiatric diseases and with a normal neuropsychological evaluation were enrolled in the study.
Informed consent was obtained from all participants before study entry, according to the Declaration of Helsinki. The study was approved by the ethical committee of the Second University of Naples.
3T MR Imaging
Images were obtained on a 3T HDx scanner (GE Healthcare, Milwaukee, Wisconsin) equipped with an 8 channel-coil. The following sequences were acquired: 2D axial FSE double-echo proton density/T2; 2D axial T2-FLAIR; 3D T1-weighted sagittal images (GE sequence IR-FSPGR: TR, 6.988 ms; TI, 650 ms; TE, 3.9 ms; flip angle, 10°; voxel size, 1 × 1 × 1.2 mm3).
Measurements of Brain Cortical Thickness
FreeSurfer software version 4.5 (http://surfer.nmr.mgh.harvard.edu) running on a 64-bit Linux CentOS-4 (http://www.centos.org) was used to process anatomic 3D-T1 sagittal images and to measure whole-brain CTh.
In brief, after registration to the Talairach space and intensity normalization, the process involves automatic skull stripping by use of a hybrid method combining watershed algorithms and deformable surface models. Then, the WM/GM boundary was tessellated, and the surface was deformed following GM/CSF intensity gradients to optimally place WM/GM and GM/CSF borders. The results of these segmentations were inspected visually and, if needed, edited manually by adding control points. An automatic reconstruction of the cortex was produced and CTh estimated by computing the average shortest distance between the WM boundary and the GM/CSF surface. Surface maps were generated following registration of all participants' cortical reconstructions to a common average surface. Finally, surface maps were smoothed by use of default kernel of 10 mm.
The statistical parametric analysis was performed by the built-in Qdec module implemented in FreeSurfer, by use of a general linear model. Age and sex were used as covariates. Maps showing significant group differences between patients with ALS and HCs were generated by thresholding the images of t statistics at a .05 significance level, corrected for a false discovery rate.
A region-of-interest approach, by use of areas where significant CTh differences emerged from the between-group analysis, was used for the correlation analysis.
Each specific area (coming from the between-group analysis) was then labeled and projected into the original space of each participant, to measure the average CTh (for each area, in each participant). These measures were then transposed in a spreadsheet to run the correlation analysis.
Regional CTh data were corrected for total brain volume without finding any significant difference. A 2-tail analysis was used. Pearson correlation coefficients were calculated to evaluate the relationship between the clinical variables (UMN score, ALSFRS-R, FrSBe scale, disease duration, and disease progression rate) and the average CTh values within the motor and extramotor areas found to be thinner in patients compared with HCs. P values < .05 were considered statistically significant after correction for multiple comparisons with the Bonferroni method.
Results
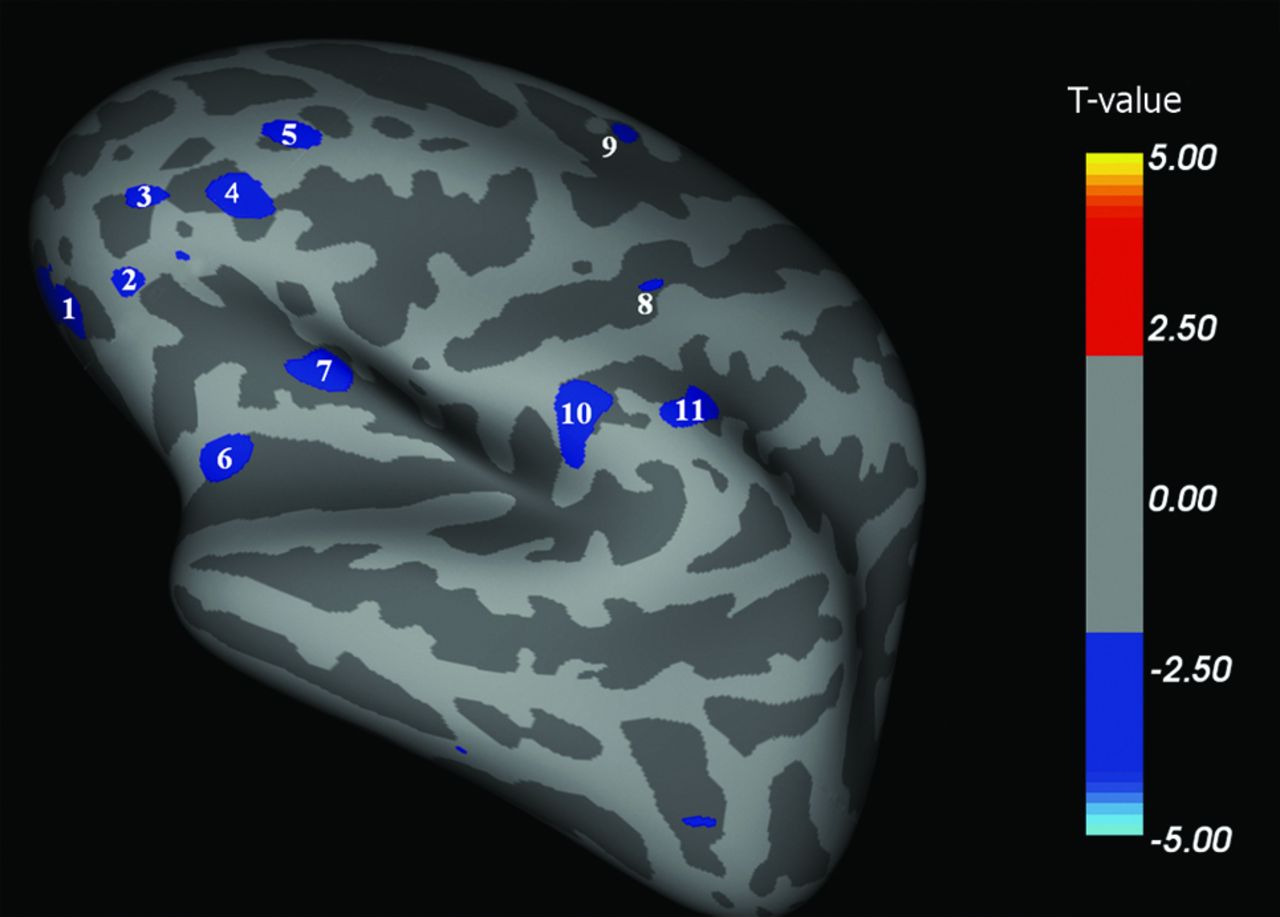
We found multiple brain areas of significant cortical thinning in patients with ALS when compared with HCs (Fig 1⇓⇓–4 and, for details, Table 2). These cortical regions localized in the bilateral frontal and prefrontal cortex (Fig 1, areas 1–4; Fig 2, areas 1–11; Fig 3, areas 1–4; Fig 4, areas 1–4), including the primary motor cortex (PMC); the bilateral temporal cortex (Fig 1, area 5; Fig 3, areas 5, 8; Fig 4, area 8); and the bilateral parieto-occipital cortex (Fig 3, areas 6, 7; Fig 4, areas 5–7). Conversely, CTh was found to be increased in patients with ALS compared with HCs in few and scattered cortical areas localized in the right hemisphere (lateral and medial surface, Figs 1 and 3).

Right hemisphere, lateral surface. Areas showing a significant cortical thinning in patients with ALS (P < .05) are colored in blue. Areas 1–4 are localized in the frontal region. Area 5 is localized in the temporal region.
Spatial coordinates, extent, and average CTh of areas showing significant cortical thinning between patients with ALS and HCs

Left hemisphere, lateral surface. Areas showing a significant cortical thinning in patients with ALS (P < .05) are colored in blue. Areas 1–11 are localized in the frontal region. CTh in area 1 (orbitofrontal lateral cortex) correlated with disease disability (P = .04).

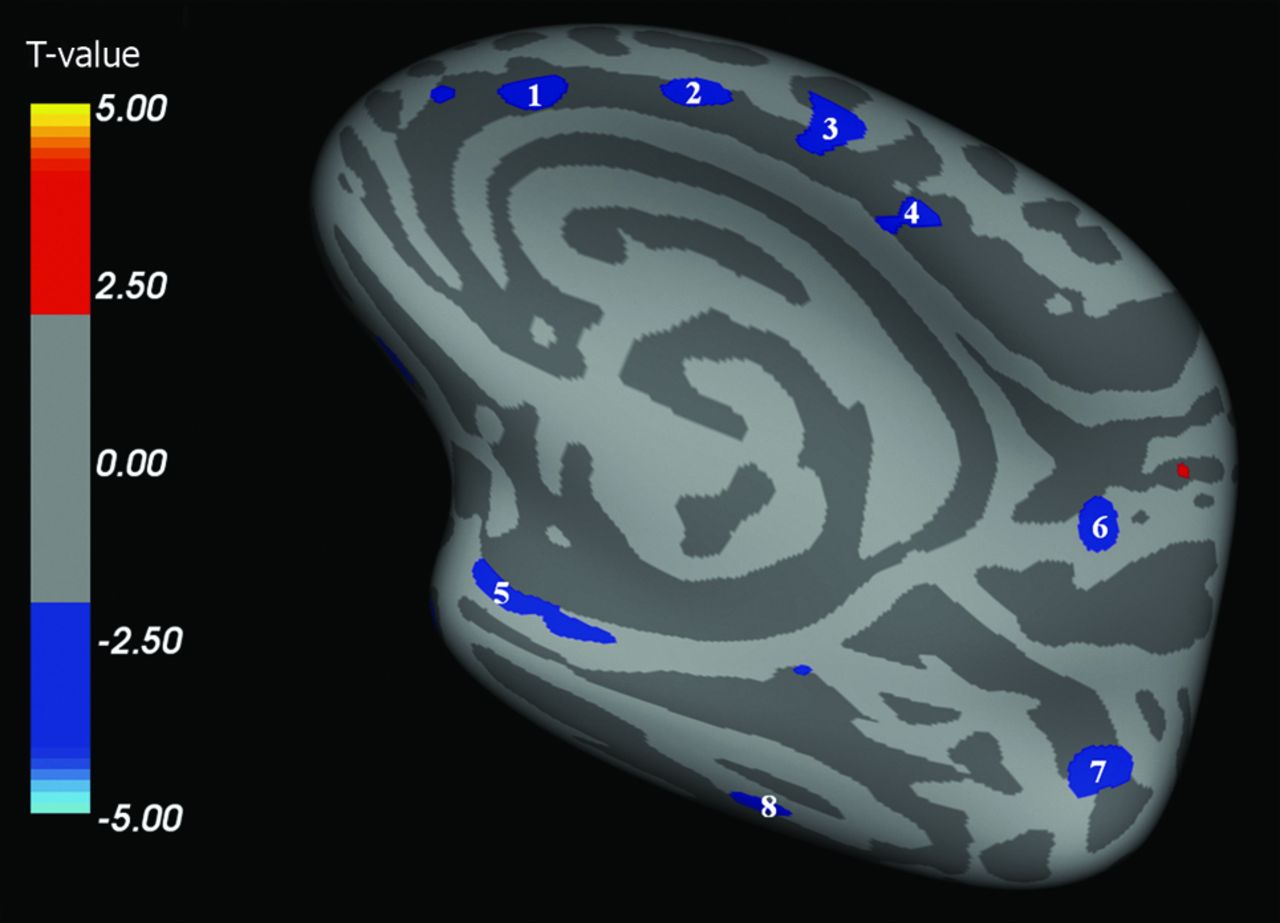
Right hemisphere, medial surface. Areas showing a significant cortical thinning in patients with ALS (P < .05) are colored in blue. Areas 1–4 are localized in the frontal region. Areas 5 and 8 are localized in the temporal region. Areas 6 and 7 are localized in the parietooccipital region. CTh in area 4 (premotor cortex) correlated with disease duration (P = .007).

Left hemisphere, medial surface. Areas showing a significant cortical thinning in patients with ALS (P < .05) are colored in blue. Areas 1–4 are localized in the frontal region. Areas 7 and 8 are localized in the temporal region. Areas 5 and 6 are localized in the parietooccipital region. CTh in area 8 (inferior temporal and parahippocampal cortex) correlated with the rate of disease progression (P = .0265).
Regarding correlations between CTh measurements and clinical characteristics of patients, we found that CTh of the left frontal lateral cortex (Fig 2, area 1, orbitofrontal lateral cortex) correlated with disease disability (P = .04) (ALSFRS-R); CTh of the right medial frontal cortex (Fig 3, area 4, premotor cortex) correlated with disease duration (P = .007); and CTh of the left medial temporal cortex (Fig 4, area 8, inferior temporal and parahippocampal cortex) correlated with the disease progression rate (P = .03) (48− ALSFRS-R/months of disease duration). No other correlations were found between CTh and other clinical and neuropsychological parameters (ie, UMN scores, FrSBe T-scores and subscores for apathy, disinhibition, and executive dysfunction).
Discussion
Cortical damage in ALS has been shown not to be limited to motor areas alone but to involve extramotor areas as well.6⇓⇓⇓–10 In vivo, independent of the structural neuroimaging approach used (VBM or SBM), the most commonly affected extramotor cortical areas were identified in the frontal and temporal lobes.11⇓⇓⇓⇓⇓⇓⇓⇓–20,26⇓–28 However, significant correlations between cortical involvement and disease progression18,26,27 or cognitive impairment2,14,15,20,28 were reported only in a few studies.
Our findings resemble previous CTh results showing a significant PMC thinning in patients with ALS when compared with HCs.18,25⇓–27 The cortical thinning of this region appears to be a radiologic correlate of Betz cells shrinkage and loss with reactive gliosis reported by neuropathologic studies.36⇓–38
Regarding morphometric results of the extent of cortical impairment in patients with ALS, VBM studies showed GM changes in several regions of the frontal and temporal lobes,11,13⇓⇓–16,19,20 whereas SBM studies indicated a more consistent involvement of the PMC.18,25⇓–27 In this respect, the mildly divergent results obtained by VBM and SBM in analyzing the topography of GM atrophy in ALS could be the result of methodologic differences between the 2 techniques, intrinsic complexity of the pathologic process,37 and clinical heterogeneity of the studied populations. It is important to note that VBM explores the between-group differences in regional GM concentration, which can depend on both CTh and amounts of cortical folding.21 Conversely, SBM explores the actual cortical thinning, avoiding errors attributable to the complex brain cortical folding.23 Therefore, compared with SBM, VBM measures have been found to have a lower signal-to-noise ratio with a lower sensitivity to cortical atrophy localized in brain sulci.39 Against this background, we designed our study, believing that SBM could be a valuable tool for investigating in vivo the cortical damage in ALS. However, although our present study does not aim to compare SBM and VBM methods when applied to ALS, we have run a VBM analysis with the SPM8 software package (Wellcome Department of Imaging Neuroscience, London, UK) of the same group of participants analyzed by SBM. In this analysis, we have observed that the main difference between the 2 approaches was in the extent of frontal, temporal, and parietal damage, more widely depicted by CTh measurements (data not shown).
In our present study, PMC thinning did not show any significant correlation with clinical scores of UMN impairment, disability, and disease progression. This finding is in agreement with that of Roccatagliata et al,25 who reported a similar lack of correlations. This negative result might reflect the small number of studied patients on one hand but, on the other, the effect of a likely “ceiling phenomenon” that hinders the chance to explore a correlation with clinical scores and to assess a progressive cortical thinning of primary motor areas in longitudinal measures.26 It is probable that reactive gliosis in the deep layers of the motor cortex, described in most neuropathologic studies,37,38,40 may occur to a degree enough to “mask” tissue loss especially in the later stages of disease, as observed in our population. Finally, it should also be considered that PMC degeneration seems to affect or reduce CTh even before the onset of clinical symptoms, supporting the hypothesis that ALS might start in the cerebral cortex.40 In fact, the previously reported observation that cortical hyperexcitability precedes the development of clinical symptoms in presymptomatic carriers of a SOD1 mutation41 allows us to hypothesize that early ALS abnormalities occur within the PMC, with a subsequent anterograde excitotoxicity (often referred to as “dying forward” degeneration). For the above-mentioned reason, PMC thinning might have the potential to be a marker for UMN involvement in the diagnostic phase and possibly in the preclinical phase, but it could have limited value in the later stages of ALS, when a significant neurodegenerative threshold has already been reached, as likely occurred in our population.
Another relevant limitation of the correlation analysis between CTh measures and UMN signs was the lack of clinical scores highly specific for the detection of corticomotor neuron degeneration in ALS. Indeed, it has been shown that prominent clinical disability may occur even in the absence of impairment of the pyramidal pathway, and vice versa.37,41
In addition to PMC, we detected a significant cortical thinning in multiple extramotor areas, particularly in the frontotemporal regions. These findings confirm previous neuroimaging studies in ALS,6,11,13⇓–15,19,20 where the spatial distribution of neurodegeneration closely resembled patterns identified in FTD variants.42 Furthermore, the widespread cortical damage found in our ALS population overlaps ex vivo findings related to the expression of a TDP-43 pathologic feature. However, although our finding of a distributed involvement of the frontal, temporal, parietal, and occipital lobes is in keeping with the known spectrum of cognitive3,5 and pathologic10 overlap between ALS and FTD, none of our participants had overt dementia. Here we should acknowledge a limit of our present study, in which extensive neuropsychological testing (ie, including assessment of executive functioning, language, and memory) was not acquired given that ALS-related physical symptoms could have affected the evaluation.
Our correlation analysis, in agreement with some previous results,26,27 showed that cortical thinning in temporal regions (inferior temporal and parahippocampal cortices) was significantly related to a faster disease course. Moreover, we described for the first time significant correlations between cortical thinning in the right medial frontal area (premotor cortex) and disease duration, and in the left lateral frontal area (orbitofrontal lateral cortex) and disability (ALSFRS-R).
If we take these results together, our data could suggest an increased vulnerability to neurodegeneration of both the frontal and temporal extramotor areas, depicting a pattern of cortical thinning similar to what was observed in the behavioral variant of frontotemporal dementia42 or in ALS-FTD43 and confirming that frontotemporal involvement is a consistent feature of ALS. Specifically, the above-mentioned correlation between inferior temporal and parahippocampal thinning and disease progression rate may recall the recent finding of a widespread atrophy of the same temporal areas in patients with the behavioral variant of FTD.44 Moreover, the significant thinning of the orbitofrontal and premotor areas, which we found to correlate with ALSFRS-R and disease duration, may reflect a similar cortical degeneration pattern reported in both the behavioral variant of FTD and primary-progressive aphasia, in which atrophy of the orbitofrontal and premotor areas was found to correlate with the occurrence of severely disabling behavioral changes (ie, aberrant eating and motor behaviors).45⇓–47
It is remarkable that no correlations were found between cortical thinning of the frontotemporal areas and frontal impairment (evaluated by T-score and subscores of FrSBe scale). By contrast, previous studies have reported an association between regional volume loss in several frontotemporal areas and cognitive and behavioral symptoms in both ALS2,14,15,20 and the behavioral variant of FTD.45,48,49 However, we are only in apparent disagreement with previous VBM studies conducted in patients with ALS.2,14,15,20 In fact, the different methodologic approaches used, the heterogeneity of the populations studied, and the intrinsic limitation of the FrSBe scale (because it contains questions that may be influenced by disease-related somatic symptoms50) could explain such discordance. Moreover, the idea of specific structural changes in the individual frontotemporal areas underlying behavioral impairment in ALS is only partially accepted. Instead, it should be considered that although apathy is considered the most prominent behavioral feature in patients with ALS,2⇓–4,51 consistent neuroanatomic correlates are lacking.50,52,53
Finally, our results also showed areas of CTh in patients with ALS when compared with HCs. Such areas, albeit few and scattered, might speculatively suggest that compensatory mechanisms (associated with structural remodeling) might take place in the ALS cortex, as already observed in other neurologic and psychiatric diseases such as stroke,54 traumatic brain injury,55 and obsessive-compulsive disorder.56
Conclusions
Our present study supports the hypothesis that clinical disability in ALS is linked with both motor and extramotor cortical degeneration. Our data further support the potential role of extramotor frontal and temporal areas in influencing outcomes of ALS, suggesting that the more widespread the cortical damage, the more aggressive the disease. The pattern of cortical neurodegeneration described in our sample of patients with ALS, which covers many disease features especially in the advanced stages, provides further structural evidence of a continuum between ALS and FTD. However, the limited number of patients studied and the lack of a complete neuropsychological assessment might have partially hindered such an effort.
Longitudinal studies on groups of several ALS subtypes or phenotypes in the early stages of the disease are warranted to further characterize the spatial and temporal evolution of cortical damage, the correlations of MR imaging data with clinical and neuropsychological features, and the reliability of CTh as a biomarker of disease progression.
Footnotes
A.d'A. and A.G. contributed equally to this study.
Disclosures: Mario Cirillo—UNRELATED: Payment for Lectures (including service on speaker bureaus): Bayer Schering Pharma,* Comments: €1600. Gioacchino Tedeschi—UNRELATED: Grants/Grants Pending: Novartis,* Comments: Research fellowships (pending, €145,000). Payment for Lectures (including service on speaker bureaus): Novartis,* Merck Serono,* Biogen Idec*; Comments: €20,000; Travel/Accommodations/Meeting Expenses Unrelated to Activities Listed: Novartis,* Merck Serono,* Biogen Idec.* *Money paid to institution.
References
- 1.
- 2.
- 3.
- 4.
- 5.
- 6.
- 7.
- 8.
- 9.
- 10.
- 11.
- 12.
- 13.
- 14.
- 15.
- 16.
- 17.
- 18.
- 19.
- 20.
- 21.
- 22.
- 23.
- 24.
- 25.
- 26.
- 27.
- 28.
- 29.
- 30.
- 31.
- 32.
- 33.
- 34.
- 35.
- 36.
- 37.
- 38.
- 39.
- 40.
- 41.
- 42.
- 43.
- 44.
- 45.
- 46.
- 47.
- 48.
- 49.
- 50.
- 51.
- 52.
- 53.
- 54.
- 55.
- 56.
- Received March 28, 2013.
- Accepted after revision May 29, 2013.
- © 2014 by American Journal of Neuroradiology