Abstract
BACKGROUND AND PURPOSE: Increased glycine concentration in the brain is associated with altered metabolism in cancer and can be detected by using in vivo MR spectroscopy. This has been proposed as a marker for grade IV gliomas; however, little is known about the potential significance and frequency of in vivo glycine observation. The purpose of this study was to examine the rate of occurrence and spatial distribution of glycine observation with respect to other MR imaging parameters.
MATERIALS AND METHODS: Data from volumetric whole-brain MR spectroscopic imaging of 59 subjects with glioma were analyzed with glycine included in the spectral model. The associations of the signal amplitude and spatial distributions of glycine with findings from contrast-enhanced T1, perfusion, and diffusion MR imaging were then examined.
RESULTS: Glycine was detected in 24% of all studies, though with a wide range of signal amplitude and extent of the spatial distributions. While more commonly seen in grade IV tumors (42% of studies), relatively large concentrations were also detected in grade II and III gliomas. Coanalysis with other metabolites indicated a strong association with choline and that glycine was frequently seen to be overlapping with, and adjacent to, areas of high lactate concentration. Increased glycine was always associated with contrast enhancement and areas of increased cerebral blood flow, but without any clear association with other image parameters.
CONCLUSIONS: Detection of increased glycine in gliomas appears to identify a subgroup of tumors and areas of increased proliferation.
ABBREVIATIONS:
- GBM
- glioblastoma multiforme
- Gly
- glycine
- Lac
- lactate
- LL
- lipid+lactate
- MRSI
- magnetic resonance spectroscopic imaging
Glycine (Gly) is an inhibitory neurotransmitter and key amino acid that acts as an intermediary for synthesis of nucleotides and glutathione and is present in normal human brain at up to a 1-mM concentration.1 Increased concentrations of Gly have been detected in brain tumors by using in vivo and ex vivo MR spectroscopy,2⇓⇓⇓⇓⇓–8 and it has been proposed as a marker for grade IV glioma.6 However, in vivo studies have been limited, and the relative frequency of observation, distribution, association with other imaging measures, and potential value as a marker of glioma grade have not been demonstrated, to our knowledge.
The use of Gly as a tumor marker is limited by its relatively low concentration and the difficulty of in vivo detection of the singlet resonance at 3.55 ppm due to overlap with a myo-Inositol multiplet that appears as a prominent peak in the same spectral position. Several studies have demonstrated that improved discrimination can be obtained by using long-TE acquisitions that diminish the mIns signal contribution through the J-coupled evolution of the multiplet structure1⇓–3,5; by combining results from short- and long-TE values, one can discriminate the 2 signal contributions. The ratio of the combined mIns+Gly peak at two TE values has been proposed as a marker of malignancy for tumor grading.3,5 These previous studies have presented summary measures that indicate the potential for discrimination between patient groups, though with a considerable range of the measured mIns+Gly signals within each subject group. However, the frequency of increased Gly detection has been reported in only 1 study by Choi et al,4 in which the Gly concentration was increased in 8 of 12 subjects with glioblastoma multiforme (GBM), again with considerable variability between subjects.
While previous reports have indicated the potential for Gly measurement as a molecular marker to aid in tumor classification and grading, the significance of increased Gly, the relative frequency of in vivo MR spectroscopy observation, the reliability of the measurement, and the potential role as a diagnostic marker remain poorly understood. In this study, an analysis of volumetric 1H-MRSI of the brain in subjects with glioma was performed to examine the relative frequency of increased Gly in this subject group and to examine the distributions of increased Gly in relation to other imaging measures, including diffusion and perfusion MR imaging.
Materials and Methods
This retrospective analysis was applied to data acquired from a group of 59 subjects, 14–69 years of age, with histologically verified gliomas with World Health Organization classifications of grade II (20 subjects), III (15 subjects), or IV (24 subjects) before treatment. Subjects underwent MR imaging at 3T (Signa HDxt; GE Healthcare, Milwaukee, Wisconsin), which included a whole-brain MRSI, DTI, dynamic contrast-enhanced perfusion measurement, T2-weighted MR imaging, and pre- and postcontrast T1-weighted MR imaging, for a total study time of 50 minutes. Details of the subject selection and imaging methods have been previously reported9 and therefore will be described only briefly.
The MRSI acquisition used a volumetric echo-planar acquisition covering the cerebrum with an effective voxel volume of approximately 1 mL. The sequence used spin-echo excitation with TE = 70 ms and inversion-nulling with TI = 198 ms to suppress subcutaneous lipid and macromolecular signal contributions. At this TE value, the signal from mIns at 3.55 ppm is significantly reduced due to J-coupling evolution, thereby improving spectral analysis of Gly, as has been demonstrated at different field strengths in previous studies.7,10 The improved spectral discrimination is illustrated in Fig 1A by using spectral simulation7 with equal concentrations of Gly and mIns at 3T for a line width of 7 Hz. The signal from phosphocholine is also shown as a reference. In Fig 1B, the signal integral of the real part of the mIns signal for an 11-Hz region centered at the position of the Gly resonance is shown. It can be seen that at this TE value, the mIns signal contribution at 3.55 ppm is considerably reduced, thereby improving detection of Gly by using a resonance defined at this position. The mIns spectral pattern is also quite distinct and can be visually discriminated from that of Gly.

A, Simulation of the spectrum from mIns, Gly, and phosphocholine for spin-echo observation at TE = 70 ms and 3T. B, Signal integral of mIns over an 11-Hz region centered at the position of the Gly resonance at 3.55 ppm.
MRSI processing was performed by using the MIDAS package (http://mrir.med.miami.edu:8000/midas),11,12 which included automated spectral analysis for NAA, total creatine (creatine and phosphocreatine), total choline (glycerophosphocholine, phosphocholine, and free choline), Gly, and lactate (Lac). With this signal model, there remains a possible signal contribution from mIns to the fitting of the Gly singlet resonance; however, for all analyses, a visual inspection of the spectra was used to test for the presence of mIns, which could be distinguished by the positive and negative peak combination at 3.66 and 3.5 ppm. Similarly, although the lipid inversion-nulling preparation pulse also reduces any mobile lipid signal from tumors, some contribution to the Lac signal fitting cannot be excluded, and this result is, therefore, referred to as lipid+lactate (LL). The metabolite maps were signal normalized by using tissue water, which was obtained as a second signal-intensity acquisition interleaved with the metabolite signal-intensity acquisition.
To improve the detection of small Gly signal contributions, we performed the MRSI spectral analysis by using a 2-stage approach similar to that proposed by Zhang et al.13 The MRSI data were first analyzed following application of spatial smoothing by using convolution by a spheroidal kernel of 5 × 5 × 3 diameter voxels, equivalent to 4.2 mL. The resultant signal amplitudes from this fit were then used as initial values for analysis of the original MRSI data following correction for phase, B0, and baseline variations. Metabolite images from both analyses results were available for the subsequent analyses.
DTI data were acquired by using a single-shot echo-planar sequence, with TR = 10 seconds, TE = 100 ms, 46 sections of 3-mm thickness, FOV = 240 mm, image matrix = 128 × 128, diffusion-weighting b factor of 1000 s/mm2 applied in 12 directions in addition to the b=0 s/mm2 measurement, for an acquisition time of 2 minutes 34 seconds. Data were processed by using in-house-developed software to compute the mean diffusivity and fractional anisotropy for each voxel.
Dynamic contrast-enhanced MR imaging was performed by using a 3D spoiled gradient-recalled echo sequence (TR/TE/flip angle = 5.0 ms/2.1 ms/10°; section thickness = 6 mm), with 32 time points for 12 sections spanning the gadopentate dimeglumine–bis-methylamide (Omniscan; Nycomed Amersham, Oslo, Norway) administration (5 mL/s and 0.2 mmol/kg body weight). Total acquisition time was 10 minutes. Quantitative analysis of the concentration-time curve was performed to calculate the CBF and a corrected CBV map, which removed the contrast agent leakage effect due to the disrupted BBB.14
The tumor and surrounding edema were manually outlined by using the coregistered T1- and T2-weighted MRI to create a mask that was identified as the gross tumor volume. This was then resampled to correspond to the MRSI resolution and spatial response function. The resultant mask and all metabolites, DTI and dynamic contrast-enhanced maps, the T2-weighted MR imaging, and the postcontrast T1 MR imaging were then spatially transformed into a standard reference space at 2-mm isotropic resolution.
Two types of data analysis were performed to examine associations between the relative Gly concentrations and values from the other image measures. First, data points for all image types were obtained from voxels within the region defined by the gross tumor volume mask and Pearson correlation coefficients determined between Gly and all other image measures. In consideration of the interpolation applied for spatial normalization of the metabolite images, only every third voxel (6-mm spacing) was taken, to limit the number of data points. Voxels were also excluded if the spectral fitting reported a line width of greater than 12 Hz. The second type of analysis was to qualitatively view the relative spatial distributions of increased Gly values relative to features in the other metabolite images and MRI. For those studies in which Gly concentrations were sufficiently visible above background levels, a contour was drawn to indicate the Gly distribution that was then superimposed on other images of interest, with care taken to maintain registration of the tumor volume relative to the edge of the brain. To estimate Gly concentrations, we scaled the Gly integral from the spectral fitting by the corresponding value for total creatine in contralateral white matter, assuming a total creatine concentration of 8 mM.4 Where possible, mean values were obtained over 6–10 contiguous voxels in the highest amplitude region of the Gly image and from a similar-sized region in contralateral white matter.
Results
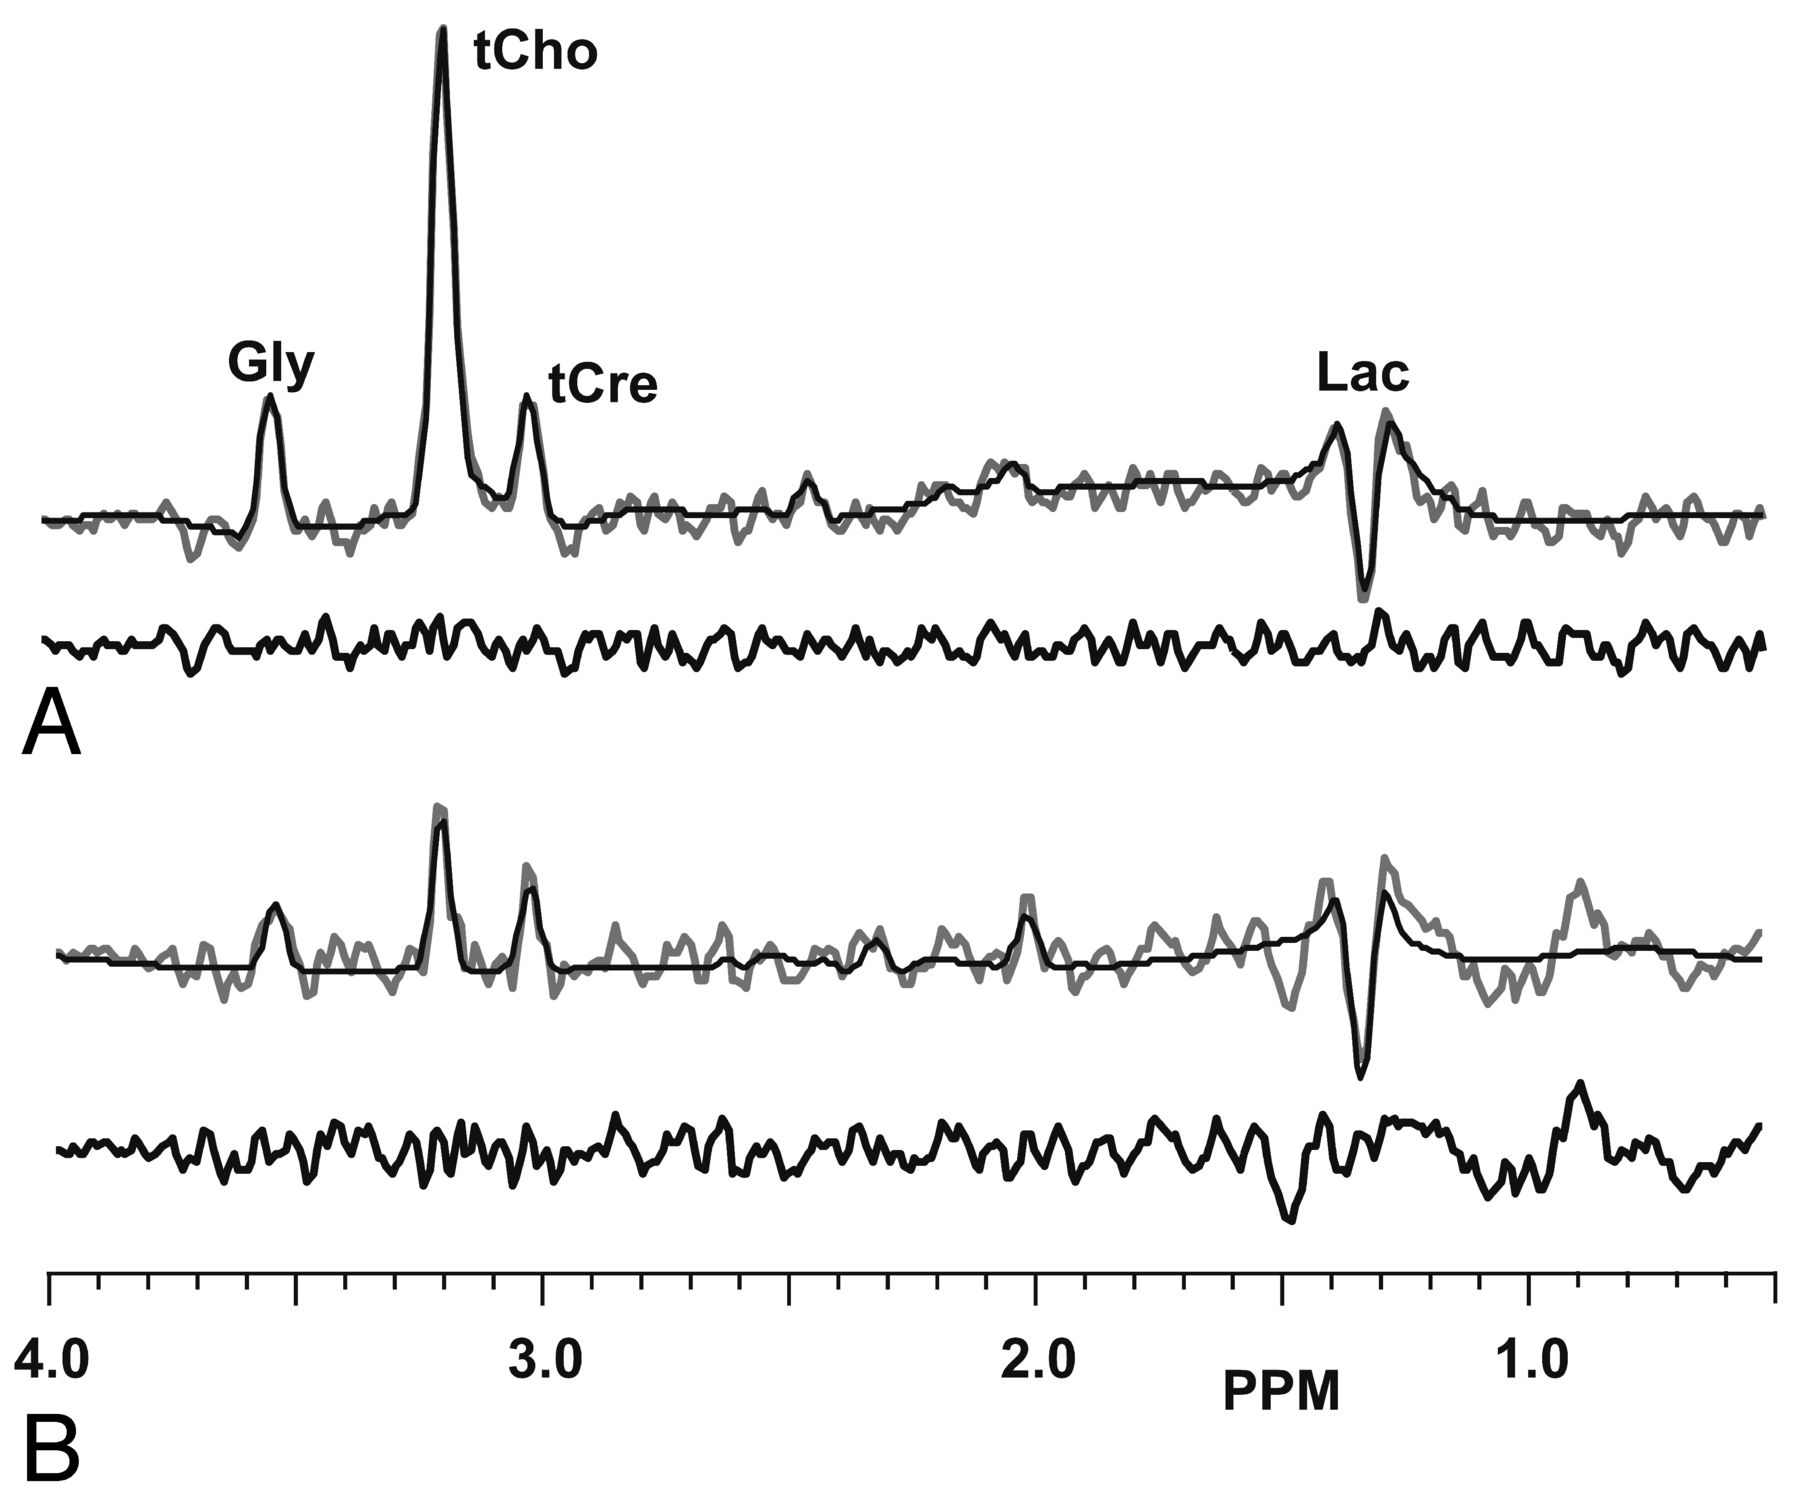
Of 59 datasets, 14 (24%) MRSI studies were found to exhibit a visible Gly signal, with 1 of 20 (5%) grade II, 3 of 15 (20%) grade III, and 10 of 24 (42%) grade IV gliomas. However, the concentrations and extent of the Gly signal varied considerably, from barely detectable in a small location (5 subjects), to a prominent signal corresponding to an estimated maximum concentration of 9.6 mM in a grade III astrocytoma. Of those studies that exhibited Gly, the averages of the maximum estimated Gly concentrations were 6.4 mM (range, 3.4–9.6 mM) for the low-grade tumors and 3.6 mM (range, 1–6 mM) for the high-grade; however, concentrations within each tumor varied considerably. The increased Gly was directly visible as a hyperintense region in the metabolite maps of 7 studies (11.9%), whereas identification in the remaining studies required visual inspection of individual spectra, for example, in cases in which only isolated voxels showed an elevation or a small increase in concentration required confirmation by signal averaging over a region. In Fig 2 are sample spectra and spectral fit results for a grade III astrocytoma, with a Gly concentration (estimated relative to contralateral white matter total creatine) of 6 mM and a grade IV glioma with estimated concentration of 3 mM. These results demonstrate good-quality fitting for all metabolites with minimal impact of mIns at the 3.55-ppm resonance of Gly within the signal-to-noise limitations of the MRSI acquisition. The Cramer-Rao bounds for the Gly analysis were 6% and 19%, respectively.

Sample single-voxel spectra and spectral fitting results for an astrocytoma grade III (A) and a GBM (B). Estimated concentrations of Gly are 6.0 and 3.0 mM, with Cramer-Rao bound values of 6% and 19%, respectively.
In Fig 3 are representative metabolite images at multiple sections for a single subject with a GBM. This illustrates the quality of the volumetric metabolite maps, which also include sampling close to the cortical surface. This result shows widespread loss of NAA over a region comparable with the extent of T2 signal enhancement and a ring of increased Cho corresponding to tumor tissue surrounding a necrotic core. This study showed a relatively small increase of Gly, estimated at a maximum of 3.7 mM concentration, and Fig 2E shows the Gly map obtained from fitting of the spatially smoothed MRSI result. The Cramer-Rao bound for the Gly analysis was ∼8% in the area of maximum signal. The Gly map shows increased signal over just 1 section of the tumor, in a region that also shows increased Cho and heterogeneous postcontrast T1 signal enhancement. The LL signal is seen on lower sections, distributed within both the necrotic core and the area of increased Cho and is displaced laterally and vertically from the area of increased Gly.

Sample volumetric MRSI data for a subject with a GBM, showing a T2-weighted MR image (A), postcontrast T1-weighted MR image (B), NAA (C), Cho (D), Gly (E), and LL (F).
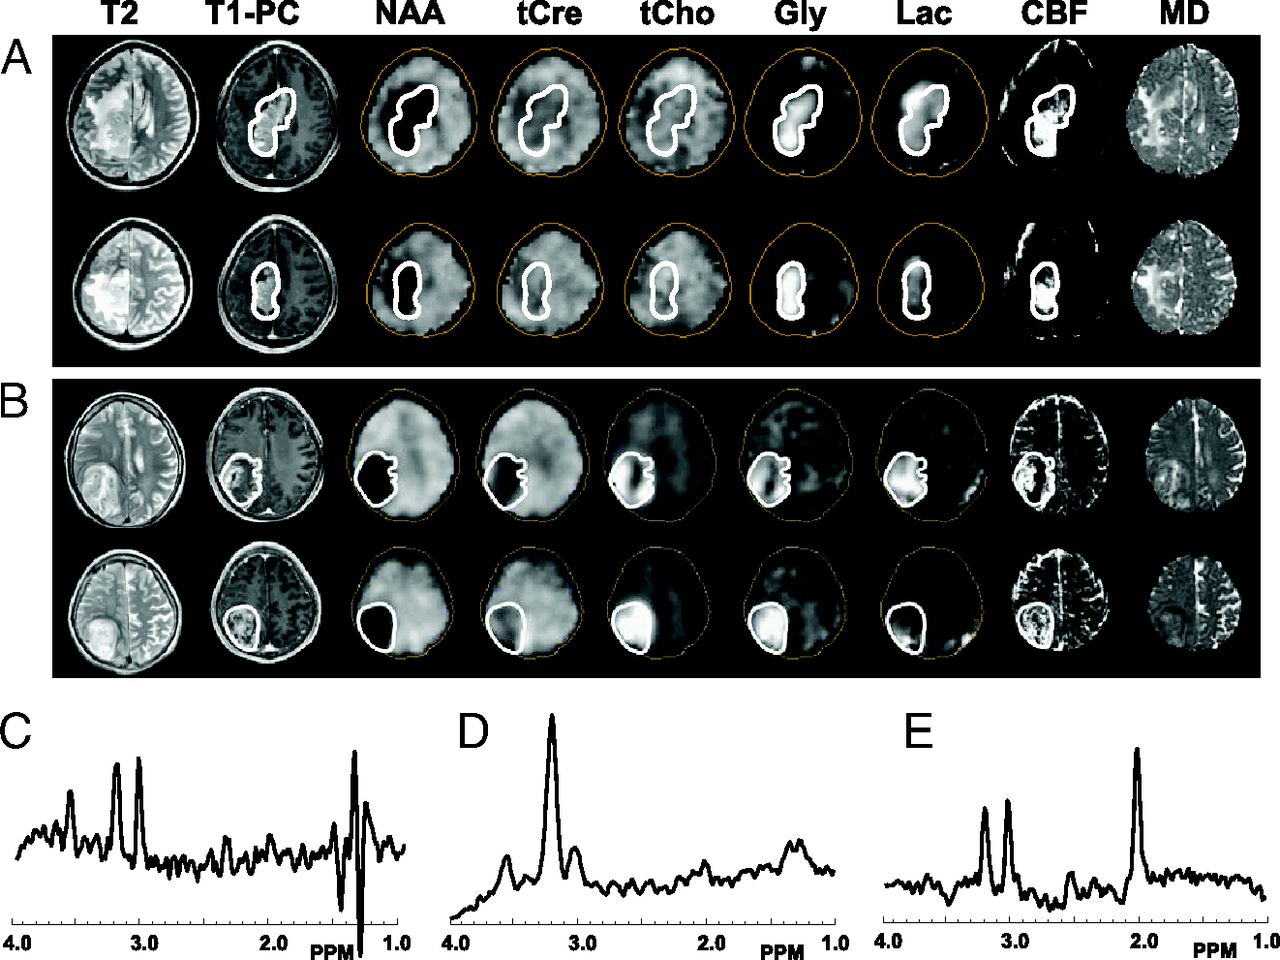
In Fig 4 are shown multiparametric images at 2 sections from a grade II (Fig 4A) and a grade IV (Fig 4B) glioma, with sample spectra showing the presence of the Gly peak at 3.55 ppm and a representative spectrum from normal-appearing white matter. A contour based on the Gly distribution at each section has been superimposed on each of the parametric maps. In the grade II sample, the Gly region corresponds closely to the solid contrast-enhanced tumor region and to increased CBF. In this case, it can be seen that the area of increased LL overlaps that of increased Gly, though the strongest LL signal is outside the Gly region. For the grade IV tumor, the increased Gly corresponds very closely to the regions showing decreased NAA and increased Cho and CBF. In both cases, there are no image features in common with the mean diffusivity image and, similarly, the fractional anisotropy image (not shown). Both tumor spectra show a clearly identifiable Gly signal at 3.55 ppm, and that of the grade II astrocytoma in Fig 4C shows a strong signal from the out-of-phase Lac doublet centered at 1.3 ppm, with a contribution from the alanine doublet, centered at 1.47 ppm.

Sample visualizations of glycine distributions in relation to other MR imaging parameters, for a grade II astrocytoma (A) and a grade IV glioblastoma (B). The MR imaging parameter is indicated at the top of each column of images. Sample spectra are from the grade II tumor (C) and the GBM (D). The spectrum in E is from a normal-appearing white matter region of the subject with GBM. T1-PC is the postcontrast T1-weighted MR imaging, and MD is the mean diffusivity image.
All studies with visible Gly showed T1 contrast enhancement and the presence of LL. For the high-grade tumors, Gly was commonly seen in only a small portion of the tumor, which always corresponded to heterogeneously enhancing regions, with areas of enhancement mixed with no enhancement (eg, Fig 3), and to increased CBF and CBV. The result for the grade II tumor in Fig 3A was the only case in which increased Gly was seen throughout the solid enhancing region. Gly was not seen in areas of necrosis in contrast to LL, which could, in general, be seen throughout the enhancing and necrotic regions.
In 6 of the studies in which Gly was observed, the signal was present in only a small portion of the gross tumor volume; therefore, these studies were not included in the regression analyses. The Pearson correlation coefficients and confidence intervals for the remaining 8 subjects for selected parameters that showed the most significant findings are presented in the Table. Considerable variability across subjects is demonstrated, though all studies showed a positive correlation of Gly and total choline and 4 showed a moderate-to-strong negative association of Gly with NAA. Results for Lac, CBF, and CBV showed mixed results, and there were no strong associations with any of the diffusion parameters.
Correlation coefficients (R) and 95% confidence intervals for the linear regression of Gly with selected MRSI and MR perfusion parameters
Discussion
This study has been the first to apply a volumetric MRSI acquisition to map distributions of Gly in gliomas and to examine potential associations of increased Gly distributions with other MR imaging parameters. The findings of this study are that increased Gly is seen in approximately one-quarter of the studies, with a greater frequency of occurrence in grade IV tumors, though not specific to high-grade gliomas. In most of the cases, the Gly signal was not distributed throughout the tumor volume and was associated with regions of T1 contrast enhancement and increased CBF. By using a regression analysis, a strong association of Gly concentration with that of Cho was found.
The primary pathway for Gly synthesis in the brain is through conversion of glucose via 3-phosphoglycerate and serine.15⇓–17 Measurements in cultured cells have indicated that the rate of glucose consumption leading to Gly production differs among cell lines but can almost match that of Lac in melanoma cells.18 This pathway is initiated by phosphoglycerate dehydrogenase, which is encoded by the gene PHGDH and has been associated with increased mortality in breast cancer,16 melanoma,19 and glioma.17 Liu et al17 found that PHGDH was increasingly expressed in more aggressive glioma types, and Jain et al16 reported that Gly consumption in cancer cell cultures is associated with rates of proliferation and that it is released by slowly proliferating cells, suggesting that Gly may build up in areas where synthesis exceeds demand. These previous findings suggest that while Gly observation is an indicator of this specific genetic marker, it additionally reflects the balance between production and consumption and the influence of the tumor microenvironment. It, therefore, remains to be shown whether in vivo Gly observation may provide a reliable marker of a genetic mutation affecting PHGDH expression, and future studies examining the association between Gly distributions, histology, and PHGDH expression are recommended to examine this question.
The relative number of studies in which Gly was detected in GBMs (42%) was smaller than that of 66% reported by Choi et al4 and the 87% of glioma samples with high PHGDH expression reported by Liu et al.17 Reasons include the lower signal-to-noise ratio of the MRSI acquisition relative to the single-voxel measurement and limitations of the MR spectroscopy acquisition for sampling tumors located in inferior temporal and frontal brain regions, which were included in this study. However, this study also demonstrates a limitation of using single-voxel acquisitions in that for one-third of the studies, the increased Gly signal was found in only a small portion of the tumor, which could be missed when using a single localized measurement.
The finding of an association between Gly and Cho is consistent with the report of Jain et al,16 who found a significant correlation between phosphocholine and glycine and that Gly consumption is specific to rapidly proliferating cells. The indirect association of Gly with Lac, with the Gly signal being seen on the edges of areas of increased Lac, as well as the association with areas of increased CBF and CBV, would suggest that Gly production is greatest in regions with incomplete hypoxia.
Limitations of this study are that mIns may still contribute to the spectral fitting of the Gly signal and strict quality criteria based on Cramer-Rao bound values were not used for the identification of increased Gly in the metabolite maps. To minimize the possibility of mIns contributions, we always used a visual examination of individual spectra to confirm the appearance of an in-phase singlet resonance. Previous studies have provided detailed analyses for the “optimum TE” approach for different field strengths.7,10 Improved spectral quantitation of Gly is possible by using longer TEs and multiecho detection sequences,3⇓–5 though at the expense of reduced signal intensity, which would impact the quality of MRSI measurements.
Conclusions
This study has shown that in vivo mapping of increased Gly in gliomas can be achieved by using MRSI but that it can be detected in only a fraction of subjects and the concentrations and distributions are highly variable. While previous studies indicate an association of increased Gly expression with a tumor subtype having a specific genetic mutation, the ability to detect the signal in vivo is likely modulated by additional factors from the tumor microenvironment.
Footnotes
Disclosures: Andrew A. Maudsley—RELATED: Grant: National Institutes of Health,* Support for Travel to Meetings for the Study or Other Purposes: Indo-US Science and Technology Forum, Comments: reimbursement for travel and hotel to work in India, UNRELATED: Grants/Grants Pending: National Institutes of Health.* Radka Stoyanova—UNRELATED: Grants/Grants Pending: National Institutes of Health,* Bankhead-Coley,* Comments: research grants in which I am coinvestigator (National Institutes of Health), Florida state award (Bankhead-Coley). Nestor Andres Parra—UNRELATED: Grants/Grants Pending: Bankhead Coley,* Comments: tobacco-related investigation grant that pays for my postdoctoral position. Not related to this study in particular. *Money paid to the institution.
This work was supported by National Institutes of Health grant R01EB000822, Indo-US Science and Technology Forum award #20-2009, and Bankhead-Coley 10BN03. Bhaswati Roy received financial assistance from the University Grant Commission, New Delhi, India.
Indicates open access to non-subscribers at www.ajnr.org
References
- 1.
- 2.
- 3.
- 4.
- 5.
- 6.
- 7.
- 8.
- 9.
- 10.
- 11.
- 12.
- 13.
- 14.
- 15.
- 16.
- 17.
- 18.
- 19.
- Received June 20, 2013.
- Accepted after revision October 30, 2013.
- © 2014 by American Journal of Neuroradiology