Abstract
BACKGROUND AND PURPOSE: Aqueductal stroke volume from phase-contrast MR imaging has been proposed for predicting shunt response in normal pressure hydrocephalus. However, this biomarker has remained controversial in use and has a lack of validation with invasive intracranial monitoring. We studied how aqueductal stroke volume compares with intracranial pressure scores in the presurgical work-up and clinical score, ventricular volume, and aqueduct area and assessed the patient's response to shunting.
MATERIALS AND METHODS: Phase-contrast MR imaging was performed in 21 patients with probable idiopathic normal pressure hydrocephalus. Patients were selected for shunting on the basis of pathologically increased intracranial pressure pulsatility. Patients with shunts were offered a second MR imaging after 12 months. Ventricular volume and transverse aqueductal area were calculated, as well as clinical symptom score.
RESULTS: No correlations between aqueductal stroke volume and preoperative scores of mean intracranial pressure or mean wave amplitudes were observed. Preoperative aqueductal stroke volume was not different between patients with shunts and conservatively treated patients (P = .69) but was correlated with ventricular volume (R = 0.60, P = .004) and aqueductal area (R = 0.58, P = .006) but not with the severity or duration of clinical symptoms. After shunting, aqueductal stroke volume (P = .006) and ventricular volume (P = .002) were reduced. A clinical improvement was seen in 16 of 17 patients who had shunts (94%).
CONCLUSIONS: Aqueductal stroke volume does not reflect intracranial pressure pulsatility or symptom score, but rather aqueduct area and ventricular volume. The results do not support the use of aqueductal stroke volume for selecting patients for shunting.
ABBREVIATIONS:
- ASV
- aqueductal stroke volume
- ICP
- intracranial pressure
- iNPH
- idiopathic normal pressure hydrocephalus
- MWA
- mean ICP wave amplitude
- PCMR
- phase-contrast MR imaging
Idiopathic normal pressure hydrocephalus (iNPH) is characterized by dementia, incontinence, and gait disturbance1 and can be treated by ventriculoperitoneal shunt surgery. However, the disease can be difficult to separate from other neurodegenerative disorders such as Alzheimer and Parkinson diseases.2 Selection criteria for surgical shunting have been heterogeneous, and the clinical response to this treatment has, accordingly, been reported to range from 29% to 90%.3⇓–5 Previous investigators have, therefore, sought to establish noninvasive parameters from MR imaging studies. After Bradley et al6 first reported an increased CSF flow void in the aqueduct associated with a favorable shunt response, studies using phase-contrast MR imaging (PCMR) have demonstrated aqueductal flow parameters, and in particular the aqueductal stroke volume (ASV), to be useful in the diagnosis and selection of patients for shunt surgery7⇓⇓⇓⇓⇓–13 and in the follow-up of patients with shunts.14 However, other studies do not reproduce the beneficial utility of measuring aqueductal flow15⇓⇓–18; therefore, the use of ASV in iNPH remains disputed. Accordingly, comparisons with invasive intracranial measurements are warranted.
Continuous monitoring of intracranial pressure (ICP) and single cardiac-induced ICP waves in patients with iNPH has revealed elevated mean ICP wave amplitudes (MWAs) in those responding to shunts, compared with those not responding.19,20 Hence, in this hospital, diagnostic preoperative monitoring of MWA is used routinely and predicts a beneficial shunt response in 9 of 10 patients with iNPH.19 Elevated MWA is indicative of reduced intracranial compliance (ie, reduced pressure-volume reserve capacity),21,22 which may be a pathophysiologic mechanism behind iNPH.19,23⇓–25 Increased ASV in iNPH has been attributed to reduced intracranial compliance.26 If ASV should express reduced intracranial compliance and thereby predict shunt response, a positive correlation between ASV and MWA seems reasonable.
The purpose of this study was therefore to compare ASV from phase-contrast MR imaging with preoperative ICP scores, clinical normal pressure hydrocephalus scores, and MR imaging–derived ventricular volume and aqueductal area in patients with iNPH before and after shunting.
Materials and Methods
Patient Inclusion and Study Design
The study was approved by the institutional review board of Oslo University Hospital. Inclusion was by written and oral informed consent.
Of 28 consecutive patients with iNPH undergoing assessment for probable iNPH within the department of neurosurgery, 7 patients were excluded because of motion artifacts at PCMR and/or termination of the examination before completion of the PCMR sequence. Accordingly, 21 patients with iNPH (10 women, 11 men; range, 56–84 years) with successful PCMR were included in this prospective observational study. The assessment included clinical examination with determination of iNPH symptom severity, PCMR, and overnight ICP monitoring. The patients with iNPH who underwent shunt surgery were invited to a second PCMR after 12 months.
Clinical Management
The assessment of patients with iNPH for shunt surgery followed the clinical routine at the department of neurosurgery. Clinical grading of the severity of symptoms was performed by using the normal pressure hydrocephalus grading scale of this department,19 which assesses the combined severity of gait disturbance, urinary incontinence, and dementia. Each component is graded from 1 to 5, with a possible total score of 3 (worst) to 15 (best). According to the institutional routine, the decision for shunt surgery is based on a combination of clinical assessment, radiologic assessment, and the results of continuous ICP monitoring.19
The shunt response was defined as an increase by at least 2 points on the normal pressure hydrocephalus grading scale, and the clinical score was assessed at regular intervals, 3, 6, and 12 months (including imaging after 12 months) following shunting.
MR Image Acquisition
The techniques for CSF velocity imaging with MR imaging have previously been described in detail.27
MR imaging was performed on a 3T Achieva system (Philips Healthcare, Best, the Netherlands). The MR imaging parameters for aqueductal flow were TR = 24 ms and TE = 16 ms, voxel size = 0.60 × 0.80 × 4.00 mm3, velocity encoding = 10 cm/s, and 30–40 phases with retrospective peripheral cardiac gating. The scan was obtained in a section perpendicular to the aqueduct (Fig 1C).

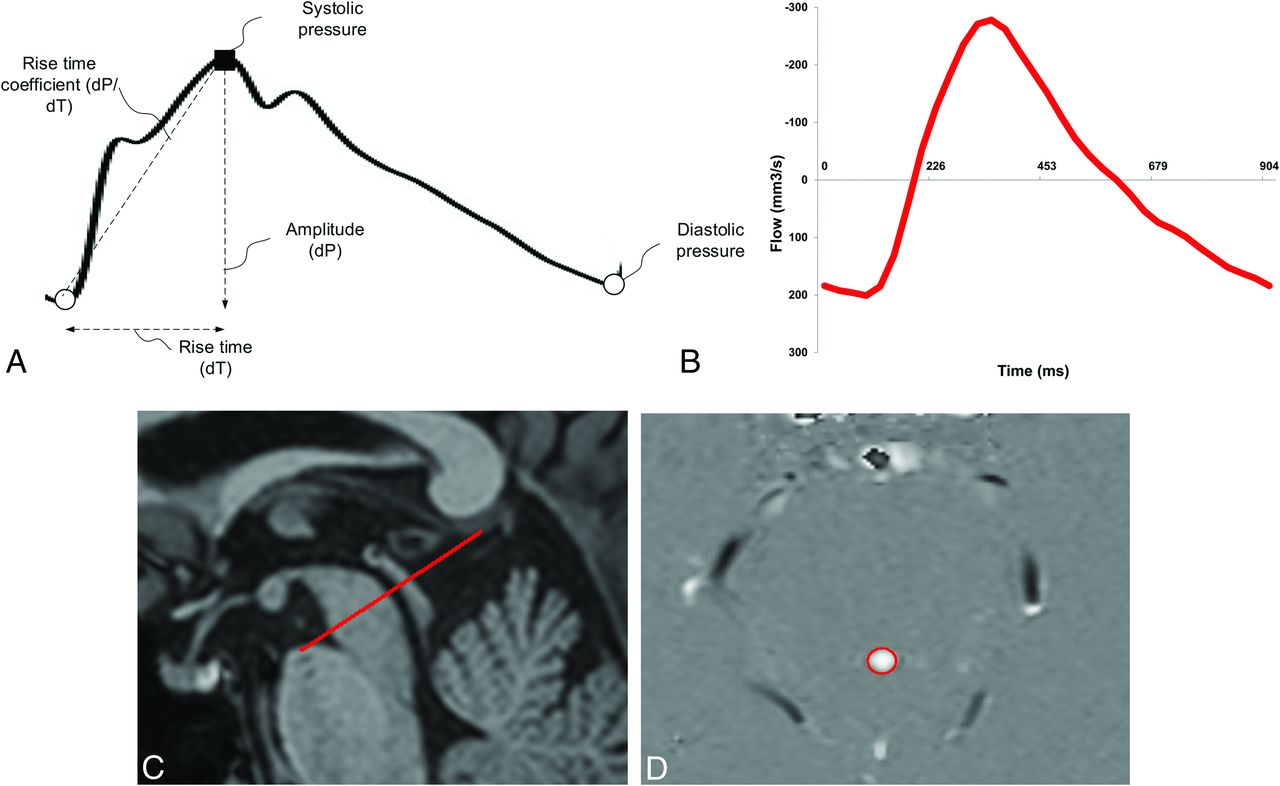
The study compared aqueductal flow–based pulsatility, expressed by ASV, with pressure-based intracranial pulsatility, expressed by MWA. A, Single cardiac-induced ICP wave, the MWA, is determined as the average of amplitudes from single ICP waves during consecutive 6-second time intervals. B, ASV is defined as the mean of systolic and diastolic volumetric CSF flow in the aqueduct during 1 cardiac cycle (area under/over the flow curve) minus net aqueductal flow. C, The aqueductal flow curve is based on section orientation (red line) perpendicular to the aqueduct. D, PCMR with manually drawn ROI (red circle) defines the aqueduct.
The MR imaging protocol also included 3D T1-weighted ultrafast gradient echo, acquisition matrix = 256 × 256 × 192 with voxel size 1.0/1.0/1.0 mm3, flip angle = 7, TR/TE = 8.6/2.3 ms, which was used for segmentation of the supratentorial ventricles for the volumetric analysis.
MR Image Postprocessing
All examinations were postprocessed by using Q-flow software (Philips Healthcare). The aqueduct was manually defined in all the phase images with an ROI in each section (Fig 1D) by a neuroradiologist with 7 years of experience who was blinded to clinical data. Care was taken not to include nonmoving tissue elements in the imaging plane to avoid background noise in the MR imaging signal.
ASV was estimated after correction for potential aliasing by sinusoid curve fitting and was defined as the mean of systolic and diastolic volumetric CSF flow during 1 cardiac cycle minus net flow (Fig 1B).
Calculation of supratentorial ventricular volume (referred to as “ventricular volume”) was performed by a 3D medical image segmentation software ITK-SNAP 2.4 (www.itksnap.org),28 which provides semiautomatic segmentation by using active contour methods. For the segmentation, the region competition method by Zhu and Yuille29 was used. The segmentation result was controlled visually and, if necessary, corrected manually (in ITK-SNAP).
ICP Monitoring
All patients underwent continuous overnight ICP monitoring. As previously described in detail,19 an ICP sensor was placed in the brain parenchyma through a small burr-hole in the skull with the patient under local anesthesia. Overnight monitoring was done in the patient ward by using a computerized system (Sensometrics Technology; dPCom AS, Oslo, Norway) for automatic identification of individual cardiac-induced single ICP waves. The amplitude of the ICP wave was identified as the pressure difference between the systolic maximum and diastolic minimum pressures (Fig 1A). The mean ICP wave amplitude is determined as the average of all single ICP waves during consecutive 6-second time intervals, while the mean ICP is the average of absolute ICP relative to a zero pressure level. For the patients in this study, the MWA and mean ICP values were determined for the 6-second time windows from 11 pm to 7 am (ie, 4 800 6-second time windows). During this recording period, both the average of MWA and mean ICP were determined, as well as the percentage of MWA of ≥5 mm Hg and the percentage of mean ICP of ≥15 mm Hg, during the recording period.
According to the institutional routine, primarily the MWA is used for selection to shunting. Threshold levels of MWA representing an indication for shunting are MWA, on average, of ≥4 mm Hg and/or the percentage of MWA of ≥5 mm Hg in ≥10% of recording time.
Statistical Analysis
Under the assumption of normal distribution, correlations were determined by the Pearson correlation coefficient, and pre- and postsurgical values of ASV and ventricular volume were compared by using a paired-samples t test. Comparison of ASV between patients with shunts (shunt group) and conservatively treated patients (conservative group) was performed with an independent samples t test. The significance level was set to .05. Statistical analysis was performed by using SPSS Statistics, Version 20 (IBM, Armonk, New York).
Results
Patients
Table 1 presents patient data.
Patient data
Among the 17/21 (81%) patients selected for shunting, 16/17 patients with shunts (94%) improved clinically (shunt responders), while 1 (6%) had no clinical improvement (shunt nonresponder). Among the 12 patients with PCMR after shunting, 11 patients (92%) were responders.
MR Imaging Data and ICP Scores
Table 2 presents the PCMR-derived ASV and the ventricular volume and aqueduct area before/after shunting and the preoperative ICP scores of the 21 patients with iNPH.
MRI-derived measures and ICP scores
As further illustrated in Fig 2, ASV before surgery did not differ between patients found eligible (shunt group) or noneligible (conservative group) for shunting (P = .69).

ASV (A) and ventricular volume (B) are presented for patients with shunts and iNPH before (n = 17) and after (n = 12) shunting (surgery group) and for conservatively managed patients with iNPH (conservative group, n = 4) before management. Significance levels are presented in the plots.
In the shunt group, ASV was reduced from a median of 111 μL before to a median of 68 μL after surgery (P = .01, Fig 2A), while the ventricular volume was a median of 137 mL before and a median of 105 mL after surgery (P = .001, Fig 2B). There was no significant change in the aqueductal area after shunting (P = .94).
There was a positive correlation between ASV and ventricular volume before surgery (R = 0.60, P = .004; Fig 3A) and after shunting (R = 0.73, P = .007; Fig 3B). Moreover, there was also a positive correlation between ASV and aqueduct area before surgery (R = 0.58, P = .006). We did not find any significant correlation either between ASV and preoperative normal pressure hydrocephalus scores (R = 0.29, P = .21) or between ASV and the duration of iNPH symptoms (R = 0.26, P = .26).

For patients with iNPH, the correlations between ASV and ventricular volume before (n = 21) (A) and after (n = 12) (B) shunt surgery are presented. The Pearson correlation coefficients and significance levels are presented in the plots.
While the mean ICP was comparable between the shunt and conservative groups, MWA was elevated in the surgery group (Table 2). There were no correlations between ASV and mean ICP (Fig 4A), or ASV and MWA (Fig 4B). In addition, no correlations between ASV and the percentage of mean ICP of ≥15 mm Hg or between ASV and the percentage of MWA of ≥5 mm Hg were observed.

For patients with iNPH (n = 21), the correlations between ASV and mean ICP (A) and ASV and MWA (B) before shunt surgery are presented. The Pearson correlation coefficients and significance levels are presented in the plots.
Discussion
The main observation of this study was that CSF flow–based pulsatility expressed by ASV did not compare with intracranial pressure pulsatility expressed by MWA. On the other hand, ASV correlated with ventricular volume and aqueduct area.
Even though PCMR-based aqueductal flow has previously been extensively investigated and advocated by some as a tool for selection of patients for shunt surgery in iNPH, comparisons with invasive intracranial measurements have been very limited. To our knowledge, there is 1 previous study that compared PCMR-derived ASV with ICP monitoring.30 This study reported an association between ASV and a temporal subpeak of the ICP wave, but the result was based on a small cohort of 7 patients and the clinical significance of the findings has been disputed.31
In our study, a high proportion of the patients in the iNPH cohort had signs of reduced intracranial compliance by increased MWA after overnight ICP monitoring (17/21). MWA of ≥4 mm Hg or the percentage of MWA of ≥5 mm Hg in ≥10% of recording time or both were previously reported to predict shunt response in iNPH19 and have been considered as indicative of impaired intracranial compliance.21 Using the MWA for selection for shunt treatment gave an excellent shunt response in 16 of 17 (94%) patients in this study. A positive shunt response can be considered a marker of “true” iNPH, and the high response rate suggests that our study cohort was representative of iNPH and contained few patients with diseases that clinically might present similarly, with similar ASV values.32 We reproduced previous findings of ASV being elevated in patients with iNPH compared with healthy controls33 and in contrast to elderly patients in general, in whom ASV has been reported to be reduced.34 However, ASV varied over a wide range in patients found both eligible and noneligible for surgical shunting on the basis of MWA, and ASV values overlapped between the groups. Accordingly, our results question the clinical utility of the ASV parameter, both with respect to its ability to diagnose iNPH and its predictive value for a clinically favorable shunt response.
There may be several reasons why ASV does not compare with MWA. First, as for all PCMR measurements, ASV is obtained from a time window of just a few minutes, while MWA represents a mean value from an 8-hour time window with registration of several thousand single waves, where frequent physiologic pressure fluctuations during the recording period are typically observed.19,35 For ASV to be a valid marker of intracranial pulsatility, one would have to assume that the limited time window, from which it is obtained, demonstrates values that are representative of the underlying condition. To our knowledge, no previous observations support such an assumption being valid.
Several factors might influence aqueductal flow. It has previously been suggested that the systolic, inward expansion of the brain against enlarged ventricles is a fundamental cause of increased ASV, before irreversible atrophy occurs.26 Other contributions might be from the difference in CSF pressure between the third and fourth ventricles, the heart rate, and the aqueductal geometry and mainly at which level flow in the aqueduct is assessed.36 In this study, a strong association between aqueductal area and ASV was found; however, this does not necessarily imply causality. As pointed out by Chiang et al,33 it seems reasonable that the aqueduct can adapt to increased flow, similar to the adaptation of the blood vessel lumen area to maintain a wall shear stress within a normal range.37
ASV and ventricular volume declined after shunting; this change is consistent with that in previous studies,14,38 while aqueductal area did not change. While ASV did not reflect the clinical severity of iNPH preshunting and did not compare with any pressure parameters, reduced ASV after shunting might therefore be primarily influenced by reduced ventricular size, rather than reflecting a clinical response, contrary to what has been suggested previously.14 ASV also correlated positively with ventricular volume before shunting; this correlation confirms previous observations33 but is contradictory to a more recent study by Chaarani et al.36 In our study, the statistical significance of this positive correlation was dependent on 1 patient with extreme values, both ASV and ventricular volume.
The lack of correlation between ASV and symptom severity could theoretically be due to a decline in ASV as a sign of long-standing progressive cerebral ischemic changes and atrophy, making the iNPH irreversible, which was postulated by Scollato et al,39 who followed patients with unshunted iNPH and found a decline in ASV after typically 18–20 months of symptom duration. We found no such tendency toward ASV being in the lower range among patients with long-standing symptoms; however, the median of symptom duration in our cohort was 2 years, and hence the number of patients with a longer disease history was limited.
While MWA was increased in shunt responders in the present study, as previously reported,19 no such relationship between the occurrence of so-called B waves and shunt response has been shown.19,40 In this context, the MWA is computed from the single cardiac-induced ICP waves, while B waves are short-lasting (< 1 minute) increases in static ICP (mean ICP). It has previously been reported that occurrences of B waves and single ICP waves (expressed by the MWA) do not correlate.41
Limitations
Some limitations with this study should be noted. The patients were too few to determine the accuracy of ASV as a diagnostic test in iNPH, especially due to the small number of patients in subgroups such as the conservatively managed group (n = 4) and the nonresponsive group with shunts (n = 1). A lack of correlations between tested variables may have been a reflection of few study subjects. Finally, the statistical correlations that were demonstrated in the study do not necessarily imply causality between the variables.
The reported accuracy of PCMR volumetric flow measurements in pulsatile flow is within 2.8%,42 and calculation of aqueductal stroke volume is less sensitive to inaccuracies from manual selection of ROIs than is the calculation of flow velocity.27,33 However, measurements of aqueductal flow can be influenced by flow aliasing, which is characterized by its apparent high velocity in the opposite direction to the average velocity in the defined area of interest. This was corrected for with the same algorithm applied to all patients, as described in the “Materials and Methods” section.
Another limitation might be the PCMR resolution with a pixel size of 0.60 × 0.80 mm2 in the transverse plane, which is lower than that in the previous study of Bradley et al,9 supporting ASV as a shunt predictor. The inability to find the utility of ASV in our study could therefore have been influenced by inferior image resolution. However, other studies demonstrating a beneficial use of ASV in iNPH have used a pixel size comparable8,10,11,13 or inferior12 to that applied in our study. While reducing the pixel size would reduce the number of pixels from nonmoving tissue elements being included in the ROI defining the aqueduct, the use of larger pixels improves the signal-to-noise ratio and even more by use of a 3T magnetic field strength, as in our study, compared with 1.5T.
A reference ROI can be placed in the adjacent cerebral peduncle to rule out partial volume effect and mass brain movement during aqueductal flow measurement with PCMR. Such a correction was not applied in this study. Contribution from mass brain movement to the ASV value has been reported to be small though7 and should not be expected to influence the results of the current measurements substantially.
Conclusions
In this cohort of patients with iNPH, ASV was not associated with invasively measured ICP scores or symptom severity of iNPH but was correlated with ventricular volume and aqueduct area. The results do not support the use of ASV as a noninvasive tool to diagnose reduced intracranial compliance in patients with iNPH who are candidates for shunting. The composition of the study cohort, with a small fraction of nonresponders to shunting and few conservatively treated patients, did not allow a more direct assessment of ASV as a marker for shunt responsiveness in iNPH.
Footnotes
Disclosures: Kyrre E. Emblem—RELATED: Grant: South-Eastern Norway Regional Health Authority Grant 2013069*; UNRELATED: Patents (planned, pending or issued): NordicNeuroLabs AS.* Oliver Geier—UNRELATED: Patents (planned, pending or issued): Siemens Germany, Comments: Patent attorney was paid by Siemens. Noam Alperin—UNRELATED: Stock/Stock Options: Aplerin Noninvasive Diagnostics. Per Kristian Eide—RELATED: Stock/Stock Options: dPCom AS, Oslo, Norway, Comments: financial interest (shares) in the software company (dPCom AS, Oslo) manufacturing the software (Sensometrics software) used for analysis of the ICP recordings. *Money paid to the institution.
Paper previously presented in part at: Annual Meeting of the Radiological Society of North America, December 1–6, 2013; Chicago, Illinois (No. SSM14-05, RSNA ID: 13021973).
Indicates open access to non-subscribers at www.ajnr.org
References
- 1.
- 2.
- 3.
- 4.
- 5.
- 6.
- 7.
- 8.
- 9.
- 10.
- 11.
- 12.
- 13.
- 14.
- 15.
- 16.
- 17.
- 18.
- 19.
- 20.
- 21.
- 22.
- 23.
- 24.
- 25.
- 26.
- 27.
- 28.
- 29.
- 30.
- 31.
- 32.
- 33.
- 34.
- 35.
- 36.
- 37.
- 38.
- 39.
- 40.
- 41.
- 42.
- Received December 15, 2014.
- Accepted after revision February 11, 2015.
- © 2015 by American Journal of Neuroradiology