Abstract
BACKGROUND AND PURPOSE: Anaplastic pleomorphic xanthoastrocytoma, which has been recently defined as a distinct entity in the 2016 World Health Organization classification, may exhibit aggressive clinical behavior and relatively worse prognosis than pleomorphic xanthoastrocytoma. This study aimed to investigate whether there were any differences in MR imaging characteristics between these 2 tumors.
MATERIALS AND METHODS: This retrospective study included 9 patients with anaplastic pleomorphic xanthoastrocytoma and 10 patients with pleomorphic xanthoastrocytoma who underwent MR imaging before an operation. DWI was performed in 17 patients (8 with anaplastic pleomorphic xanthoastrocytoma, 9 with pleomorphic xanthoastrocytoma); and DSC-PWI, in 9 patients (5 with anaplastic pleomorphic xanthoastrocytoma, 4 with pleomorphic xanthoastrocytoma). Demographics, conventional imaging characteristics (location, size, cystic degeneration, enhancement, peritumoral edema, and leptomeningeal contact), minimum relative ADC ratio, and maximum relative CBV ratio were evaluated between the anaplastic pleomorphic xanthoastrocytoma and pleomorphic xanthoastrocytoma groups.
RESULTS: Anaplastic pleomorphic xanthoastrocytoma was more likely to demonstrate high-grade features than pleomorphic xanthoastrocytoma, including greater maximum tumor diameter (4.7 ± 0.6 cm versus 3.1 ± 1.1 cm, P = .001), more frequent heterogeneous contrast enhancement of solid portions (88.9% versus 20.0%, P = .01), more obvious peritumoral edema (2.3 ± 0.9 cm versus 1.0 ± 0.9 cm, P = .008), lower minimum relative ADC on DWI (1.0 ± 0.2 versus 1.5 ± 0.4, P = .008), and higher maximum relative CBV on DSC-PWI (2.6 ± 0.8 versus 1.6 ± 0.2, P = .036).
CONCLUSIONS: Anaplastic pleomorphic xanthoastrocytomas often have more aggressive MR imaging features mimicking high-grade astrocytomas than pleomorphic xanthoastrocytomas. DWI and DSC-PWI might be useful in the characterization and differentiation of anaplastic pleomorphic xanthoastrocytoma and pleomorphic xanthoastrocytoma.
ABBREVIATIONS:
- APXA
- anaplastic pleomorphic xanthoastrocytoma
- PXA
- pleomorphic xanthoastrocytoma
- rADCmin
- minimum relative ADC
- rCBVmax
- maximum relative CBV
- WHO
- World Health Organization
Pleomorphic xanthoastrocytoma (PXA) is a rare circumscribed glioma composing <1% of all astrocytic tumors, usually occurring in children and young adults.1 It was first described in 1979 by Kepes et al2 and was recognized as a distinct brain tumor by the World Health Organization (WHO) in 1993.3 Although PXA was classified as a WHO grade II tumor, “PXA with anaplastic features” composes 15%–50% of these lesions.4⇓⇓–7 The 2016 WHO classification system has divided PXA into 2 distinct entities based on histopathologic features: WHO grade II PXA and WHO grade III anaplastic PXA (APXA).8,9 The APXA is defined as the presence of ≥5 mitoses per 10 high-power fields. Only gross total resection may be performed for the patients with PXA, whereas attempted gross total resection and adjuvant therapies are required for the patients with APXA.5,10 Furthermore, APXA has been reported to have a worse prognosis than PXA, with 5-year overall survival of 57.1%.5,11 Therefore, preoperative differentiation between the 2 entities by MR imaging may aid in planning the treatment strategy and predicting prognosis.
APXA is associated with histopathologic features of malignancy, such as increased mitotic activity, necrosis, or endothelial proliferation.12,13 Some studies have reported the characteristic MR imaging appearances of PXA14⇓⇓⇓⇓⇓–20 but did not separate the imaging characteristics of APXA from PXA. Previously, only a few case reports or small case series were available regarding the MR imaging features of APXA, which demonstrated intense heterogeneous enhancement with severe peritumoral edema.20⇓⇓⇓⇓⇓–26 Moreover, Moore et al14 reported a patient with APXA who underwent diffusion-weighted MR imaging showing diffusion restriction, indicating that DWI may be potentially useful for the characterization of APXA. To the best of our knowledge, conventional and advanced MR imaging for APXA have not been systematically reported. Therefore, the purpose of this study was to investigate the conventional and advanced MR imaging features of APXA and PXA to determine whether there are any differences in imaging characteristics between these 2 tumors.
Materials and Methods
Study Population
This retrospective study was approved by the institutional review board, and the requirement of written informed consent was waived. We collected 19 consecutive patients who underwent preoperative MR imaging for a pathologically proved APXA (n = 9) or PXA (n = 10) in our hospital between January 2008 and November 2017. The MR imaging and clinical records of these patients were analyzed.
Histopathologic Diagnosis
All cases were reviewed on the basis of the histologic features by a neuropathologist (15 years of experience in neuropathology) according to the 2016 WHO classification of central nervous system tumors. The diagnostic criteria included tumors demonstrating a relatively solid growth pattern, composed of spindle-shaped, pleomorphic, and multinucleated cells, associated with both pale and bright eosinophilic granular bodies to be diagnosed as PXA. Anaplastic features, which included a mitotic index of ≥5 of 10 high-power fields with or without necrosis and endothelial proliferation, were diagnosed as APXA.
Preoperative MR Imaging Techniques
All patients underwent MR imaging on 3T scanners (Magnetom Verio or Magnetom Skyra; Siemens, Erlangen, Germany) or a 1.5T scanner (Signa TwinSpeed; GE Healthcare, Milwaukee, Wisconsin). The retrospective nature of this study resulted in variability in MR images and imaging protocols. Conventional MR imaging protocols included an axial T2-weighted sequence, nonenhanced axial and sagittal T1-weighted sequences, and 3 orthogonal plane contrast-enhanced T1-weighted sequences. An FOV of 22 cm2, imaging matrix of 256 × 256, and slice thickness of 5 mm were uniformly applied in all sequences.
DWI was performed in 9 patients with PXA and 8 patients with APXA using an axial echo-planar sequence according to following technique parameters: TR/TE = 8200/102 ms, FOV = 22 × 22 cm, section thickness/gap = 5 mm/1 mm, diffusion gradient encoding= b=0, 1000 s/mm2. The diffusion gradient was used in 3 orthogonal directions. ADC maps were automatically calculated using a monoexponential model.
Dynamic susceptibility contrast-enhanced perfusion-weighted imaging was available in 4 patients with PXA and 5 patients with APXA. DSC-PWI was performed with a T2*-weighted gradient recalled echo-planar imaging sequence during the intravenous power injection of 0.1 mmol/kg of gadopentetate dimeglumine or gadobenate dimeglumine at a flow rate of 5 mL/s. The parameters of DSC-PWI were as follows: TR/TE = 1000–1250/54 ms; FOV = 22 × 22 cm; section thickness/gap = 5 mm/1 mm. The CBV maps were generated with a single-compartment model and an automated arterial input function, as described in our previous study.27
MR Imaging Analysis
All images were reviewed in consensus by 2 radiologists (readers 1 and 2 with 20 and 8 years of experience in neuroimaging, respectively) to make a factual comparison and minimize the confounding effects. The readers were blinded to tumor histology and recorded the following tumor characteristics: 1) tumor location (frontal, occipital, temporal, or parietal; superficial or deep); 2) tumor size (largest diameter, in centimeters); 3) the presence of cystic degeneration; 4) enhancement characteristics of the solid component (heterogeneous or homogeneous); 5) the presence and degree of peritumoral edema (largest diameter, in centimeters); 6) leptomeningeal contact; and 7) the presence of restricted diffusion, defined as high signal on DWI and corresponding low signal on ADC maps compared with contralateral normal brain parenchyma. Tumor size was defined as the largest diameter measured on contrast-enhanced T1WI. The peritumoral edema was defined as the nonenhanced, T2-hyperintense regions surrounding the enhancing tumors on contrast-enhanced T1WI. The tumor location was defined as the main lobe involvement when >1 lobe was involved.
When DWI or DSC-PWI examinations were available, another experienced radiologist (reader 3 with 4 years of experience in neuroimaging) blinded to tumor histopathology evaluated the ADC maps and CBV maps separately. The ADC values of tumor were calculated by placing an ROI inside the solid components of the tumor on the ADC maps. Three nonoverlapping ROIs (20–30 mm2) were manually placed inside the solid components of the tumor on the ADC maps where the tumor showed relatively low signal. The minimum ADC values were taken into account. In 2 tumors with smaller solid components or obvious hemorrhage, only 1 ROI could be placed on the enhancing portions of the tumor. The ROI placement was made from the contrast-enhancing solid components of the tumor, avoiding cystic, hemorrhagic, or apparent vascular structures that might influence the ADC values. To minimize variances of ADC values in an individual patient, we placed a single ROI inside the contralateral normal-appearing brain parenchyma on ADC maps. CBV measurements were performed with the same ROI as used for ADC measurements, and the maximum CBV values were considered. Tumor/parenchyma minimum relative ADC ratios (rADCmin) and maximum relative CBV ratios (rCBVmax) were calculated.
Statistical Analysis
The normality of all continuous parameters was initially assessed using the Kolmogorov-Smirnov test. The Fisher exact test was used to assess the differences in the categoric variables (age, sex, location, cystic degeneration, enhancement characteristics, leptomeningeal contact, and the presence of restricted diffusion) between the PXA and APXA groups. The Mann-Whitney U test was used to assess the differences in continuous variables (edema and size) between the PXA and APXA groups because of a lack of normality of the data. The Student t test was used to assess the differences for rCBVmax and rADCmin parameters between the 2 groups. Statistical analysis was performed with the Statistical Package for the Social Sciences (SPSS 22.0 Version for Windows; IBM, Armonk, New York). P values < .05 indicated statistical significance.
Results
Demographic Data and Conventional MR Imaging
The demographic data and MR imaging features are summarized in Table 1. All 19 tumors were in the supratentorial region. Eight APXAs (8/9, 88.9%) and 9 PXAs (9/10, 90%) were superficial (on the surface of the brain parenchyma). There was no significance in the tumor location between PXA and APXA groups.
The demographic data and conventional MR imaging characteristics of PXA and APXA
On the preoperative imaging, the lesion was significantly larger in patients with APXA than in those with PXA (4.7 ± 0.6 cm versus 3.1 ± 1.1 cm, P = .001). Peritumoral edema was observed in 7 PXA cases and 9 APXA cases, respectively. Eight patients with APXA (8/9, 88.9%) and 4 with PXA (4/10, 40.0%) had obvious peritumoral edema (defined as >1 cm in diameter). The maximum diameter of peritumoral edema in the APXA group was significantly larger than that in the PXA group (P = .008). The presence of heterogeneous enhancement of solid portions was observed less frequently in patients with PXA than in those with APXA (2/10 versus 8/9, P = .01). Leptomeningeal contact was seen in 7 APXA cases and 9 PXA cases.
Advanced MR Imaging Findings
Table 2 summarizes the findings of 17 cases with DWI and 9 cases with DSC-PWI. Compared with contralateral normal brain parenchyma, relatively high signal intensity on DWI was more likely to be present in cases with APXA (5/8, 62.5%) than in those with PXA (1/9, 11.1%) (P = .027). Moreover, the rADCmin values of APXA were significantly lower than those of PXA (1.0 ± 0.2 versus 1.5 ± 0.4; P = .008). On CBV maps, the rCBVmax values of APXA were significantly higher than those of PXA (2.6 ± 0.8 versus 1.6 ± 0.2; P = .036). Representative cases are shown in Figs 1⇓–3.
Comparison of the PXA and APXA groups regarding the variables of interesta

A 24-year-old male patient with pleomorphic astrocytoma. T2WI (A) and contrast-enhanced T1WI (B) show a homogeneous contrast-enhancing solid tumor without perilesional edema located in the temporal lobe. C, A correlative ADC map shows the tumor with an elevated ADC value (rADCmin = 1.5). D, A corresponding color CBV image shows significantly increased perfusion with the calculated rCBVmax of 1.6.

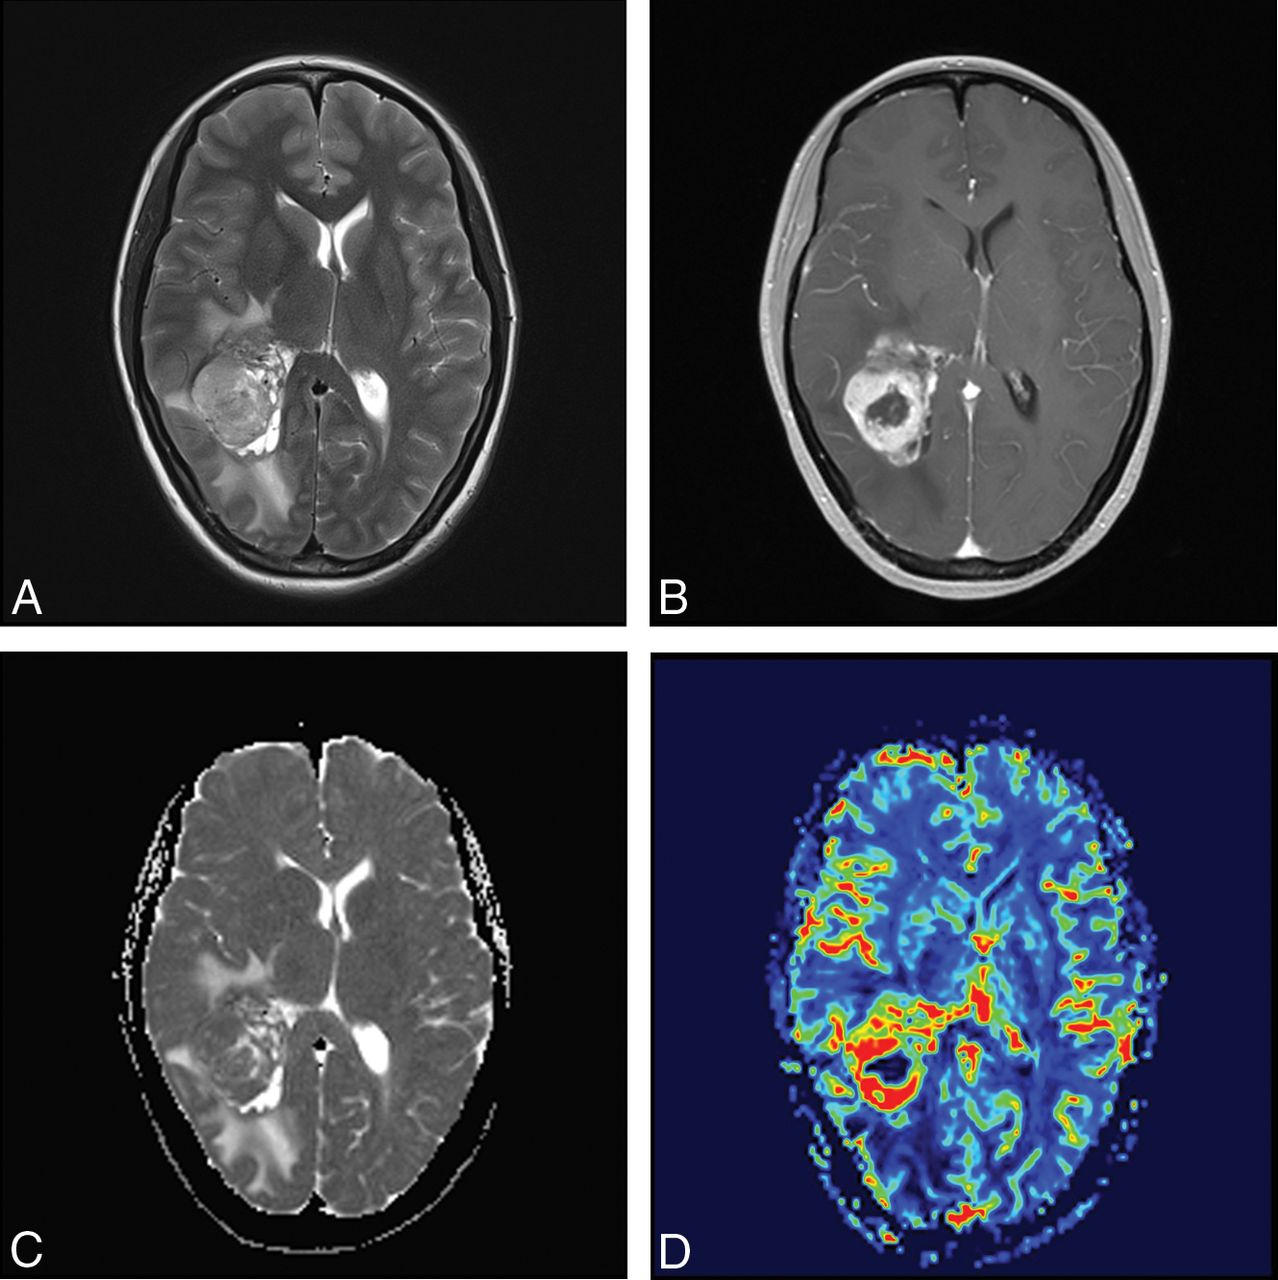
A 41-year-old female patient with anaplastic pleomorphic astrocytoma. T2WI (A) and contrast-enhanced T1WI (B) show a heterogeneous contrast-enhancing tumor with marked perilesional edema located in the occipital lobe. C, A correlative ADC map shows the lesion with a decreased ADC value (rADCmin = 0.97). D, A corresponding color CBV image shows significantly increased perfusion with a calculated rCBVmax of 4.01.

A 68-year-old female patient with anaplastic pleomorphic astrocytoma. T2WI (A) and contrast-enhanced T1WI (B) show a heterogeneous contrast-enhancing tumor with marked perilesional edema located in the parietal lobe. C, A correlative ADC map shows the lesion with diffusion restriction (rADCmin = 0.92).
Table 3 summarizes the MR imaging findings of APXA previously reported in the literature.20⇓⇓⇓⇓⇓–26,28⇓⇓⇓⇓⇓⇓–35
Summary of MR imaging findings of APXA previously reported in the literature
Discussion
Our results show that APXA had MR imaging features similar to those of other high-grade astrocytomas, namely more heterogeneous contrast enhancement, obvious peritumoral edema, lower rADCmin ratio on DWI, and higher rCBVmax ratio on DSC-PWI.
According to the 2016 WHO classification of the central nervous system, PXA is classified as a grade II astrocytoma histologically.8 Previous studies have found that PXAs may undergo spontaneous malignant transformation into high-grade gliomas across time without any treatment.12,22,36 In a study of the histologic evolution of the PXA, an abrupt transition from a typical PXA without mitoses to a clearly high-grade tumor was found in a repeat biopsy during long follow-up, which was considered a secondary malignant change on a pre-existing PXA.36 Thus, APXA (grade III astrocytoma) is more likely to be derived from a previous PXA with the development of anaplastic histologic features. In the present study, APXA accounted for 47.4% of the cases, which is much higher than the number previously reported by Giannini et al.7 However, the results reported by Hirose et al6 were that about 50% of PXAs showed anaplastic features, findings comparable with those in our study.
PXA most frequently occurred in children and young adults in our study, consistent with previous studies.1,5,37 In contrast, 6 of 9 patients with APXA were middle-aged adults (40–65 years of age) with a mean age of 47.7 years at their first presentation, which was discordant with previous studies.37 It has been reported that high-grade astrocytomas, including anaplastic astrocytoma and glioblastoma, were more common in older adults with a median age of 56–64 years.38⇓–40 However, most of the patients with APXA in our series were middle-aged adults and tended to be younger than those with other high-grade astrocytomas.
PXA is an overwhelming, superficial supratentorial tumor with a predilection for the temporal lobe. Previous studies reported that PXA occurred rarely in the cerebellum,37 hypothalamus,41 quadrigeminal plate,41 or pineal gland.42 Similar to PXA, almost all APXA tumors in our series showed a superficial location in the cerebral hemispheres with involvement of the superficial cortex and leptomeninges. Both PXA and APXA are believed to develop from subpial astrocytes, which partly explains why these 2 tumors preferably arise from superficial cortical sites.2 Our findings demonstrate that a superficial location with leptomeningeal contact was a frequent feature of APXA and PXA. In addition, our results show that the common tumor location of PXA was the temporal lobe (50.0%), which is in keeping with findings in previous studies.16,17
Conventional MR imaging can provide useful information regarding tumor size, contrast enhancement, peritumoral edema, necrosis, hemorrhage, and cystic degeneration, which are all helpful in characterizing tumor aggressiveness and evaluating tumor grading. In our study, we found that APXA had significantly greater tumor size than PXA, which may be due to the relatively high proliferative potential of APXA. Previous case reports demonstrated that APXA showed intense heterogeneous enhancement and obvious peritumoral edema on conventional MR imaging.21,34 In our study, we also found that all except 1 APXA showed heterogeneous contrast enhancement with marked peritumoral edema. In contrast, only 2 PXA cases showed heterogeneous enhancement, and 3 cases had marked peritumoral edema. The enhancement pattern of APXA could be explained by the presence of necrosis, hemorrhage, and vascular proliferation within the tumor, which was observed in most APXAs by Rutkowski et al.11 Additionally, our cohort showed results similar to those in a previous study for the frequency of the peritumoral edema.20 In the study of Lim et al,20 all PXAs with anaplastic features (4 cases) had severe perilesional edema, while only 1 of 18 PXAs presented with severe peritumoral edema, 6 cases had none, 8 cases had mild edema, and 3 cases had moderate edema. Our study demonstrated that the area of peritumoral edema in APXA was larger than that in PXA. Peritumoral edema was defined as nonenhancing, T2-hyperintense regions surrounding the enhancing tumors, which represented a heterogeneous mixture of infiltrative neoplastic cells and vasogenic edema in other high-grade astrocytomas.43,44 Despite appearing as a circumscribed tumor, most PXAs demonstrated infiltration into the surrounding brain.7 However, the pathology of peritumoral “edema” in APXA remains uncertain. Further pathologic investigations are required to explore whether the peritumoral edema surrounding the APXA tumor represents vasogenic edema or tumor infiltration.
DWI has been described as a useful tool for glioma grading using ADC values, which negatively correlate with cellularity and the Ki-67 labeling index in tumors.45⇓–47 Only a few prior studies in the literature evaluated PXA and APXA using DWI.14 In a small group study of 11 children with PXA, Moore et al14 demonstrated that the mean ADC ratio of 6 PXAs, including 1 APXA, was 1.15, without statistical analysis. In the present study, we found that the signal intensity in the solid components of the APXA tended to be hyperintense relative to normal-appearing brain parenchyma on DWI. In addition, the signal intensity of APXA was significantly higher than that of PXA on DWI. The rADC ratio of PXA and APXA in our study was 1.29 ± 0.44, which was consistent with that in a recent study.14 To the best of our knowledge, the differences in ADC ratios between APXA and PXA have not been reported. Our study demonstrates that the rate of water diffusion of APXA, as reflected by the ADC ratio, was significantly lower than that of PXA. Compared with PXA, the association of lower ADC ratios in APXAs might be due to markedly high cellularity and a high nuclear/cytoplasmic ratio, which were also observed in other high grade astrocytomas. Therefore, our findings reveal that ADC could be a useful imaging parameter for assessing the differences between APXA and PXA based on distinct cell density and the nuclear/cytoplasmic ratio.
DSC-PWI has become an important tool in the preoperative characterization and grading of brain gliomas using rCBV values.48⇓⇓–51 Although many studies have reported that rCBV parameters were useful in astrocytoma grading, most of these studies failed to group APXA as a high-grade glioma or even to consider it as a separate cohort.51⇓⇓–54 To our knowledge, there are no studies assessing the differences in CBV values between APXA and PXA. Limited evidence suggested that the tumor vascularity of PXA was distinct from that in APXA. In a histopathologic study of PXA,6 4 of 6 APXAs showed microvascular proliferation, while no PXA exhibited this phenomenon. We found that the rCBVmax values of APXA and PXA were 2.6 ± 0.8 and 1.6 ± 0.2, respectively. The rCBVmax values of contrast-enhancing portions of APXA seemed to be higher than those of PXA. These preliminary findings may be explained by more microvascular proliferation in anaplastic lesions, resulting in an increase in the CBV value.6 However, the small number of patients did not allow making generalizations such as discrimination of APXA from PXA with DSC-PWI. Future investigations with emphasis on DSC-PWI of APXA and PXA may be of benefit.
In addition to the intrinsic limitations of a retrospective study, our study had several other limitations. First, the number of patients with advanced MR imaging remained limited; therefore, the conclusions should be interpreted with caution, especially for DSC-PWI. Future studies of larger cohorts with advanced MR imaging are necessary to generalize these findings. Second, the patients with APXA seemed to be older than those with PXA, but the difference was not significant, possibly due to the small size of this study. Hence, the difference in age may affect the values of CBV and ADC. However, these parameters of the tumors were normalized by contralateral normal-appearing brain parenchyma to reduce intersubject variance including age and sex. Third, we only focused on imaging appearances and parameters, but there is a lack of a direct pathologic correlation. Therefore, we cannot state with certainty whether the imaging parameters represent true pathophysiologic information of the tumor. Thus, further prospective study with strict pathologic validation is recommended.
Conclusions
APXA can present with more aggressive conventional and advanced MR imaging features, mimicking high-grade astrocytoma at initial diagnosis, than PXA. Greater maximum tumor diameter, heterogeneous contrast enhancement, obvious peritumoral edema, and lower rADCmin and higher rCBVmax are more common features in APXA compared with PXA. DWI and DSC-PWI might be useful in the characterization and differentiation of APXA and PXA.
Footnotes
The first two authors contributed equally to this study.
This work was supported by the Leading Project of the Department of Science and Technology of Fujian Province (No. 2016Y0042).
Indicates open access to non-subscribers at www.ajnr.org
References
- 1.
- 2.
- 3.
- 4.
- 5.
- 6.
- 7.
- 8.
- 9.
- 10.
- 11.
- 12.
- 13.
- 14.
- 15.
- 16.
- 17.
- 18.
- 19.
- 20.
- 21.
- 22.
- 23.
- 24.
- 25.
- 26.
- 27.
- 28.
- 29.
- 30.
- 31.
- 32.
- 33.
- 34.
- 35.
- 36.
- 37.
- 38.
- 39.
- 40.
- 41.
- 42.
- 43.
- 44.
- 45.
- 46.
- 47.
- 48.
- 49.
- 50.
- 51.
- 52.
- 53.
- 54.
- Received November 20, 2017.
- Accepted after revision April 18, 2018.
- © 2018 by American Journal of Neuroradiology