Abstract
BACKGROUND AND PURPOSE: Disappearance of T2 lesions into CSF spaces is frequently observed in patients with MS. Our aim was to investigate temporal changes of cumulative atrophied brain T2 lesion volume and 10-year confirmed disability progression.
MATERIALS AND METHODS: We studied 176 patients with relapsing-remitting MS who underwent MR imaging at baseline, 6 months, and then yearly for 10 years. Occurrence of new/enlarging T2 lesions, changes in T2 lesion volume, and whole-brain, cortical and ventricle volumes were assessed yearly between baseline and 10 years. Atrophied T2 lesion volume was calculated by combining baseline lesion masks with follow-up CSF partial volume maps. Ten-year confirmed disability progression was confirmed after 48 weeks. ANCOVA detected MR imaging outcome differences in stable (n = 76) and confirmed disability progression (n = 100) groups at different time points; hierarchic regression determined the unique additive variance explained by atrophied T2 lesion volume regarding the association with confirmed disability progression, in addition to other MR imaging metrics. Cox regression investigated the association of early MR imaging outcome changes and time to development of confirmed disability progression.
RESULTS: The separation of stable-versus-confirmed disability progression groups became significant even in the first 6 months for atrophied T2 lesion volume (140% difference, Cohen d = 0.54, P = .004) and remained significant across all time points (P ≤ .007). The hierarchic model, including all other MR imaging outcomes during 10 years predicting confirmed disability progression, improved significantly after adding atrophied T2 lesion volume (R2 = 0.27, R2 change 0.11, P = .009). In Cox regression, atrophied T2 lesion volume in 0–6 months (hazard ratio = 4.23, P = .04) and 0–12 months (hazard ratio = 2.41, P = .022) was the only significant MR imaging predictor of time to confirmed disability progression.
CONCLUSIONS: Atrophied T2 lesion volume is a robust and early marker of disability progression in relapsing-remitting MS.
ABBREVIAITONS:
- CDP
- confirmed disability progression
- EDSS
- Expanded Disability Status Scale
- LV
- lesion volume
- PBVC
- percentage brain volume change
- PCVC
- percentage cortical volume change
- PVVC
- percentage ventricles volume change
- RRMS
- relapsing-remitting MS
For decades, appearance or accumulation of new or enlarging brain lesions or changes in lesion volume (LV) on MR imaging have been used as primary end points in Phase II clinical trials and as secondary end points in Phase III trials in multiple sclerosis.1⇓–3 However, lesion activity and accumulation correlate poorly with clinical evolution in the mid- to long-term1,4⇓⇓⇓–8; thus, measurement of brain atrophy has been introduced as a meaningful indicator of neurodegeneration and clinical disease progression in patients with MS.9⇓⇓–12 However, there is a further need to investigate and develop new MR imaging outcomes that can detect early changes associated with mid- to long-term disease progression in patients with MS.
One such newly proposed surrogate imaging biomarker of disease progression is the rate of brain lesion loss due to atrophy (atrophied T2-LV), which represents areas of lesional tissue having been replaced by CSF at subsequent time points, either through direct transformation or by displacement due to substantial atrophy-related local movement (Figure).13,14 The MS lesions at a closer distance to the inner and outer surfaces of the brain (located around ventricles or the subpial region of the cortex) are particularly vulnerable to disease pathology, likely in part due to the vicinity of CSF-mediated factors.15 It has been previously reported that the accumulation of atrophied brain T2-LV occurs mostly in the periventricular region but also, to some degree, in the cortical portions of the brain.13 Thus, it can be hypothesized that atrophied T2-LV measures the most vulnerable portion of lesion tissue shrinkage/destruction across time in these areas. Dwyer et al13 investigated the independent predictive value of atrophied T2-LV for the development of clinical disability in 174 patients with MS and 18 patients with clinically isolated syndrome and found that atrophied T2-LV was higher in patients with progressive MS, compared with those with relapsing-remitting (RR) MS or clinically isolated syndrome subtypes and explained significant additional variance in predicting disability, even when controlling for both new/enlarging lesion activity and whole-brain atrophy.

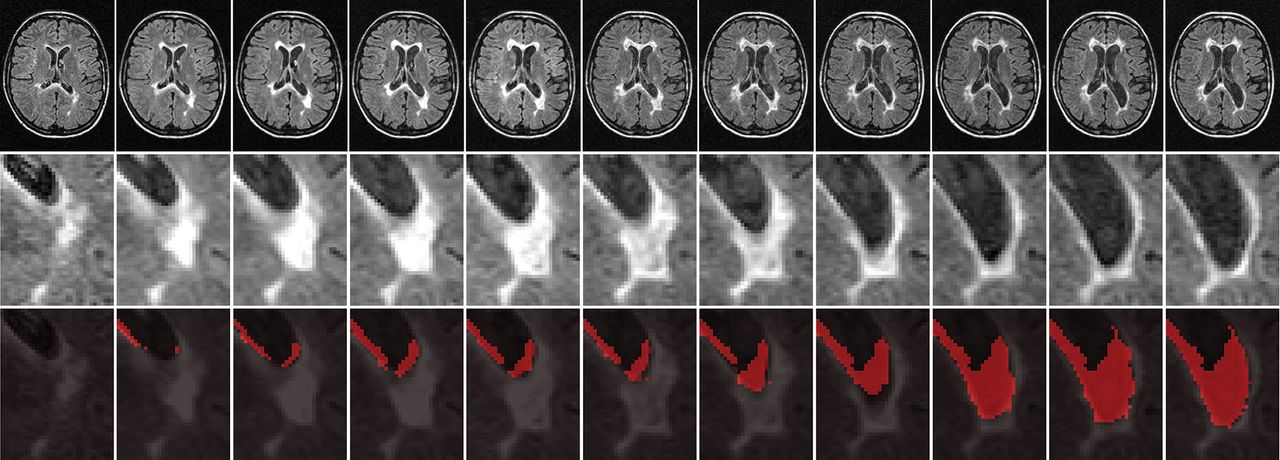
Representative example of a serially enlarging and then atrophying lesion. The upper row shows raw T2-FLAIR images from baseline to 10-year follow-up in 1-year increments, and the middle row provides an enlarged view of the relevant lesion. In the lower row, cumulative atrophied lesion volume is shown for the same area, in which red voxels indicate regions that were lesions at any prior time point and are CSF at the current time point.
In this study, we aimed to investigate temporal changes of atrophied T2-LV and disease progression, using a well-established cohort of patients with early RRMS who participated in a previous clinical trial,16 and its long-term open-label 10-year extension,8,17,18 using serial MR imaging.
Materials and Methods
Patient Population
This study of atrophied T2-LV in RRMS used a patient cohort in the 10-year Avonex-Steroid-Azathioprine (ASA) study from the Charles University, Prague, Czech Republic, in which clinical and MR imaging outcomes were previously reported.8 In the ASA study, 181 patients with early RRMS were initially enrolled into the 2-year double-blind, placebo-controlled phase16 and subsequently in its 5-year17,18 and 10-year8 open-label extensions. At the 10-year follow-up, 176 (97.2%) of the initial 181 patients were assessed.8 Two patients died (1 due to ovarian cancer and 1 due to myocardial infarction), and 3 moved outside the area.8 The treatment characteristics of the studied cohort are reported in the On-line Appendix.
As previously reported,8 all patients were clinically assessed using the Expanded Disability Status Scale (EDSS) every 2 months during the first year and then every 3 months until year 10. MR imaging assessments were performed at baseline, 6 months, and yearly intervals at least 14 days after the last administration of any steroid treatment.
The study was approved by the Medical Ethics Committees, and all patients gave their written informed consent.
MR Imaging Acquisition and Analysis
All MR imaging assessments were performed using the same Gyroscan Intera 1.5T scanner (Philips Medical Systems, Best, the Netherlands), which did not undergo major hardware upgrades during a 10-year period. Axial brain images were obtained using nongapped FLAIR with a 1.5-mm thickness and axial 3D T1-weighted images with a 1-mm slice thickness.
The image analysis for this study included calculation of atrophied T2-LV, as previously described.13 Briefly, the acquired images were preprocessed with N419 to remove spatially varying intensity inhomogeneities, standardized using a piecewise histogram-matching technique,20 and linearly aligned to the baseline space using the FMRIB Linear Image Registration Tool (FLIRT; http://www.fmrib.ox.ac.uk/fsl/fslwiki/FLIRT).21 3D-T1 images were then inpainted using FSL's Lesion Filling Tool (https://fsl.fmrib.ox.ac.uk/fsl/fslwiki/lesion_filling) to mitigate the impact of hypointense lesions on segmentation.22 To calculate atrophied T2-LV, we overlaid rigidly aligned follow-up FSL SIENAX CSF maps (http://fsl.fmrib.ox.ac.uk/fsl/fslwiki/SIENA) on baseline T2 lesion masks. Voxelwise follow-up CSF partial volume was then integrated over the baseline lesion regions to determine the total volume of periventricular and the nonperiventricular lesion tissue subsequently replaced by CSF (Figure).13 The reliability of the atrophied T2-LV measurement was previously reported.13
T2 lesion and whole-brain, cortical, and ventricle brain volume analyses are described in the On-line Appendix.
Statistical Analysis
Statistical analysis was conducted using SPSS (Version 23.0; IBM, Armonk, New York). Demographic and clinical characteristics were compared between patients with MS with a 10-year stable disease course and those with confirmed disability progression (CDP) using the Student t test, χ2 test, and Mann-Whitney rank sum test. ANCOVA adjusted for age, sex, and treatment change was used to compare MR imaging changes among the study groups during 10 years. Variables were checked for normality both visually and using Shapiro-Wilk tests.
The CDP (confirmed after 48 weeks) was defined as any 1.0-point sustained increase in the EDSS score in patients who had a baseline EDSS score of ≥1.0 or any ≥1.5-point increase in patients who had a score of 0.8 To facilitate survival analysis, we designated the time to event as the time in months between baseline and the point of disability progression (confirmed after 48 weeks). Patients who did not show disability progression were censored at the 10-year mark (confirmed at 48 weeks).
To explore the association between atrophied T2-LV and other MR imaging outcomes with CDP, we used both univariate and multivariable logistic regression analyses. To determine the unique additive variance explained by atrophied T2-LV in association with CDP in addition to other MR imaging metrics, we used a full hierarchic regression model, with age, sex, and MR imaging outcomes entered in the first model and atrophied T2-LV added as a second step. This nested model was compared using a likelihood ratio test. Multicollinearity was assessed using the variance inflation factor, with a variance inflation factor of <5 being considered acceptable.
Cox regression was used to analyze the association of early MR imaging outcome changes (0–6 and 0–12 months) and time to development of CDP. The hazard ratio of models with lesion measures as the predictor represent an increase in risk of progression with 1 new/enlarging lesion or a 1-mL change in lesion volume, while models with percentage brain volume change (PBVC), percentage cortical volume change (PCVC), and percentage ventricles volume change (PVVC) as the predictors represent the increase in risk of progression with a 1% change in brain volume. Subsequently, Kaplan-Meier analysis was performed when groups were classified using receiver operating characteristic curve analysis to determine cutoff points of the MR imaging variables at 80% specificity in predicting CDP (confirmed after 48 weeks). Results are reported as the cutoff point value, area under the curve, and sensitivity.
The Benjamini-Hochberg correction was used to control the false discovery rate, and corrected P values < .05 were considered significant using 2-tailed tests.23
Results
Demographic and Clinical Characteristics
Table 1 shows baseline and follow-up demographic and clinical characteristics, according to the CDP status for the 176 evaluable patients assessed at the 10-year follow-up, as previously reported.8 At the 10-year follow-up, 100 (56.8%) patients with MS developed CDP and 76 (43.2%) remained stable. The median time to disability progression (confirmed after 48 weeks) was 48.6 months (interquartile range, 24.2–72.9 months).
Demographic and clinical characteristics at baseline and during the follow-up in 176 patients with MS, according to the confirmed disability progression status at the 10-year follow-up
MR Imaging Characteristics at Baseline and at 10-Year Follow-Up
On-line Table 1 shows MR imaging baseline and follow-up characteristics in 176 patients with MS, according to CDP status at the 10-year follow-up. At baseline, there were no significant differences between the stable and CDP groups for T2-LV (P = .076), normalized whole-brain volume (P = .523), normalized cortical volume (P = .879), or normalized ventricle volume (P = .573). During 10 years, patients with RRMS accumulated 3.83 mL of T2-LV, 19.5 new/enlarging T2 lesions, and 1.11 mL of atrophied T2-LV. The average PBVC was −6.52%, PCVC was −7.0%, and PVVC was 42%. Atrophied T2-LV (0.68 versus 1.54 mL, P < .001), PBVC (−5.23% versus −7.52%, P < .001), PCVC (−6.22% versus −7.71%, P = .001), and PVVC (32.4% versus 49.7%, P = .001) differed between patients with MS with stable disease and those with CDP at the 10-year mark of the follow-up, whereas absolute change in T2-LV (2.89 versus 4.59 mL, P = .190) and accumulation of new/enlarging T2 lesions (18.67 versus 20.03, P = .753) did not.
Serial MR Imaging Changes during 10-Year Follow-Up
On-line Tables 2 and 3 and On-line Figure A, -B show serial cumulative changes of new/enlarging T2 lesions and absolute T2-LV changes during the 10-year follow-up. No differences for accumulation of new/enlarging T2 lesions or absolute changes of T2-LV were found between stable and CDP groups at any time point of the study.
Tables 2 and 3 and On-line Figure C, -D show serial changes of PBVC and cumulative atrophied T2-LV. The separation of stable-versus-CDP groups became significant even in the first 6 months for atrophied T2-LV (140% difference, Cohen d = 0.54, P = .004) and remained significant across all time points (between 72.2% and 162% difference, P ≤ .007), while the difference for PBVC became significant only at the 2-year follow-up (50.5% difference, Cohen d = 0.36, P = .022) and remained significant across all remaining time points (between 40.3% and 69.6% difference, P ≤ .01).
Time course of cumulative atrophied T2 lesion volume on serial MRI in patients with MS, according to the confirmed disability progression status at the 10-year follow-upa
Time course of whole-brain atrophy on serial MRI in patients with MS, according to the confirmed disability progression status at the 10-year follow-up
On-line Tables 4 and 5 and On-line Figure E, -F show serial changes of PCVC and PVVC. The separation of stable-versus-CDP groups became significant only at 5 years for PCVC (31.6% difference, Cohen d = 0.44, P = .008) and remained significant across the remaining time points, while the difference for PVVC became significant at the 2-year follow-up (50.8% difference, Cohen d = 0.38, P = .025) and remained significant across all remaining time points.
On-line Tables 6 and 7 show the time course of atrophied T2-LV and PBVC between different consecutive MR imaging time points in patients with MS, according to the CDP at the 10-year follow-up. The atrophied T2-LV was able to differentiate patients with stable MS from those who developed CDP at all time points (P ≤ .012) except for periods of 24–36 months (P = .190), 36–48 months (P = .075), and 84–96 months (P = .061), whereas no significant changes were observed for PBVC, PCVC, and PVVC.
Association of Atrophied Brain T2-LV with Other MR Imaging Outcomes and Confirmed Disability Progression
In univariate regression analysis, T2-LV at baseline (R2 = 0.40, P < .001), new/enlarging T2 lesion accumulation during 10 years (R2= 0.39, P < .001), PBVC loss during 10 years (R2 = 0.30, P < .001), PVVC during 10 years (R2 = 0.13, P = .002), PCVC during 10 years (R2 = 0.20, P < .001), and absolute change in T2-LV during 10 years (R2 = 0.25, P < .001) were associated with cumulative atrophied T2-LV during 10 years. In a multivariable stepwise regression model, T2-LV at baseline, new/enlarging T2 lesion accumulation during 10 years, and PBVC during 10 years were associated with atrophied T2-LV at 10 years (overall adjusted model, R2 = 0.54, P < .001).
In univariate logistic regression analysis, atrophied T2-LV (R2= 0.21), PBVC (R2 = 0.13), PVVC (R2= 0.13), and PCVC (R2 = 0.07) were each significantly associated with CDP at 10 years, while absolute T2-LV change (R2 = 0.012) and accumulation of new/enlarging T2 lesions (R2 = 0.011) were not. In a multivariable logistic regression model including all MR imaging measures significant in univariate analysis, the final model predicting CDP included only atrophied LV (R2= 0.25, variance inflation factor ≤ 1.7, P = .04).
In the hierarchic regression model, including all MR imaging measures predicting CDP at 10 years except atrophied T2-LV, the adjusted Nagelkerke R2 was 0.16. When we added atrophied T2-LV during 10 years to the model, the model was significantly improved (R2 = 0.27, R2 change 0.11, variance inflation factor ≤ 2.5, P = .009).
Early MR Imaging Outcome Predictors (0–6 and 0–12 Months) of Time to Confirmed Disability Progression
Table 4 shows the value of early MR imaging predictor measures (0–6 and 0–12 months) in predicting CDP using survival models.
Early MRI predictors (0–6 and 0–12 mo) of time to confirmed disability progression status using Cox regression analysis and Kaplan-Meier survival analysisa
In Cox regression analysis, only atrophied T2-LV showed a significant association with time to CDP in 0–6 months (hazard ratio = 4.23, P = .04) and 0–12 months (hazard ratio = 2.41, P = .022), while no significant changes were observed for new/enlarging T2 lesions and absolute change in T2-LV, PBVC, PCVC, or PVVC.
By means of Kaplan-Meier survival analysis based on cutoff points at 80% specificity in predicting CDP, only increased atrophied T2-LV in 0–6 months showed a significant association with time to CDP (cutoff = 0.09 mL, P = .017), while this association did not remain significant for 0–12 months after correction for multiple comparisons (cutoff = 0.18 mL, P = .076).
Discussion
The main study findings are that cumulative atrophied T2-LV showed a robust association with development of 10-year CDP and that this association was maintained across all time points with an effect size similar to that of whole-brain, cortical, and central atrophy. In addition, atrophied T2-LV was associated with the development of 10-year CDP for most consecutive time points, which was not the case for whole-brain, cortical, and central atrophy. Atrophied T2-LV was the only MR imaging predictor that showed an association with time to CDP after only 6 months of follow-up, whereas it took 2 years for whole-brain and central atrophy and 5 years for cortical atrophy to show a comparable effect. Finally, we extended preliminary findings from a recent study that showed that atrophied T2-LV can significantly add to the prediction of midterm disability, even when accounting for the accumulation of new and enlarging T2 lesions and T2-LV and development of whole-brain, cortical, and central atrophy.13
An overall increase in T2-LV stems from a combination of the development of new lesions and the enlargement of pre-existing ones. Reductions with time are also possible following either complete resolution or shrinkage of lesions due to beneficial processes of remyelination and repair.24⇓–26 However, accumulation of lesions in patients with MS shows a limited association with disease progression because new and old lesions alike may be partially or entirely destroyed by atrophy. This phenomenon may account for some of the commonly observed plateauing of the lesion burden and ultimate decline in the most advanced disease stages.1,5,6,9,12,26,27 In the current study, we found that all conventional MR imaging measures were similarly associated with the cumulative atrophied T2-LV, including baseline T2-LV, accumulation of new/enlarging T2 lesions, change in T2-LV, and development of whole brain, cortical, and central atrophy. These findings confirm that although atrophied T2-LV is influenced by both ongoing lesion accrual and brain atrophy, it appears to provide unique or complementary information beyond these individual MR imaging outcomes because these conventional outcomes combined explained only about 54% of the variance in the atrophied T2-LV. The lesion loss due to atrophy was less visually apparent than the accumulation or enlargement of new lesions (Figure) but was similar to that of brain atrophy. In terms of magnitude, although change in atrophied T2-LV represented only about 30% of the change in total T2-LV, its relation to long-term CDP was much stronger. In addition, in line with the results from the previous study in which we found that the rate of atrophied and new T2-LV accumulation was similar in patients with RRMS but almost double in patients with progressive MS,13 atrophied T2-LV accumulation in the current study was accelerated from years 5 to 10 of follow-up, whereas accumulation of total T2-LV decelerate in the same time period (On-line Figure, Tables 2 and 3, and On-line Tables 5 and 6). This temporal evolution profile makes this MR imaging outcome of particular interest for use in monitoring the transition from relapsing to progressive forms of MS.
At 10 years, the cumulative atrophied T2-LV was 1.54 mL in the CDP and 0.68 mL in patients with stable MS, which represents a 126.5% difference with an effect size of 0.58. This was similar to the PBVC, PCVC, and PVVC between baseline and 10 years. However, the development of brain atrophy was not associated in the first 2 years of follow-up with the development of 10-year CDP, while atrophied T2-LV showed robust differences already at 6, 12, and 24 months of follow-up. In addition, when between-serial-time-point changes were examined with 10-year CDP, the atrophied T2-LV was significantly associated with nearly all consecutive time points, except for 24–36, 36–48, and 84–96 months, while the PBVC, PCVC, and PVVC were associated with neither one. These findings make atrophied T2-LV a potentially more attractive MR imaging outcome for clinical monitoring on a year-to-year basis in comparison with the development of brain atrophy or lesion accrual. In line with numerous previous studies, accumulation of new and enlarging T2 lesions and T2-LV was not associated with long-term CDP.1,4⇓⇓⇓–8,28
Because atrophied T2-LV is a product of both inflammation (in the form of lesion accrual) and neurodegeneration (in the form of brain atrophy development), this MR imaging measure may add more value in predicting CDP than other MR imaging measures reflecting only a single aspect of pathophysiologic progression, as previously reported.13 In a multivariable model exploring the association with 10-year CDP status, only atrophied T2-LV was retained and explained 25% of the variance, while in the hierarchic regression model that included all MR imaging measures significant in univariate analyses, atrophied T2-LV significantly improved the explained variance by 11%, which was highly significant (P = .009).
Establishing an MR imaging outcome that can early and reliably define which individual patients with MS will develop CDP during the long term has remained elusive in MS research for many years.2,6,9⇓⇓–12,18,24⇓⇓–27,29,30 The results of the Cox regression analysis in the present study suggest that atrophied T2-LV could be a good candidate for such an endeavor. In the first 6 months of follow-up, the risk of time to conversion to CDP was already 4.23 times higher for each milliliter of atrophied T2-LV increase in CDP compared with patients with stable MS, and 2.41 times higher in 0–12 months. No other MR imaging outcomes were able to predict the risk to time of CDP in the first 12 months in the present study. In the Kaplan-Meier analysis, we determined that cumulative atrophied T2-LV of 0.09 mL in the first 6 months or 0.18 mL in the first 12 months had a cutoff of 80% specificity and around 40% sensitivity to predict time to CDP, while no other MR imaging outcomes were significantly associated with time to development of CDP.
The association between atrophied T2-LV and CDP suggests that the role of lesion tissue pathologically replaced by CSF has to be further explored using more sophisticated voxelwise studies. In line with a previous study,13 we observed that atrophied T2-LV was most frequently located in periventricular regions and at the cortical gyri borders that atrophied to displace sulci CSF and replace parts of the lesions. In addition, because we did not use MR imaging acquisitions specifically for the detection of cortical lesions,31,32 the true prevalence of atrophied T2-LV in cortical regions may be largely underestimated. Therefore, atrophy-related local lesion movement into cortical sulci has to be further explored using more sophisticated voxelwise studies.
There are a number of limitations that have to be considered. There was a relatively high percentage of patients in the “stable” group in this study during 10 years. This might imply that the population consisted of patients having a more benign MS course or it might be related to the high compliance to disease-modifying therapies. The pathologic specificity of the transition of lesions to the CSF tissue has to be further explored using nonconventional MR imaging measures.1,10,11,26,30 A serial ultra-high-field MR imaging may also be preferred for investigating the pathophysiologic processes leading to the loss of lesions surrounded by parenchyma in cortical regions. We did not explore what portion of the atrophied T2-LV is represented by T1-hypointense black hole lesions, which have a higher rate of tissue destruction into the CSF.33,34 Another issue to be clarified is the effect of therapy-induced pseudoatrophy on atrophied T2-LV.9,10,12,35
Conclusions
Atrophied T2-LV is a robust and early marker of disease progression associated with long-term disease progression in patients with RRMS.
Footnotes
Disclosures: Robert Zivadinov—UNRELATED: Consultancy: Celgene, Genzyme-Sanofi, Novartis, EMD Serono; Grants/Grants Pending: Celgene, Genzyme-Sanofi, Novartis, Mapi Pharma, Protembo*; Payment for Lectures Including Service on Speakers Bureaus: Celgene, Genzyme-Sanofi, Novartis, EMD Serono. Dana Horakova—RELATED: Grant: Czech Ministry of Education project PROGRES-Q27/LF1*; UNRELATED: Consultancy: Biogen Idec, Novartis, Merck & Co, Bayer, Sanofi Genzyme, Roche, Teva Pharmaceutical Industries, Comments: compensation for travel, speaker honoraria, and consultant fees, as well as support for research activities from Biogen Idec; Payment for Lectures Including Service on Speakers Bureaus: Biogen Idec, Novartis, Merck & Co, Bayer, Sanofi Genzyme, Roche, Teva Pharmaceutical Industries, Comments: compensation for travel, speaker honoraria, and consultant fees, as well as support for research activities from Biogen Idec. Deepa P. Ramasamy—RELATED: Other: The original ASA study was an investigator-initiated study that was supported by the Czech Ministries of Education and Health (PROGRES-Q27/LF1, RVO-VFN 64165 and NV 18–04-00168). The MRI acquisition part of the study was supported by Gedeon Richter and Biogen Idec. The atrophied lesion volume analysis part of the study was supported by the Buffalo Neuroimaging Analysis Center.* Tomas Uher—UNRELATED: Grants/Grants Pending: Biogen, Sanofi, Comments: GZ-2017–11718 Sanofi*; Payment for Lectures Including Service on Speakers Bureaus: Biogen, Novartis, Roche*; Travel/Accommodations/Meeting Expenses Unrelated to Activities Listed: Novartis, Roche, Merck & Co, Biogen, Sanofi.* Manuela Vaneckova—RELATED: Grant: Ministry of Health grants RVO-VFN64165 and NV18–04-00168*; UNRELATED: Board Membership: Biogen Idec; Consultancy: Biogen Idec; Grants/Grants Pending: RVO-VFN 64165; Payment for Lectures Including Service on Speakers Bureaus: Biogen Idec, Novartis, Merck & Co, Teva Pharmaceutical Industries; Travel/Accommodations/Meeting Expenses Unrelated to Activities Listed: Biogen Idec, Novartis, Sanofi Genzyme, Merck & Co. Michael G. Dwyer—UNRELATED: Consultancy: EMD Serono, Claret Medical; Grants/Grants Pending: Novartis.* Eva Havrdova—UNRELATED: Consultancy: Actelion, Biogen, Celgene, Novartis, Merck & Co, Roche, Sanofi; Payment for Lectures Including Service on Speakers Bureaus: Actelion, Biogen, Celgene, Novartis, Merck & Co, Roche, Sanofi, Teva Pharmaceutical Industries. *Money paid to the institution.
The original ASA study was an investigator-initiated study supported by the Czech Ministries of Education and Health (PROGRES-Q27/LF1, RVO-VFN 64165 and NV 18-04-00168). The MRI acquisition part of the study was supported by Gedeon Richter and Biogen Idec. The atrophied lesion volume analysis part of the study was supported by the Buffalo Neuroimaging Analysis Center.
References
- 1.
- 2.
- 3.
- 4.
- 5.
- 6.
- 7.
- 8.
- 9.
- 10.
- 11.
- 12.
- 13.
- 14.
- 15.
- 16.
- 17.
- 18.
- 19.
- 20.
- 21.
- 22.
- 23.
- 24.
- 25.
- 26.
- 27.
- 28.
- 29.
- 30.
- 31.
- 32.
- 33.
- 34.
- 35.
- Received January 3, 2019.
- Accepted after revision January 15, 2019.
- © 2019 by American Journal of Neuroradiology