Abstract
BACKGROUND AND PURPOSE: Cerebral small vessel disease contributes to stroke and cognitive impairment and interacts with Alzheimer disease pathology. Because of the small dimensions of the affected vessels, in vivo characterization of blood flow properties is challenging but important to unravel the underlying mechanisms of the disease.
MATERIALS AND METHODS: A 2D phase-contrast sequence at 7T MR imaging was used to assess blood flow velocity and the pulsatility index of the perforating basal ganglia arteries. We included patients with cerebral amyloid angiopathy (n = 8; identified through the modified Boston criteria), hypertensive arteriopathy (n = 12; identified through the presence of strictly deep or mixed cerebral microbleeds), and age- and sex-matched controls (n = 28; no cerebral microbleeds).
RESULTS: Older age was related to a greater pulsatility index, irrespective of cerebral small vessel disease. In hypertensive arteriopathy, there was an association between lower blood flow velocity of the basal ganglia and the presence of peri-basal ganglia WM hyperintensities.
CONCLUSIONS: Our results suggest that age might be the driving factor for altered cerebral small vessel hemodynamics. Furthermore, this study puts cerebral small vessel disease downstream pathologies in the basal ganglia region in relation to blood flow characteristics of the basal ganglia microvasculature.
ABBREVIATIONS:
- BG
- basal ganglia
- CAA
- cerebral amyloid angiopathy
- cSS
- cortical superficial siderosis
- CSVD
- cerebral small vessel disease
- EPVS
- enlarged perivascular spaces
- HA
- hypertensive arteriopathy
- ICH
- intracerebral hemorrhage
- MBs
- microbleeds
- PC
- phase-contrast
- PI
- pulsatility index
- Vmean
- mean blood flow velocity
- WMH
- WM hyperintensities
Awareness of sporadic cerebral small vessel disease (CSVD) is growing due to its involvement in hemorrhagic1 and ischemic stroke,2 cognitive impairment,3,4 as well as the overlap between vascular and Alzheimer disease pathology.5,6 CSVD affects brain vessels of <1 mm and can be detected in vivo mainly by various downstream pathology neuroimaging markers, ie, microbleeds (MBs), cortical superficial siderosis (cSS), WM hyperintensities (WMH), lacunes, enlarged perivascular spaces (EPVS), and microinfarcts.7 MR imaging markers of CSVD8⇓-10 and pathologic evidence of remodeling of the small-vessel wall can be found in older adults without any CSVD-related symptoms and also in the absence of vascular risk factors.11
The 2 common subtypes of sporadic CSVD are cerebral amyloid angiopathy (CAA) and hypertensive arteriopathy (HA). CAA and HA have different distributions: CAA affects mainly the cortical and leptomeningeal vessels, while HA affects the deep perforating ones.12⇓-14
The pathologic manifestations of CSVD (eg, loss of smooth-muscle cells and amyloid-β accumulation in CAA, lipohyalinosis, fibrinoid necrosis) result in remodeling and stiffening of the vessel walls.2,15 Animal studies suggest that this, subsequently, contributes to decreased microvascular blood flow velocity and alterations of pulsatility of the microvasculature.16⇓-18 Alterations of blood flow and pulsatility of small cerebral vessels are of pivotal pathophysiologic importance and could be related to blood-brain barrier dysfunction,19 clearance,20 and, thus, self-reinforcing mechanisms of CSVD advancement. While increased pulsatility in large cerebral arteries has been assessed in human studies, the use of 2D phase-contrast (PC) MR imaging at 7T21⇓-23 now allows recording blood flow velocity in the small penetrating vessels of the centrum semiovale and the basal ganglia (BG).
From these velocity traces, pulsatility can be quantified by calculating the pulsatility index (PI), considering maximum, minimum, and mean observed blood flow velocity in the small vessels.
An association between increased pulsatility in the large cerebral arteries and the burden of CSVD neuroimaging markers, namely WMH and EPVS, has recently been identified.24⇓-26 A previous study that used 2D PC MR imaging at 7T reported that patients with HA with symptomatic hemorrhagic or ischemic stroke presented with increased PI in the small BG vessels.27 However, apart from this single-site study, few data on the relationship between microvascular cerebral blood flow, pulsatility, age, and MR imaging CSVD downstream pathologies exist; these data could aid in a better understanding of the relationship between microvascular hemodynamics and tissue damage. It is important to assess the same measures in a different cohort with similar characteristics and from another study site. Most important, measuring blood flow in the small vessels could allow inferring conclusions about how blood flow velocity and PI relate to mechanisms such as blood-brain barrier leakage and clearance dysfunction. In addition, these measures have the potential to become early detection tools to target presymptomatic disease stages.
In this study, we used 2D PC MR imaging at 7T, measuring blood flow velocity and the pulsatility of the BG perforating arteries in a cohort that included patients with asymptomatic CSVD covering the spectrum of CAA and HA. Including CSVD imaging markers (MBs, WMH, lacunes, and EPVS) helped us to investigate the relationship between microvascular blood flow characteristics and CSVD downstream pathologies.
MATERIALS and METHODS
Participants
In the present study, we included 48 older adults (mean age, 71 [SD, 8.3] years; 40% women) recruited between December 2016 and July 2018.
Twenty of the participants were selected from a longitudinal 3T MR imaging study on the pathophysiology of CSVD, conducted by the University Clinic of Magdeburg and the German Center for Neurodegenerative Disease. The inclusion criterion for the 3T study was the presence of hemorrhagic CSVD markers, ie, MBs or cSS on MR imaging iron-sensitive sequences (gradient recalled-echo T2*-weighted or susceptibility-weighted imaging) on a prior clinical MR imaging performed for a diagnostic work-up (eg, due to headache, epileptic seizures, gait disturbances, cognitive impairment, and TIA). MBs (classified through their localization as strictly lobar, deep [BG, thalamus], or mixed28), cSS, and asymptomatic intracerebral hemorrhage (ICH) (hypointense lesions of >1 cm, deep or lobar) were confirmed on 3T iron-sensitive sequences. 3T MR imaging was further rated for the existence and severity of CSVD downstream pathologies in the region of the BG, including WMH following the peripheral outline of the BG (peri-BG WMH, existent/not existent, which were identified on a FLAIR sequence); deep lacunes (number; defined in T1-weighted sequence as fluid-filled, 3- to 15-mm large cavities in the BG29); and BG EPVS (severity: 0 = no EPVS; 1 = 1–10 EPVS; 2 = 11–20 EPVS; 3 = 21–40 EPVS; 4 = >40 EPVS; counted on a T2-weighted sequence).30 A specialist neurologist (S.S., with 10 years’ experience) performed the rating.
CAA was diagnosed by applying the modified Boston criteria, which define probable CAA by the presence of at least 2 lobar hemorrhages (ICH and/or MBs) or 1 lobar hemorrhage and at least focal cSS, which had an alternative cause, in patients 55 years of age or older.31 For a diagnosis of possible CAA, the presence of 1 lobar hemorrhage is sufficient.31 Patients with HA were identified through the presence of strictly deep MBs and/or ICHs or mixed deep and lobar MBs and/or ICHs.32
The remaining 28 participants were community-dwelling controls recruited from an existing pool of cognitively healthy volunteers at the German Center for Neurodegenerative Disease in Magdeburg without hemorrhagic CSVD markers on 3T MR imaging. Multiple WMH subcortical spots and grade I EPVS in the BG or centrum semiovale were allowed in all controls, because they represent a common finding in aging (Table 1).
Demographics of subjects and vascular risk factorsa
Participants with large-artery stenosis of the circle of Willis, genetic neurologic disease, and a history of psychiatric disease, alcohol or drug abuse, and cerebrovascular malformations were excluded from the study. No patient had a cardiac ejection fraction of <45%, whereas these data were not available for controls. Contraindications for scanning at 7T, according to the recommendations of the German Ultrahigh-Field Imaging Network, were considered and represented a further exclusion criterion from our study. Each participant was subject to a neurologic examination to detect undiagnosed neurologic conditions and further underwent an extensive neuropsychological test battery (Online Supplemental Data) to exclude severe dementia and depression, which can be a cause of pseudodementia. Cardiovascular risk factors were additionally recorded for all participants (Table 2). Arterial hypertension was identified when blood pressure exceeded 130/80 mm Hg. Diabetes mellitus was diagnosed as a fasting plasma glucose level of >7.0 mmol/L or >11.1 mmol/L 2 hours after a glucose tolerance test. Hyperlipidemia was defined as abnormal blood levels of low-density lipoprotein cholesterol (>2.6 mmol/L) and/or triglycerides (>1.7 mmol/L).
Neuroimaging markers of CSVDa
All participants provided written informed consent according to the Declaration of Helsinki and were compensated for travel costs. The study was approved by the University Clinic of Magdeburg Ethics Committee (93/17; 28/16).
7T MR Imaging
Scanning of all participants was performed on a whole-body 7T scanner (Siemens; “classic” 7T), equipped with a quadrature transmit and 32-channel receive head coil (Nova Medical). First, a T1-weighted sequence with 3D-MPRAGE (voxel size = 1 mm3 isotropic) was acquired for anatomic reference, to plan the acquisition of the 2D PC sequence and to individualize the BG as an ROI during imaging analysis. The parameters were the following: TE = 2.89 ms, TR = 2250 ms, flip angle = 5°, TI = 1050 ms, receiver bandwidth = 130 Hz/pixel, echo spacing = 8.3 ms, 3D matrix dimensions = 256 × 256 × 176. A generalized autocalibrating partially parallel acquisition was performed with an acceleration factor of 2 and 32 reference lines.
We implemented the previously described21,22 2D PC sequence on our scanner, using the multisite protocol as defined in the European Ultrahigh-Field Imaging Network for Neurodegenerative Diseases.33 The sequence was acquired in a single section at the level of the BG and was planned manually on sagittal images of the T1-weighted sequence so that it crossed the anterior commissure and was tangential to the genu and splenium of the corpus callosum (Fig 1A). Thus, we ensured that the single section was approximately perpendicular to the perforating arteries. The reproducibility of this method has been tested in previous studies.21 Sequence parameters were the following: voxel size = 0.3 × 0.3 × 2 mm,3 TE = 16.6 ms, TR = 27.6 ms, 2 segments (phase-encoding steps per cardiac cycle), flip angle = 45°, receiver bandwidth = 59 Hz/pixel. Encoding velocity was 20 cm/s in the direction perpendicular to the section. The sequence was retrospectively gated with an acquired temporal resolution of 110.5 ms, and blood flow velocity was reconstructed at 14 time points of the cardiac cycle (ie, approximately 71 ms for a heart rate of 60 beats per minute). The scan time for the 2D PC sequence was approximately 3 minutes at a heart rate of 60 beats per minute.

Image processing. Section position of the 2D phase-contrast acquisition through the BG was planned on the T1-weighted sequence (A). Mean magnitude image and determination of the ROI in which vessel detection was performed (B). Circles mark detected perforating vessels in the ROI, distinguishing between upward (blue) and downward (red) blood flow directions. Only vessels with an upward flow direction were considered (C), to ascertain inclusion of arteries only (no veins). V indicates velocity.
Image Processing
Quality control was performed by visual inspection of the scans by T.A., especially with regard to motion artifacts (ghosting, blurring). If motion caused extensive ghosting and blurring that would hamper the analysis, the subject was excluded. To process and analyze flow-encoded PC images, we used a Matlab (2015b; MathWorks) tool, developed at the University Medical Center of Utrecht.22 This tool performs several steps as described in more detail elsewhere.22,34 Briefly, perforating arteries were identified as voxels on the velocity map with nonzero mean velocity, using the following steps:34 First, a phase correction was applied on the background to make the mean velocity of tissue 0 cm/s by median-filtering the time-averaged velocity map and subtracting it from the velocity map of each cardiac time point. Then, velocity SNR maps were calculated from magnitude SNR estimates that were based on the SD of the magnitude over the cardiac cycle. Furthermore, given the velocity SNR, the 2-sided 95% velocity CIs were estimated for the mean blood flow velocity (Vmean) to enable consistent selection of vessels with significant flow (ie, nonzero Vmean with a statistical significance of .05). All voxels inside the BG mask without 0 cm/s within their CI of Vmean and hyperintense signal in the magnitude image were considered significant. Every group of neighboring significant voxels was defined as belonging to the same perforating artery. The voxel with the highest mean velocity of such a group was taken as representative of the perforating artery and used for further analysis.
Detection of perforating vessels was confined to the BG on both sides by manually segmenting the area delimitated by the ventricles, the interhemispheric fissure, and laterally by the insula (Fig 1B). Multiple detections of a single vessel and tangentially intersected vessels were manually excluded from the analysis by a neurologist (V.P., with 4 years of experience), and only vessels with an upward blood flow direction (positive velocity) were considered, to avoid inclusion of veins. In each subject, the generated output of the imaging analysis listed all detected perforators (ie, number of vessels), together with the velocity curves. The location of the detected vessels was visualized on the magnitude image (Fig 1C). Image processing was performed by V.P.
Statistics
Differences in risk factors between groups were calculated using the 1-way ANOVA or Kruskal-Wallis test when appropriate.
The blood flow velocity of each perforator at each of the 14 time points of the cardiac cycle was registered and averaged over all selected vessels, obtaining a mean velocity curve over the cardiac cycle for each subject. Averaging this mean velocity curve over the time points measured resulted in a Vmean in the subject’s perforators of both hemispheres.
Besides the mean velocity curve, we also computed the mean normalized velocity curve by averaging over the normalized velocity curves of all selected vessels. This normalization was performed to give each vessel an equal weight before determining the PI from the mean normalized velocity curve according to the following equation:

In this equation, Vmax is the maximum velocity; Vmin, the minimum velocity, and Vmean, the mean velocity of the mean normalized velocity curve (Vmean = 1 for normalized velocity curves but is still shown for clarity). The use of the averaged normalized curve to perform the PI calculation instead of calculating it in each single vessel was based on previous work that showed that with this method, the overestimation of PI due to noise was greatly reduced.
We further aimed to investigate the relationship between CSVD downstream pathologies in the region of the BG and the blood flow velocity and pulsatility of the BG perforating arteries. Quantile regression analysis was, therefore, performed, setting the mean velocity, PI, and number of detected vessels, respectively, as dependent variables and age, sex, group (CAA, HA, controls), number of deep MBs, the presence of peri-BG WMH, number of deep lacunes, and the severity grade of BG EPVS as independent variables. Quantile regression was applied to the whole cohort as a method of regression analysis robust against outliers and was able to understand the distribution of a continuous variable across different quantiles. We applied this method to calculate the 25th, 50th, and 75th quantiles. To determine to which participants’ group the effects were pertinent, we calculated the Spearman correlations for significant factors in each group separately. P values were adjusted for multiple comparisons using the Bonferroni method, accounting for the number of predictors (n = 7) in the quantile regression models and the number of subgroups (n = 3) for the Spearman correlations. Results were considered significant at P < .05. For all analyses described so far, the software R, Version 3.6.0 (www.R-project.org), was used.
To investigate possible differences in blood flow velocity of the perforating vessels between groups, we created a combined mean velocity curve of all subjects within a group. To this end, the method previously described by Geurts et al27 to synchronize all individuals was used and applied to the large vessels in the BG section. The large-vessel curves were obtained by selecting pixels in the image with the highest intensities, and the group mean velocity curve of the large vessels in the BG section was used for time lag synchronization. This mean large-vessel curve was iteratively updated with the synchronized personal velocity traces of the large vessels until no time lag changes occurred. These time lags were then used to synchronize each subject’s mean small-vessel velocity trace. After averaging, we obtained a group mean small-vessel velocity trace. Flow-velocity curves between subgroups with CSVD (CAA versus HA) and healthy controls were visually compared.
RESULTS
One subject from the control group was excluded due to motion artifacts that did not allow a proper analysis of the PC sequence. All remaining data were included in the analysis.
Eight of the 20 participants with CSVD (40%) were classified as patients with possible (1/8) or probable (7/8) CAA (mean age, 69.6 [SD, 7.3] years; 50% women).31 The remaining 12 participants with CSVD had HA (mean age, 71.4 [SD, 9.8] years; 75% women).32
Patients with both CAA and HA had a higher cardiovascular risk (higher prevalence of arterial hypertension, diabetes mellitus, hyperlipidemia, greater body mass index) compared with controls, with significant group differences between those with CAA and controls for arterial hypertension (Table 1). There were no group differences with respect to age and sex (Table 1). CSVD neuroimaging markers in the BG region are reported in Table 2, for each group separately. The presence of cSS and strictly lobar MBs/ICHs is a defining marker of CAA and was, accordingly, found only in this group (Table 2). There were 4 participants with asymptomatic ICH in lobar or deep regions, respectively (3 belonging to the CAA group and 1 to the HA group) (Table 2). The lesions were located outside the section measured by the 2D PC sequence.
Blood Flow Velocity
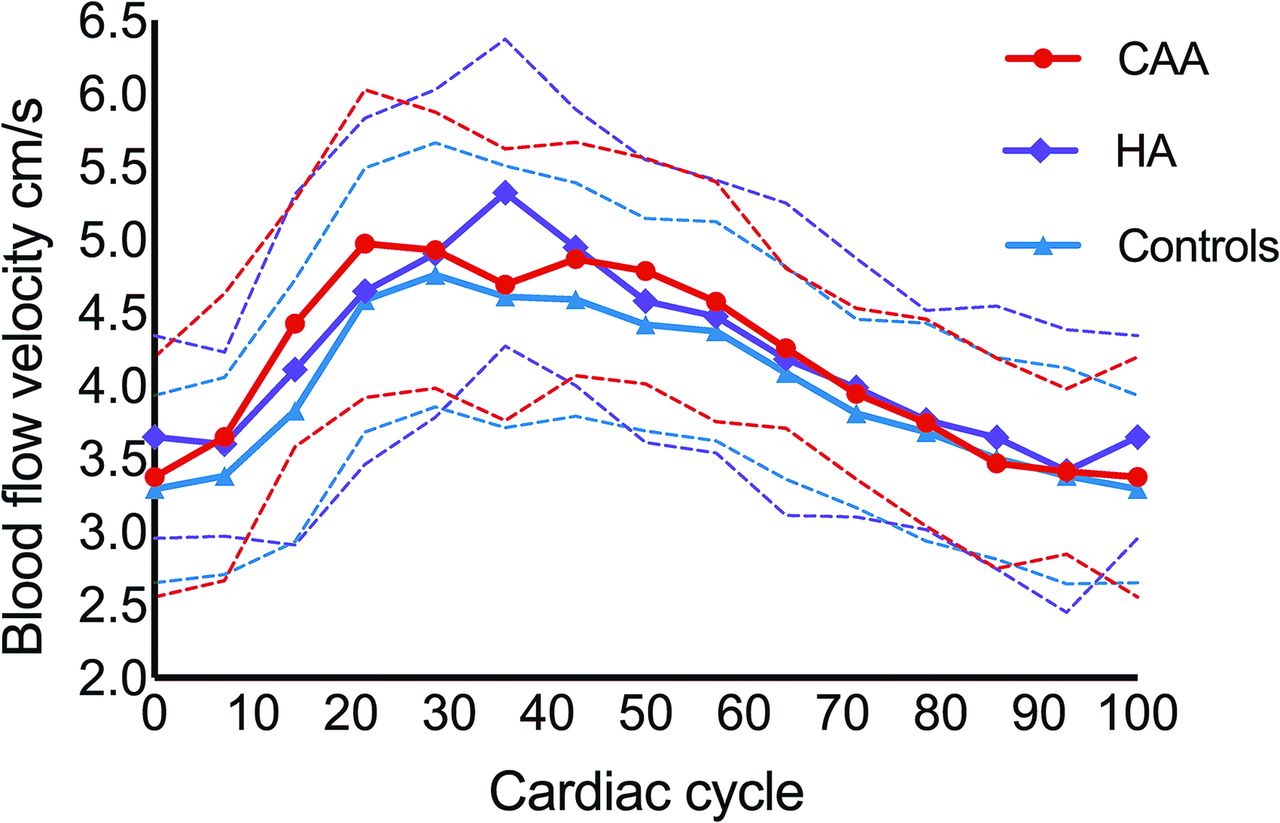
There were no group differences for Vmean. Vmean curves of the study groups are shown in Fig 2. The curves indicate that HA is related to a less steep increase in the BG blood flow velocity across the cardiac cycle.

Blood flow velocity curves. Mean blood flow velocity curves (solid lines) over the cardiac cycle (from 0% to 100%, starting at end-diastole) are shown for participants with CAA (red) and HA (purple), compared with healthy controls (blue). The dashed lines represent 1 SD. Blood flow velocity at each of the 14 available cardiac timeframes was averaged over the group. The blood flow velocity curve of patients with HA shows a slightly different pattern than in the other groups.
In the quantile regression analysis, peri-BG WMH showed a significant negative relationship to Vmean at the 50th percentile across the whole group (–0.65 [SD, 0.25] cm/s; P = .021), suggesting that the presence of WMH in the proximity of the perforating BG arteries is related to a slower blood flow (Online Supplemental Data). This relationship was driven by the HA group (Spearman ρ = –0.79; P = .006), while no association was found in the remaining groups. In our sample, blood flow velocity in the small arteries of the BG did not show any association with age, sex, and the remaining CSVD neuroimaging markers.
PI
There were no group differences for the PI. Age had a significant positive relation to the PI in the quantile regression analysis at the 25th and 75th percentiles across the whole group (25th percentile: 0.01 [SD, 0.004]; P = .002; 75th percentile: 0.01 [SD, 0.005]; P = .019) (Online Supplemental Data). A medium-to-large effect size association between age and PI was, thereby, found in each group (CAA: Spearman ρ = 0.76; P = .04; HA: Spearman ρ = 0.65; P = .03; controls: Spearman ρ = 0.47; P = .02) (Fig 3). In other words, the PI increased with age, irrespective of belonging to a subgroup. There was no relationship between the PI and sex or CSVD-related lesions.

Association between the PI and age. The PI was positively correlated with age in each subgroup, independent of the presence or subtype of CSVD. The Spearman correlation was used.
Number of Detected Vessels
There were no group differences for the number of detected vessels. A decreased number of detected vessels could have occurred due to lower blood velocity, net cerebral blood flow, or a narrower lumen of the vessel. Furthermore, there was no relationship between vessel number, age, sex, or CSVD downstream pathologies (Online Supplemental Data).
DISCUSSION
The main purpose of this 7T MR imaging study was to measure blood flow velocity and the PI in the small perforating BG arteries in both healthy elderly controls and patients with CSVD (CAA and HA). We found that older age related to a higher PI in the small perforating BG arteries independent of CSVD existence or subtype, while flow velocity was not age-dependent. Furthermore, there was an association between lower blood flow velocity in the deep perforators and peri-BG WMH in the HA subgroup.
The relationship between age and a greater PI is consistent with previous data, revealing a higher PI in healthy elderly compared with young subjects in both large cerebral vessels such as the MCA35 and the lenticulostriate arteries.23 Although our study population was limited to elderly participants, a positive association between age and pulsatility existed. These results can be explained by the lower compliance of the cerebral vasculature in older age, which is likely to occur through stiffening of the arterial wall.36 Moreover, an age-related stiffening of the whole vessel tree, especially of the aorta, can lead to a diminished wave reflection and thus transmission of excessive pulsatility to the microvasculature.24 No difference in PI was observed between the groups, suggesting that age might be the driving factor influencing this measure, irrespective of CSVD. On the contrary, a previous study, which used the same method and compared a cohort of patients with CSVD with symptomatic stroke (deep ICH or lacunar infarcts) with healthy elderly controls27 found that the PI in the BG was higher in the subjects with stroke. Possible explanations for this discrepancy are, on the one side, different degrees of disease severity (patients in the present study were supposedly less affected because only 1 presented with deep-but-asymptomatic ICH). Additionally, the current implementation of the 2D PC MR imaging sequence appears to be less sensitive on the Siemens platform than on the Philips Healthcare platform as reported before,33 underscoring the challenge of harmonizing sequences.
Another factor that might have contributed is a different approach in the data processing. During the course of our study, J.J.M.Z (author on both the present article and the previous study27) learned that the PI in the previous study was, accidentally, first calculated per vessel and subsequently averaged to get a single PI per subject, whereas it was intended to be calculated from the average normalized velocity curve from all vessels. Calculating per vessel makes the PI more susceptible to noise and yields numerically larger PIs. Nonetheless, the PI calculated from the average velocity curves from the previous study did still show a significant difference in the PI between patients with lacunar infarcts and controls (data not shown). Our results definitely confirm the importance of reproducing previous studies.
Our study uncovered a relationship between lower blood flow velocity in the perforating arteries of the BG and the presence of peri-BG WMH. That association was obvious even after correcting for other CSVD markers in the BG region (deep MBs, deep lacunes, BG EPVS), age, and sex, supporting its robustness. The relation was pertinent to the HA group, consistent with the pattern of cerebral lesions caused by hypertensive disease and the vulnerability of the BG vessels associated with this condition.37 In these patients, CSVD-related lesions are, in fact, mainly found in the deep cerebral regions,12 but the mechanistic process leading to them remains a matter of debate. This finding goes along with those in previous studies in which lower blood flow velocity measured in larger vessels (eg, the MCA) was associated with WMH severity.38 A decrease in cerebral blood flow surrounding WMH39 and at the whole-brain level (including normal-appearing WM)40 was associated with larger WMH volume in cognitively healthy elderly controls. Further studies found that higher arterial stiffness in the central arteries (eg, the aorta), measured by pulse wave velocity, was an independent predictor of high overall WMH burden.24⇓-26 Furthermore, elderly subjects with WMH showed higher MCA pulsatility,41 an association that was stronger than the one with central artery pulsatility. However, none of the so-far reported studies directly measured blood flow in the perforating small BG arteries. The exact sequence of changes in blood flow measures of small arteries and the development of WMH are still debated, and dedicated longitudinal studies are needed to unravel them.42
Contrary to what might be expected given these premises, blood flow characteristics (mean velocity and PI) in the perforating arteries of patients with HA from our cohort were not significantly different from those of patients with CAA and controls. While the stage of the disease might have played a role in determining this result, it could also suggest that blood flow velocity and PI do not sufficiently explain CSVD-related microvascular hemodynamics. For example, conflicting evidence exists about the role played by arterial pulsatility in clearance mechanisms.43,44 Other factors such as cerebrovascular reactivity42 might be more relevant. The profile of the blood flow velocity curves was different in patients with HA compared with the other groups and showed a less steep increase than in the remaining subgroups. The meaning of the shift in the flow velocity curve should not be overestimated but is coherent with the predominant vulnerability of the BG vessels in patients with HA (compared with CAA).
There was no effect with respect to the number of detected vessels in the BG. Even though the spatial resolution of the 2D PC sequence is sufficient to detect a perforating artery of average diameter (0.47 mm) and below,21 some arteries likely remained unobserved.
One obvious limitation of our study is the small number of subjects and the relatively high number of tests performed on the data, so the results need to be considered as exploratory. This aspect needs to be set in the context of the difficulty of performing 7T MR imaging, with all its contraindications, of patients clinically affected by cerebrovascular disease. However, the use of 7T MR imaging was here necessary to provide sufficiently high resolution, high SNR, and short acquisition times. Moreover, the use of a robust statistical method such as quantile regression analysis, which can suitably be applied to small samples and when the conditions for linear regression analysis are not met, minimizes this issue.45 Nonetheless, broader studies are needed to make more conclusive observations. This recommendation applies also to the relationship between age and PI, which should be investigated within the frame of a life span study and in a set of longitudinal measures. A further limitation concerns the lack of pulsatility measurements in larger arteries, such as the M1 segment of the MCA, which would allow establishing whether the results reported in this study are dependent only on the downstream circulation system. However, a previous study suggested the existence of damping beyond the major cerebral arteries, which could compensate for left ventricular function and arterial input.46
In the present study, we investigated the characteristics of blood flow in the perforating arteries of the BG. However, using 2D PC MR imaging to the cortical or perforating WM arteries could help to shed more light on the hemodynamic consequences of CAA as well, which mainly interests these vessels.
CONCLUSIONS
Our study combined, for the first time, the analysis of CSVD markers with measures of blood flow obtained through ultra-high-resolution 7T MR imaging. Decreased blood flow velocity in the perforating BG arteries was associated with the presence of peri-BG WMH in HA. Furthermore, age proved to be the driving factor for an increase in the PI in our cohort, irrespective of CSVD. Even if further and broader studies are needed to pinpoint the applicability of measures of blood flow as a functional marker, our results already point toward the potential of 2D PC MR imaging to aid in the understanding of vascular aging and CSVD.
Acknowledgments
We are very grateful to all participants who volunteered to take part in the study. We thank Anna Ludwig and Denver Huff for help in subject recruitment and data collection. We also wish to thank Renate Blobel-Lüer, Claus Tempelmann, and Daniel Stucht for their dedicated efforts in scanning, standardization, and quality assurance.
Footnotes
S. Schreiber and J.J.M. Zwanenburg contributed equally to this work.
This work was supported by Neural Resources of Cognition, CRC 1436.
Disclosure forms provided by the authors are available with the full text and PDF of this article at www.ajnr.org.
References
- 1.
- 2.
- 3.
- 4.
- 5.
- 6.
- 7.
- 8.
- 9.
- 10.
- 11.
- 12.
- 13.
- 14.
- 15.
- 16.
- 17.
- 18.
- 19.
- 20.
- 21.
- 22.
- 23.
- 24.
- 25.
- 26.
- 27.
- 28.
- 29.
- 30.
- 31.
- 32.
- 33.
- 34.
- 35.
- 36.
- 37.
- 38.
- 39.
- 40.
- 41.
- 42.
- 43.
- 44.
- 45.
- 46.
- Received October 1, 2021.
- Accepted after revision January 5, 2022.
- © 2022 by American Journal of Neuroradiology