Abstract
BACKGROUND AND PURPOSE: There is heterogeneity of white matter damage in Parkinson's disease patients with different cognitive states. Our aim was to find sensitive diffusional kurtosis imaging biomarkers to differentiate the white matter damage pattern of mild cognitive impairment and dementia.
MATERIALS AND METHODS: Nineteen patients with Parkinson disease with mild cognitive impairment and 18 patients with Parkinson disease with dementia were prospectively enrolled. All participants underwent MR examination with 3D-T1-weighted image and diffusional kurtosis imaging sequences. Demographic data were compared between the 2 groups. Voxelwise statistical analyses of diffusional kurtosis imaging parameters were performed using tract-based spatial statistics. The receiver operator characteristic curve of significantly different metrics was graphed. The correlation of significantly different metrics with global cognitive status was analyzed.
RESULTS: Compared with the Parkinson disease with mild cognitive impairment group, the fractional anisotropy and mean kurtosis values decreased in 4 independent clusters in the forceps minor, forceps major, inferior fronto-occipital fasciculus, and the inferior and superior longitudinal fasciculus in patients with Parkinson disease with dementia; the mean diffusivity decreased in 1 cluster in the forceps minor. The fractional anisotropy value in the inferior fronto-occipital fasciculus and inferior longitudinal fasciculus would be the diffusional kurtosis imaging marker for the differential diagnosis of Parkinson disease with mild cognitive impairment and patients with Parkinson disease with dementia, with the best diagnostic efficiency of 0.853. The fractional anisotropy values in the forceps minor (β = 84.20, P < .001) and years of education (β = 0.38, P = .014) were positively correlated with the Montreal Cognitive Assessment.
CONCLUSIONS: The diffusional kurtosis imaging–derived fractional anisotropy and mean kurtosis can detect the different white matter damage patterns of Parkinson disease with mild cognitive impairment and Parkinson disease with dementia. Fractional anisotropy is more sensitive than mean kurtosis in the differential diagnosis; fractional anisotropy derived from diffusional kurtosis imaging could become a promising imaging marker for the differential diagnosis of Parkinson disease with mild cognitive impairment and Parkinson disease with dementia.
ABBREVIATIONS:
- AUC
- area under the curve
- DKI
- diffusional kurtosis imaging
- FA
- fractional anisotropy
- H-Y stage
- Hoehn-Yahr stage
- JHU
- Johns Hopkins University
- MD
- mean diffusivity
- MK
- mean kurtosis
- MMSE
- Mini-Mental State Examination
- MoCA
- Montreal Cognitive Assessment
- PD
- Parkinson disease
- PD-MCI
- Parkinson disease with mild cognitive impairment
- PDD
- Parkinson disease with dementia
- ROC
- receiver operating characteristic
- TFCE
- threshold-free cluster enhancement
SUMMARY
PREVIOUS LITERATURE:
The DTI-derived FA value can’t reveal the white matter damage of neurodegenerative disease well. In previous studies, the FA values of PD patients with cognitive decline vary a lot, and the conclusions are inconsistent.
KEY FINDINGS:
The DKI-derived FA had a high diagnostic efficiency for PD-MCI and PDD.
KNOWLEDGE ADVANCEMENT:
DKI is an effective imaging method to evaluate the degree of white matter damage in PD patients with cognitive impairment.
Cognitive dysfunction is one of the main nonmotor syndromes in Parkinson disease (PD). The underlying neurobiological mechanisms are unrevealed. Approximately 30% of patients with PD progress to PD with dementia (PDD).1,2 Researchers propose that mild cognitive impairment in PD (PD-MCI) may represent a stage within PD or a prodrome to PDD though there is not enough evidence to prove it. The definition and diagnostic criteria of PD-MCI and PDD are progressively established and revised. PD-MCI can only be diagnosed in the context of established PD, while in the revised PD criteria, dementia at the onset of PD is no longer exclusionary.3 Longitudinal studies in PD indicate that PD-MCI can follow different courses, including persistent PD-MCI, progression to PDD, and even reversion to normal cognition4 because the trajectory of cognitive decline in PD is heterogeneous and the underlying damage mechanisms or patterns of brain regions associated with each cognitive state are different subtypes.5,6 Hence, identifying diagnostic biomarkers for PD-MCI and PDD remains challenging.7
The brain damage in white matter thought to be associated with cognitive dysfunction includes the spread of Lewy pathology, the damage of neuroglial cells, demyelination of axons, and the increase of microglia concentration in extracellular spaces.8 Animal experiments confirm the ability of diffusional kurtosis imaging (DKI) to detect microstructural pathologic processes in both gray and white matter in the methamphetamine model of PD.9 However, the acquisition time of DKI is much longer than that of DTI, limiting the wide use of DKI in clinical situations. Most diffusion imaging studies are derived from DTI, other than DKI. In the past decade, with various kinds of acquisition-acceleration techniques available on clinical scanners, the scan duration of the DKI sequences is significantly reduced. Diffusivity metrics derived from DKI can better capture the white matter microenvironmental processes than those from DTI in neurodegenerative diseases.10,11 A recent meta-analysis found that the mean kurtosis (MK) is a more sensitive diagnostic biomarker than fractional anisotropy (FA) for Parkinson disease.12
In this study, we aimed to investigate the white matter microstructure changes of patients with PD-MCI and PDD using DKI-derived diffusion metrics and to evaluate their relationship with cognitive status. By predicting prognostic factors of patients with PD on the basis of DKI-derived parameters, the applications of DKI are expected to ultimately increase our understanding of PD pathology and progression, especially as a promising imaging marker for the differential diagnosis of PD-MCI and PDD.
MATERIALS AND METHODS
Subjects
This prospective study was approved by the local ethics committee of the First Affiliated Hospital of Dalian Medical University. Written informed consent was obtained from patients or legal guardians before the study.
Thirty-seven patients with PD with cognitive dysfunction were prospectively enrolled. PD diagnosis was confirmed by neurologists according to the Chinese Guidelines for the Treatment of Parkinson disease (fourth edition) formulated by the Movement Disorders and Parkinson's Disease Group of the Neurology Branch of the Chinese Medical Association in 2020, referencing the UK Brain Bank criteria for PD diagnosis, the Movement Disorder Society PD-MCI diagnostic criteria for PD-MCI diagnosis, and the Movement Disorder Society PDD criteria for PDD diagnosis.13,14 The exclusion criteria for the participants are the following: 1) type 2 diabetes mellitus; 2) severe trauma or surgery on the brain; 3) depression or delirium; 4) alcoholism or drug abuse that can affect the cognitive status; 5) severe respiratory, cardiovascular, gastrointestinal, and other medical system diseases; and 6) MR scanning contraindication.
Neuropsychological Assessment and Subgroups
All participants underwent Hoehn-Yahr stage (H-Y stage) evaluation to assess the PD severity, as well as the Mini-Mental State Examination (MMSE) and Montreal Cognitive Assessment (MoCA) to estimate the global cognitive state. The scale measurement was performed by 1 neurologist with 6 years of experience. All patients with PD were further divided into 2 groups according to the neuropsychological assessment score.
Patients with PD with MMSE >24 and MoCA <26 were classified as in the PD-MCI group (total 19 cases, 11 women; mean age of PD diagnosed, 63.34 [SD, 5.53] years). Patients with PD with an MMSE score of ≤24 and an MoCA score of <26 were classified as in the PDD group (total 18 cases, 6 women; mean age of PD diagnosed: 65.73 [SD, 5.98] years) according to the Petersen MCI diagnostic criteria.15 Both the age when PD was diagnosed (usually without cognitive dysfunction) and the age when PD-MCI or PDD was diagnosed (at the time of this MR study) were collected.
Data Collection and Preprocessing
All patients with PD underwent whole-brain covered DKI using a single-shot EPI sequence and sagittal 3D T1-weighted images on a 3T MRI scanner (Ingenia CX; Philips Healthcare) equipped with a 32-channel phase-array head coil. The parameters were as follows; 1) sagittal 3D T1-weighted images: TR = 10.2 ms, TE = 4.2 ms, TI = 450 ms, flip angle = 12°, field of view = 256 × 256 mm2, matrix = 256 × 256, thickness = 1.0 mm, no gap, voxel size = 1.0 × 1.0 × 1.0 mm3, total 188 sagittal slices; 2) DKI: b=0, 1000, 2000 seconds/mm2, 32 frames for b=1000 and b=2000, respectively; directions = 65, TR/TE = 6000 ms/92 ms, voxel size = 2 × 2 × 2 mm3, matrix size = 128 × 128, FOV = 256 × 256 mm2, slice thickness = 2 mm, no gap, duration = 6 minutes 46 seconds.
Corrections for eddy current–induced distortions and subject movements were made using the eddy correction procedure implemented in FSL (http://www.fmrib.ox.ac.uk/fsl). DKI tensor estimation was performed using the Diffusional Kurtosis Estimator (DKE, https://www.nitrc.org/projects/dke/) to get FA, MK, and mean diffusivity (MD) maps for further statistical analysis.
Statistical Analysis
Demographic data were analyzed using Stata, Version 18.0 (StataCorp). The Shapiro-Wilk test was used to test the normality of the data distribution. A 2-sample t test or Mann-Whitney U test was performed with the enumeration data. A χ2 test was performed to analyze sex differences between groups.
Voxelwise statistical analyses of the FA, MK, and MD maps between the 2 groups were performed with Tract-Based Spatial Statistics (using FSL software tools from the FMRIB software library; FSL, Version 5.0.9, http://www.fmrib.ox.ac.uk/).16,17 The intergroup comparison of DKI metrics was performed using the randomise script (5000 permutations; https://fsl.fmrib.ox.ac.uk/fsl/fslwiki/Randomise/UserGuide) in FSL with the age of diagnosis with PD-MCI or PDD, sex, and years of education as covariates. Results were reported at the P < .05 level after threshold-free cluster enhancement (TFCE) for multiple comparisons. By FSL’s clusters, statistically significant clusters of the results were identified with 2 white matter templates: the Johns Hopkins University (JHU) International Consortium of Brain Mapping DTI-81 WM labels and the JHU White Matter Tractography Atlas template. Statistical significance was defined as 2-tailed P < .05. The mean values of each statistically significant cluster were also measured.
The receiver operating characteristic (ROC) curve of each statistically significant cluster was plotted; a combined ROC curve to improve the diagnostic efficiency was also plotted.
To estimate the correlation between cognitive status and DKI metrics, we modeled age, sex, education, disease duration, univariate and multiple linear regression analyses. The univariate factors associated with MoCA were included in the multiple analysis.
RESULTS
The demographic and neuropsychological data are detailed in Table 1. There was no significant difference in the age of PD diagnosed (usually without cognitive dysfunction), sex, years of education, H-Y stage, or disease duration. However, the age of PD-MCI or PDD diagnosis was different (P = .004).
Clinical data of PD-MCI and PDD groups
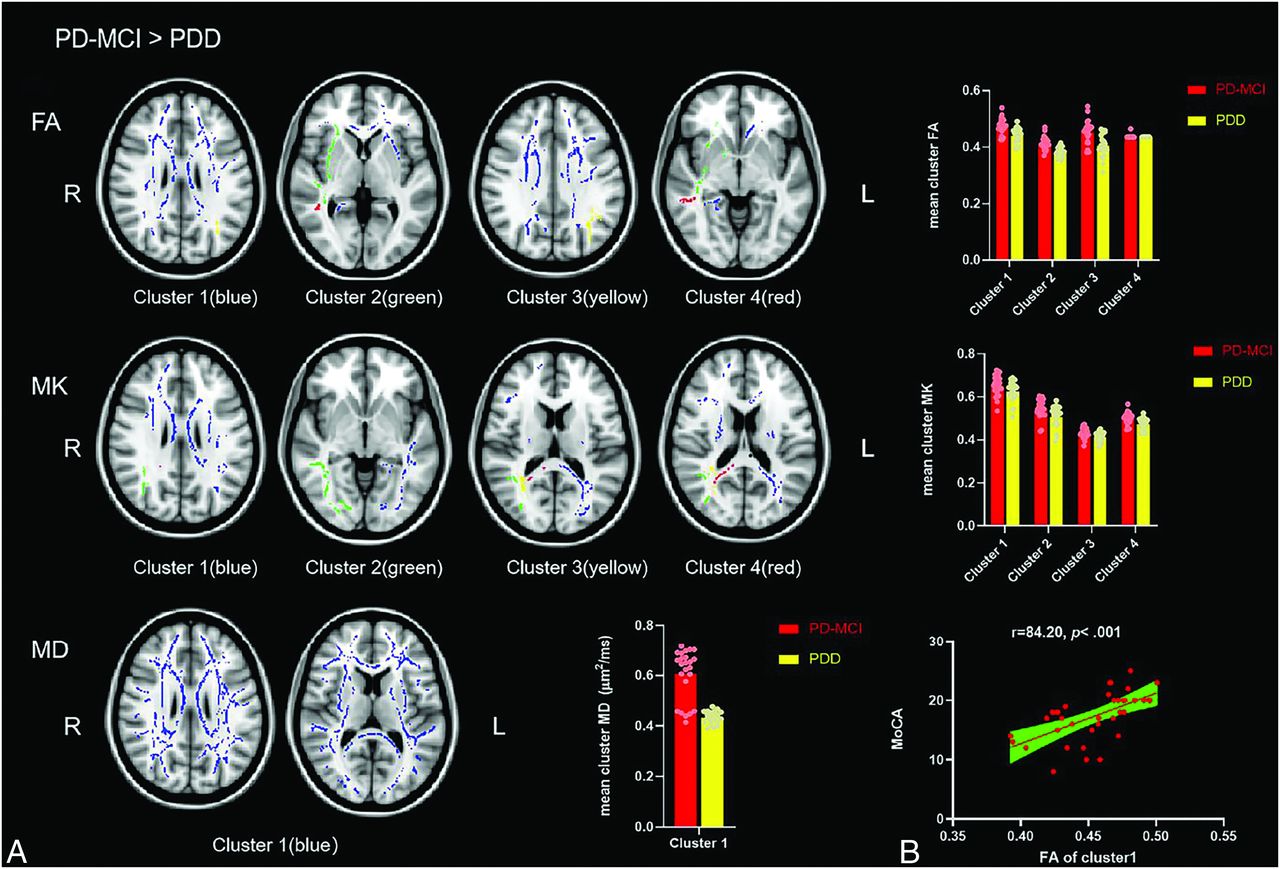
For the comparison of DKI metrics of the PD-MCI group greater than that of PDD group, the FA, MK, and MD significantly increased (TFCE-corrected) in widespread regions of white matter (Fig 1). After identifying with the templates, the regions of FA and MK were in 4 independent clusters in the forceps minor and forceps major, inferior fronto-occipital fasciculus, and inferior and superior longitudinal fasciculus. The regions of MD were in 1 cluster in the forceps minor (Fig 2). Only clusters with voxels of >200 and atlas regions of >3% were recorded; the cluster sizes and locations are detailed in the Online Supplemental Data and Table 2.

Post hoc analyses results between patients with PD-MCI and PDD. Green represents the mean FA skeleton of all subjects. Yellow and red represent regions with significant statistical values (P < . 05, TFCE-corrected).

A, Voxel clusters of decreased FA, MK, and MD of the PDD group more than PD-MCI group. The colorful regions (blue, green, yellow, red) represent regions with significant statistical values (P < . 05, TFCE-corrected). B, Positive correlation between the FA of cluster 1 and the MoCA. FA has 4 independent clusters, MK has 4 independent clusters, and MD has 1 independent cluster. The bar plots represent the corresponding mean diffusion metrics for each group.
Cluster sizes and locations for voxels with significantly reduced MD values in the PDD group compared with PD-MCI group (PD-MCI > PDD)a
After comparison of the metrics of the PD-MCI group less than that of PDD group, there was no significant difference voxel (after TFCE) in the white matter tract.
The ROC curves of each cluster and a combination ROC curve were graphed (Fig 3). The single DKI marker FA cluster 2 (in inferior fronto-occipital fasciculus and inferior longitudinal fasciculus) had an ROC area of 0.853. The combined ROC curve model was fitted with clusters 1, 2, and 3 of the FA map (in the forceps minor, inferior fronto-occipital fasciculus, and inferior or superior longitudinal fasciculus) and clusters 2 and 3 of the MK map (in the forceps major, inferior fronto-occipital fasciculus, and inferior or superior longitudinal fasciculus) in the order of the area under the curve (AUC) from large to small until the efficacy of the combined curve no longer increased, which resulted in an ROC area of 0.912. Still, there was no significant different between the combined ROC model and the ROC curve of FA cluster 2 (χ2 = 1.80, P = .180), as well as the FA clusters 1 and 3 (Table 3).

The ROC curves of significantly different clusters of DKI metrics and the combined ROC model. The combined model was fitted with cluster 1, 2, and 3 of the FA map and cluster 2 and 3 of the MK map.
Comparison between significantly different clusters and the combined ROC curve model
Predictors of the MoCA score of all the patients with PD was calculated using the univariate and multiple linear regression models (Table 4). The univariate factors associated with MoCA were brought into the multiple analysis. The multiple linear regression showed that the mean FA value in cluster 1 in the forceps minor (β = 84.20, P < .001) and years of education (β = 0.38, P = .014) were positively correlated with the MoCA score.
Predictors of MoCA scores in patients with PD with cognitive dysfunction: univariate and multiple linear regression analysis
DISCUSSION
This study detected the white matter microstructural change between patients with PD-MCI and PDD using the DKI sequence and voxel-based Tract-Based Spatial Statistics analyses. The diagnostic efficiency of DKI metrics was calculated. The correlation between the DKI metrics and cognitive tests was also explored. The main results of this work are as follows: 1) The FA, MK, and MD were all reduced in patients with PDD compared with those with PD-MCI; 2) the diagnostic efficiency between the PD-MCI and PDD groups was great AUC > 0.8 in cluster 1 (forceps minor) and cluster 2 (inferior fronto-occipital fasciculus and inferior longitudinal fasciculus) of the FA map, and the combination applies of FA and MK clusters performed better AUC > 0.9; 3) the mean FA values in cluster 1 (forceps minor) were significantly correlated with the MoCA score, representing the global cognitive status. According to the results, the FA and MK derived from the diffusion kurtosis estimation model were more sensitive to cognitive-related microstructure changes than MD.
Many studies have detected the neuroanatomic substrates of white matter in patients with early PD with cognitive decline using diffusion imaging, mostly DTI. The primary metrics of DTI are FA and MD. Decreased FA represents the break of axonal integrity, axonal loss, and demyelination. While the increased FA has been suggested to be related to the compensatory responses or excitatory reactions.8 In comparison, the FA value cannot reveal the white matter damage of neurodegenerative disease well. In previous studies, the FA values of patients with PD with cognitive decline varied a lot, and the conclusions were inconsistent. A study involving 109 patients with PD showed that FA derived from DTI did not differ significantly between the PD-MCI and PDD groups.18 Another study using voxel-based analysis demonstrated that compared with controls, the FA values in patients with PDD was significantly lower in the bilateral frontal, left temporal, and left parietal white matter.19 In a large longitudinal study (The Incidence of Cognitive Impairment in Cohorts with Longitudinal Evaluation-PD, ICICLE-PD), no FA difference was reported at baseline or follow-up between healthy controls and patients with PD with normal cognition or MCI.20 Thus, we attempted to reflect better the white matter diffusion changes with DKI in the present study. There were 4 independent clusters of significantly decreased FA areas of the PDD group compared with the PD-MCI group. Three of these clusters had good diagnostic efficiency. It suggests that FA derived from DKI could be a sensitive radiomic marker to detect the microstructure damage of white matter.
In addition, in this study, univariate and multiple linear regression analyses showed that education and mean FA values in the forceps minor were influential factors in the cognitive status of patients with PD. FA in the forceps minor positively correlated with MoCA. Patients with PDD have a more severe FA decrease in the minor forceps of the corpus callosum, compared with the PD-MCI group. The corpus callosum, the largest bundle of commissural fibers, is located at the base of the longitudinal fissure of the brain and is broad, thick white matter composed of transverse fibers connecting the left and right cerebral hemispheres. After entering both hemispheres, the corpus callosum fibers spread out and project to the entire hemispherical cortex. They connect the corresponding parts of the 2 hemispheres, making the brain a functional whole. They play an essential role in coordinating activities between the 2 hemispheres. The fibers passing through the genu of the corpus callosum curve forward into the frontal lobes on each side and are called minor forceps. An ROI-based study found that FA values of the right parietal and left occipital lobes were significantly lower in the PD-MCI group, compared with the healthy controls.21 The posterior cingulate cortex–right medial temporal lobe functional connectivity strength of PD significantly correlates with the MoCA score; the PDD group shows a decreased functional connectivity of the posterior cingulate cortex right parahippocampal gyrus compared with normal cognition in the PD group, while PDD group shows a widespread decreased posterior cingulate cortex functional connectivity compared with healthy controls.22 The corpus collosum white matter damage break of axonal integrity, axonal loss, and demyelination induce cognitive dysfunction with different clinical manifestations, mainly because the damaged fibers are projected to different functional cortices.
MK reflects differences in the diffusion of both intracellular and extracellular compartments and indirectly reacts with the non-Gaussian distribution of water molecules or tissue complexity, which is generally higher for more complex or heterogeneous microstructures.23 A voxelwise DKI study of cortical gray matter showed reduced MK in the frontal, temporal, limbic, and paralimbic regions and parts of the parietal lobe in the PD group, compared with health controls; meanwhile, the ROI analysis found a significant MK decrease in the anterior division of the left superior temporal gyrus and the left frontal operculum cortex.24 In this study, compared with the PD-MCI group, the MK of the PDD group significantly decreased in white matter regions located in the forceps major, inferior fronto-occipital fasciculus, inferior longitudinal fasciculus, and superior longitudinal fasciculus. These white matter fibers are connected to the cortex where MK decreases.23⇓-25 It suggested that the decrease of MK increases with the severity of cognitive status. The brain tissue complexity of the PD-MCI group was more inclined to non-Gaussian distribution than that of the PDD group.
As reported, the characteristic white matter abnormalities associated with cognitive impairment in PD predominantly appear as the diffusivity increases but not FA.8 It did not verify in the present study. The DKI-derived MD increased slightly more than 50,000 voxels in the forceps minor, suggesting more severe cellular damages and cell necrosis in the PD-MCI group. The present study had no healthy control group, and the patients’ ages at PD-MCI and PDD diagnoses were significantly different due to the natural history of disease progression. It cannot, therefore, be inferred that the decrease in MD in the PDD group was due to disease progression. DKI studies on healthy controls and patients with PD-MCI and PDD with larger cohorts were needed.
Pathologic studies of PD suggest that α-synuclein accumulates in the whole brain following a topographical sequence, beginning in the olfactory bulb, followed by the caudal brainstem, substantia nigra, limbic cortex, and neocortex.7,26⇓-28 A longitudinal DTI study of patients with early PD with 18 months of follow-up showed that the accelerated white matter change in the rostral brainstem and subcortical regions fit with this theory of topographic disease progression.29 In patients with PD-MCI and PDD, the Lewy-related pathology gradually extends from the brainstem to the cortex through white matter fibers. Except for this, Alzheimer disease-related pathology also detected, approximately 50% of patients with PDD have β-amyloid plaques in the cortex, and two-thirds of these patients also have phosphorylated τ deposition in cortical tangles.7 The β-amyloid plaques and τ enhance the complexity of brain tissue and are associated with cognitive decline in patients with PD. A study showed that τ deposition facilitates α-synuclein aggregation and propagation in Parkinson disease.30 Studies have shown that one-third of patients with PDD with τ pathology will show more severe or faster disease progression. Most interesting, there is a longitudinal DTI study of patients with PD compared with controls. It finds significant gray and white matter DTI alterations of other cortical and white matter regions at the baseline (diagnosis of PD) and 1-year-follow-up, suggesting that the increased spatial spread of α-synuclein neuropathology is the crucial mechanism of PD progression.31 As for the present cross-sectional study, the significant difference in both diffusivity and kurtosis changes of white matter in patients with PD-MCI and PDD may reveal that the α-synuclein pathology inside the white matter differed. The reasons would be the following: 1) different regions of α-synuclein pathology invasion, 2) whether accompanied by β-amyloid plaques and/or τ pathology, 3) remyelination or neuroinflammation, and 4) genetic variations.
In the present work, compared with the PD-MCI group, the decrease of FA values in the PDD group suggests that the integrity of white matter is extensively damaged, and it is positively correlated with the cognitive status of patients. The decrease in MK values in the PDD group suggests the existence of a relatively Gaussian distribution in the white matter. The decreased MD in PDD implies less neuron edema of the white matter. The cognitive impairment spectrum of PD consists of executive function, language, attention, memory, and visuospatial skills. The previous study has revealed that different patterns of white matter diffusivity underlie impairment in distinct cognitive domains of patients with PD.32 Here, we demonstrated different patterns of white matter damage between patients with PD-MCI and PDD. For a further study, longer longitudinal follow-up of patients with PD-MCI to see if there is a difference between groups who do or do not progress to PDD should considered.
Several limitations of the study should be acknowledged. First, the small sample size of this study may limit the generalizability of the results. The study may fail to reach statistical power; therefore, the findings should not be considered as definitive evidence. More research with larger samples is still needed. Second, we included patients with PD-MCI and PDD, and none of the control group or patients with PD with normal cognitive function were included; therefore, the generalization of our findings should be considered with caution. Third, the ages of patients in the PD-MCI group in this study did not match those of patients in the PDD group. With the development of the natural history of the disease, some patients with PD-MCI gradually convert to PDD, so the age of patients with PD-MCI is usually younger than that of patients with PDD. Also, the cognitive scores were not measured until just before this admission. Fourth, the study assessed only the global cognitive status. DKI detection of each aspect of the spectrum of cognitive impairment still needs further study. Fifth, the study is limited by drug treatment heterogeneity and potential confounding factors, such as biochemical indicators.
CONCLUSIONS
The patients with PD-MCI and PDD had significant differences in white matter microstructure changes. The FA and MK derived from DKI were sensitive markers for the differential diagnosis, and the FA is more sensitive than MK. The cognitive decline of patients with PD positively correlated with the mean FA value of the forceps minor.
Acknowledgments
We would like to thank all patients and healthy control volunteers who participated in this study and Wei Du, MD, for his role in the team.
Footnotes
Bingbing Gao, and Mingrui Qu are co-first authors and contributed equally to this work.
Disclosure forms provided by the authors are available with the full text and PDF of this article at www.ajnr.org.
References
- 1.
- 2.
- 3.
- 4.
- 5.
- 6.
- 7.
- 8.
- 9.
- 10.
- 11.
- 12.
- 13.
- 14.
- 15.
- 16.
- 17.
- 18.
- 19.
- 20.
- 21.
- 22.
- 23.
- 24.
- 25.
- 26.
- 27.
- 28.
- 29.
- 30.
- 31.
- 32.
- Received December 17, 2023.
- Accepted after revision March 16, 2024.
- © 2024 by American Journal of Neuroradiology