
Abstract
BACKGROUND AND PURPOSE: Detection of longitudinal changes in white matter hyperintensities (WMH) by using visual rating scales is problematic. We compared a widely used visual rating scale with a volumetric method to study longitudinal white matter changes.
METHODS: WMH were assessed with the visual Scheltens scale and a volumetric method in 100 elderly subjects aged 70–81 years for whom repetitive MR images were available with an interval of 33 (SD, 1.4) months. Reliability was determined by intraclass correlation coefficients. To examine the sensitivity of both the visual and volumetric method, we calculated Spearman rank correlations of WMH ratings and volume measurements with age.
RESULTS: Reliability of the visual rating scale was good, whereas reliability of the volumetric measurement was excellent. For baseline measurements of WMH, we found weaker associations between WMH and age when assessed with the visual scale (r = 0.20, P =.045) than with the volumetric method (r = 0.31, P =.002). Longitudinal evaluation of WMH assessments showed regression in 26% of the subjects when analyzed with the visual rating scale against 12% of the subjects when using volumetric measurements. Compared with the visual rating, the correlation between progression in WMH and age was twice as high when using the volumetric measurement (r = 0.19, P =.062 and r = 0.39, P < .001, respectively).
CONCLUSION: Volumetric measurements of WMH offer a more reliable, sensitive, and objective alternative to visual rating scales in studying longitudinal white matter changes.
White matter hyperintensities (WMH) are common findings on cerebral MR images of elderly people. Although the clinical significance has not yet been fully elucidated, WMH have been associated with cognitive impairment, gait dysfunction, and depressive symptoms.1–3 Several cerebrovascular risk factors and disorders have been associated with the presence of WMH.4,5 Moreover, older age is strongly related to WMH prevalence.4,5
Longitudinal follow-up studies on the progression of WMH are essential for a thorough evaluation of the natural course, the clinical importance of the findings, and the effect of therapeutic interventions. However, several problems exist with evaluation of longitudinal MR imaging examinations. First, there are differences in image acquisition with time. Hence, images acquired at different time intervals might display data on WMH differently. Second, the actual measurement of change on repetitive white matter measurements might pose some problems. Until now, the presence of WMH has been primarily analyzed with visual rating scales.6–8 However, the detection of change on repetitive white matter measurements when using these scales is indeed problematic.9 Visual rating scales rely heavily on the human eye to detect changes in the cerebral white matter and describe WMH in a qualitative or semiquantitative way. Hence, intra- and inter-rater reliability is usually modest to low, and the rating scales are hampered by floor and ceiling effects. Automated or semiautomated volumetric lesion-detection methods largely overcome these shortcomings. Algorithm techniques replace the human eye, and 3D reconstruction and computation allow quantitative data on WMH. Thus, volumetric WMH measurements are more objective and reliable and provide exact measurements of WMH volume compared with the visual WMH ratings.10
So far, visual ratings and semiautomated volumetric measurements have not been compared directly as to their ability to assess progression in WMH—that is, the volumetric measurements have been used as a gold standard for the evaluation of the metric abilities of the visual rating scales.11 However, the volumetric WMH measurements cannot be interpreted as such. External standards, like age or cognitive functioning, are needed to compare the sensitivity of both the visual and volumetric method.
We investigated the potential of both a widely used visual semiquantitative rating scale12,13 and an in house–developed semiautomated quantitative volumetric measurement to study longitudinal white matter changes. We compared both methods as to their reliability and sensitivity to detect change in white matter in advancing age.
Methods
Data were drawn from the nested MR imaging substudy of the PROspective Study of Pravastatin in the Elderly at Risk (PROSPER). Study details have been described elsewhere.14 Of the 1100 eligible Dutch PROSPER participants, 554 consented and were included in the PROSPER MR imaging substudy. From these original 554 subjects, 100 randomly chosen subjects were evaluated in this study.
Image Acquisition.
MR images were obtained from all subjects at baseline and after a mean follow-up of 33 (SD, 1.4) months. MR imaging was performed on a clinical MR imaging system operating at 1.5T field strength (Philips Medical Systems, Best, the Netherlands). With longitudinal MR imaging examinations, there is the problem of differences in section orientation with time—that is, both the angulations and positioning of the sections change between different MR imaging examinations. Hence, the presence of WMH on baseline and follow-up scans can differ because of changes in section orientation only. One can limit this effect by obtaining thin sections and by imaging sections without intersection gaps. Hence, we obtained dual fast spin-echo images with 48 contiguous 3-mm sections and no intersection gap (TR/TE, 3000/27/120 ms; matrix, 256 × 256; field of view, 220; acquisition percentage, 80%). To estimate the effect of section realignment with time, 8 participants were scanned and rescanned (with repositioning) in 1 MR imaging session. Short-term scan-rescan reliability for measurement of WMH was high (correlation coefficients [ICC] = 0.84).
Image Postprocessing.
White matter hyperintensities were assessed with use of both the visual semiquantitative Scheltens scale and an in house–developed quantitative volumetric method. First, with the modified version of the semiquantitative Scheltens scale,12,13 WMH were traced on T2 proton density (PD)-weighted images in the periventricular and deep white matter areas (ratings for the basal ganglia and infratentorial areas were not used in this article) and rated according to size and number. The total score for the periventricular WMH ranged from 0 to 9 and for the deep WMH from 0 to 24. The total WMH score for the Scheltens scale for each participant thus ranged from 0 to 33, with a higher score indicating a larger amount of WMH. Second, quantification of WMH volume (milliliters) was performed by using in house–developed automated software (Division of Image Processing, Department of Radiology, Leiden University Medical Center, Leiden, the Netherlands).15,16 The exact method for the quantification of WMH has been described in detail elsewhere16 with the exception that in the this article only PD- and T2-weighted images (dual MR images) were used for the automatic segmentation of WMH.
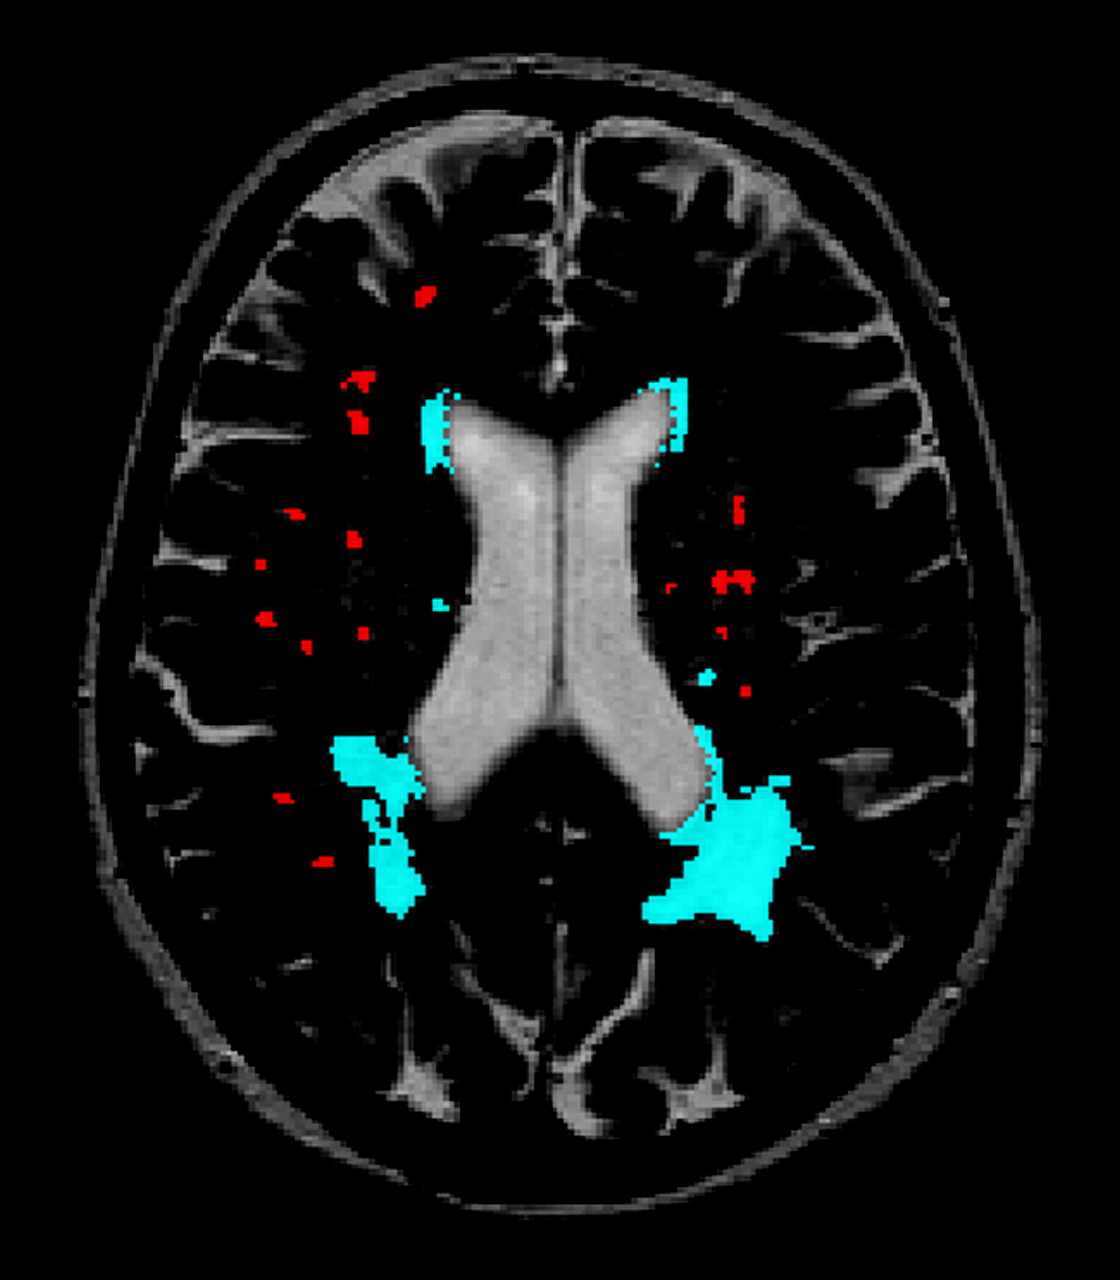
Briefly, our segmentation method combines information from dual MR images for volumetric analyses of WMH. The method is based on an established artificial intelligence technique: the Fuzzy inference system, which uses linguistic variables to classify a voxel. Each voxel is classified according to the voxel intensity (bright, medium-bright, dark) and according to the voxel position (white matter, intracranial). With the use of these linguistic values of voxel intensity and voxel position, fuzzy if-then rules were used to derive a label for every voxel. This label is then used to segment WMH from the rest of the brain with the use of another fuzzy inference rule: If voxel position is white matter and T2 intensity is “bright” and PD intensity is “bright,” then the segmented voxel is WMH. Hence, segmentations of WMH were generated automatically on dual MR images. The automatic segmentation still includes false-positives. Therefore, all images were edited manually to correct for incidental inclusion of CSF and gray matter. Moreover, fast fluid-attenuated inversion recovery hard copies were used as a reference to rule out other pathogenesis and entanglement of WMH with Virchow-Robin spaces. Infratentorial hyperintensities were excluded. The exact volumes of WMH were calculated automatically. On average, 20 minutes per scan was spent on the manual editing of the segmented images. Examples of our semiautomatic WMH segmentation are given in Figs 1 and 2.

Computerized semiautomatic detection system for quantification of volumes of deep and periventricular WMH. Red indicates deep WMH and blue indicates periventricular WMH.

3D representation of manually segmented deep WMH (red) and periventricular WMH (blue). The lateral ventricles are presented in green. The parenchyma is displayed in yellow.
All raters were blinded to subject identity and had either much experience with use of the Scheltens scale (A.C.G.M.v.E., W.M.P.) or with volumetric assessment of WMH (V.H.t.D., D.M.J.v.d.H.). All ratings were performed within a time span of 1 month. Moreover, to prevent the possibility of over-reading WMH progression in a direct scan comparison setting, we analyzed baseline and follow-up MR images in random order. Fifteen MR images were segmented twice to assess the intra- and inter-rater reliability of the visual and volumetric WMH measurements.
Statistical Analyses.
SPSS for Windows (release 11.0; SPSS, Chicago, Ill) was used for data analysis. The intra- and inter-rater reliability of the visual WMH ratings (ie, Scheltens score) and volumetric WMH measurements were determined by ICCs. ICCs equal to 0 reflected no agreement, whereas ICCs equal to 1 reflected total agreement. The associations between the visual rating and volumetric method were expressed as Spearman rank correlations. Moreover, to examine the sensitivity of both the visual and volumetric method, we calculated Spearman rank correlations of WMH ratings and volume measurements with age. The level of significance was set at P < .05.
Results
The mean age of the 100 randomly selected participants in this study was 74.5 years (SD = 2.9). Forty-one percent were women. Visual ratings and volumetric measurements of WMH of the study participants are presented in Table 1.
WMH measurement characteristics of the study sample
Intra- and inter-rater reliability of the visual WMH rating was good (ICC = 0.83 and 0.74, respectively), whereas the intra- and inter-rater reliability of the volumetric WMH measurement was excellent (ICC = 1.00 and 0.99, respectively).
To measure the strength of the linear relationship between the visual rating and the volumetric measurement, we estimated the correlation between both WMH measurements. There was a high correlation between the visual ratings and volumetric measurements of WMH at baseline (r = 0.89, P = .000) and at end of follow-up (r = 0.91, P = .000). However, the correlation of the estimates of longitudinal WMH progression between the visual ratings and volumetric measurements was substantially lower (r = 0.29, P = .003).
To examine the sensitivity of visual ratings and volumetric measurements of WMH, we evaluated the associations of either type of WMH measurement at baseline with age. As expected, both the visual ratings and the volumetric measurements of WMH were significantly associated with age, though the association with age was weaker for the visual ratings (r = 0.20, P = .045) than for the volumetric measurements (r = 0.31, P = .002).
A longitudinal evaluation of the visual rating scale showed that 26% of participants had a regression in WMH, whereas 12% regressed when the volumetric method was used (Fig 3, Table 2). Furthermore, when the progression in WMH with age was evaluated, we found that the correlation of the volumetric WMH measurement was twice as high as that of the visual rating scale (r = 0.19, P = .062 and r = 0.39, P < .001, respectively).

Graph shows longitudinal evaluation of WMH change in 100 elderly subjects by using (A) a visual rating scale (ie, Scheltens scale) and (B) a volumetric method. Black indicates the number of subjects showing WMH regression at the end of follow-up; gray indicates the number of subjects showing no change in WMH or WMH progression at the end of follow-up.
Frequency of WMH regression in study sample (n = 100) after 3 years of follow-up
Discussion
It has been postulated that volumetric measurements of WMH might be the optimal solution for the evaluation of WMH progression.10 We are the first to actually compare the potential of a semiquantitative visual rating scale and a semiautomated quantitative volumetric method to study longitudinal changes in WMH. Our data demonstrate that the volumetric measurement was more reliable and more sensitive for the evaluation of white matter changes with time.
Two studies have assessed the sensitivity and reliability of some widely used visual rating scales for measuring white matter changes.9,11 Both studies concluded that although the existing visual rating scales suffice for WMH measurements in cross-sectional studies, they are not sufficiently reliable and sensitive for measuring white matter changes in longitudinal analyses. Our present findings strongly support this view.
The inability of visual rating scales to measure change in WMH on longitudinal MR images is best illustrated by looking at the unexpected finding of regression of WMH in 26% of our study population when we used the visual rating scale. With aging, WMH are found to increase and not to decrease with time.4,5 Hence, the reported regression of WMH with time is probably an artifact due to measurement error. This artifact also occurred when using the volumetric method. However, only 12% of our study population showed regression of WMH when we used the volumetric method. Moreover, the relative size of the measurement error was far smaller for the volumetric method compared with the visual rating scale.
Recently, Prins et al11 presented a scale that was specifically designed for measuring WMH changes with time. However, their scale remains a visual rating scale; therefore, it inherently encompasses most of the difficulties of the existing visual rating scales. First, all visual rating scales have user interference and subjectivity and are, therefore, less reliable when compared with a volumetric method. Second, visual rating scales have a reduced sensitivity because they are prone to floor and ceiling effects due to their relatively large measurement units (ie, categories) and fixed upper limits. Therefore, progression in WMH beyond the defined upper limit cannot be detected. Furthermore, subtle changes in WMH are neglected if the progression is within category limits. Moreover, in visual rating scales with only a few categories (ie, qualitative scales), the extent of the progression in WMH is completely disregarded. Hence, true progression will be under- or overestimated. In contrast, volumetric measurements have small measurement units (ie, voxels) and no upper limit. Volumetric methods thus allow an unrestricted estimate of WMH volumes and change in WMH volume with time.
The main strength of this study is the large series of baseline and follow-up scans that were analyzed by using both a visual rating scale and a volumetric method. Moreover, so far, visual ratings and volumetric measurements have not been compared directly in their ability to assess progression in WMH with the use of an external standard. On the other hand, this feature is also one of the limitations of our study. In fact, there is no accepted gold standard for the assessment of WMH. However, because age has unequivocally been related to the presence of WMH in the literature,4,5 we argued that it could well serve as an external standard. The sensitivity of both the visual rating scale and volumetric measurement would presumably translate well into a closer association with age.
Conclusion
Our data suggest that volumetric measurements of WMH offer a more reliable, sensitive, and objective alternative to visual rating scales in studying longitudinal white matter changes. In addition, volumetric measurements of WMH enable comparison between various studies on the same topic. Although extensive time requirements for volumetric WMH quantification are often reasons given to limit their use, highly sophisticated and time-efficient methods of semiautomated volumetric WMH are now within reach.
PROSPER Study Group
Executive Committee: (Glasgow) J. Shepherd (chairman and principal investigator), S.M. Cobbe, I. Ford, A. Gaw, P.W. Macfarlane, C.J. Packard, D.J. Stott; (Leiden) G.J. Blauw (principal Investigator), E.L.E.M. Bollen, A.M. Kamper, R.G J. Westendorp; (Cork) M.B. Murphy (principal investigator), B.M. Buckley, M. Hyland, I.J. Perry.
End Point Committee: S.M. Cobbe (chairman), J.W. Jukema, P.W. Macfarlane, A.E. Meinders, D.J. Stott, B.J. Sweeney, C. Twomey.
Data and Safety Monitoring Committee: W.V. Brown (chairman), H.C. Diener, J. Feely, I. Ford (nonvoting), T. Pearson, S. Pocock, P.A. van Zwieten.
Acknowledgments
We thank H. Olofsen, MD, for technical assistance and N. Schmitz, MD, and W. M. van der Flier, MD, for critical reading and valuable comments.
Footnotes
This work was supported by an unrestricted research grant from Bristol-Myers Squibb.
The study was sponsored by an investigator-initiated grant from Bristol Myers-Squibb, Princeton, NJ. The sponsor had no role in the design, data collection, data analyses, data interpretation of the study, or writing of the paper. The authors declare the following arrangements with the sponsoring company and/or other companies making competing products: research support and travel grants, G.J. Blauw, M.A. van Buchem, E.L.E.M. Bollen, A.J.M. de Craen, and R.G.J. Westendorp.
References
- Received March 10, 2005.
- Accepted after revision August 19, 2005.
- Copyright © American Society of Neuroradiology
In this issue


Jump to section
Related Articles
Cited By...
- Automated Segmentation of MRI White Matter Hyperintensities in 8421 Patients with Acute Ischemic Stroke
- Contribution of white matter hyperintensities to ventricular enlargement in older adults
- Performance of three freely available methods for extracting white matter hyperintensities: FreeSurfer, UBO Detector and BIANCA
- White matter hyperintensities classified according to intensity and spatial location reveal specific associations with cognitive performance
- Determinants of cerebral radiological progression in Fabry disease
- Enzyme replacement therapy and white matter hyperintensity progression in Fabry disease
- Extracellular vesicle protein levels are related to brain atrophy and cerebral white matter lesions in patients with manifest vascular disease: the SMART-MR study
- Evaluation of a Practical Visual MRI Rating Scale of Brain White Matter Hyperintensities for Clinicians Based on Largest Lesion Size Regardless of Location
- Changes in Normal-Appearing White Matter Precede Development of White Matter Lesions
- MR Imaging of Brain Volumes: Evaluation of a Fully Automatic Software
- Cerebrovascular Damage in Late-Life Depression Is Associated With Structural and Functional Abnormalities of Subcutaneous Small Arteries
- Progression of brain atrophy and cognitive decline in diabetes mellitus: A 3-year follow-up
- Cognitive impairment risk: White matter hyperintensity progression matters
- Impact of white matter hyperintensity volume progression on rate of cognitive and motor decline
- Progression of White Matter Hyperintensities and Incidence of New Lacunes Over a 3-Year Period: The Leukoaraiosis and Disability Study
- Progression of Leukoaraiosis and Cognition