
Abstract
BACKGROUND AND PURPOSE: We prospectively evaluated the influence of different imaging techniques (time-of-flight MR angiography [TOF-MRA], contrast-enhanced MR angiography [CE-MRA], multisection CT angiography [CTA]) and postprocessing methods (maximum intensity projection [MIP], multiplanar reformation [MPR]) on carotid artery stenosis grading.
MATERIALS AND METHODS: Fifty patients (34 men, 16 women) with symptomatic stenosis of the internal carotid artery were examined with a 16-section spiral CT and a 1.5T MR unit. Two MRA techniques were applied: 3D-TOF and CE-MRA. MPR was used for postprocessing with all modalities; MIP was used only with MRA. Four readers measured and calculated the percentage diameter stenosis independently according to NASCET criteria. The Wilcoxon test was used to measure interobserver variability, and the Friedman test was used to test the null-hypothesis of equality of the modalities.
RESULTS: The hypothesis for global equality was rejected (P < .001). TOF-MRA and CTA assessed with MPR showed the highest concordance (difference, 0.6%; confidence interval [CI], −3.0, 4.3%), and CE-MRA with MIP and CTA showed the lowest concordance in stenosis grading (difference, 7.0%; CI, 3.4, 10.6%). MPR resulted in lower degrees of stenosis than MIP for both MRA sequences, although not statistically significant (CE, −3.0%; CI, −6.6, 0.6%; TOF, −2.2%; CI, −5.8, 1.4%). When only studies with good or excellent image quality were considered, the differences decreased, but the trends remained.
CONCLUSION: Stenosis grading is dependent on the examination method and postprocessing technique. CTA and TOF-MRA evaluated with MPR revealed highest concordance.
Therapeutic decisions in the large clinical trials (North American Symptomatic Carotid Endarterectomy Trial Collaborators, European Carotid Surgery Trial, and Asymptomatic Carotid Atherosclerosis Study)1–4 were based on maximal internal carotid artery (ICA) stenosis depicted with conventional angiography. Selective intra-arterial digital subtraction angiography (DSA) still provides the highest spatial resolution and dynamic information, but it is associated with the risk of neurologic complications.5–8 Furthermore, diagnostic strategies with DSA were found to be inferior considering cost-effectiveness calculations in patients with symptomatic ICA stenosis.9 The limited number of projections may be a limitation of DSA in the evaluation of high-grade stenosis leading to underestimation of severity.10,11 The standard deviation associated with percent diameter stenosis measurement for 60% stenosis at carotid x-ray angiography across several published studies was reported to be 8%.12 Noninvasive tests like sonography, MR angiography (MRA), and spiral CT angiography (CTA) are increasingly used in clinical routine. They offer multiple projections and the possibility to use cross-sectional images to measure the stenotic lumen. As many as 80% of patients with carotid artery stenosis in the United States were estimated to have undergone carotid endarterectomy without x-ray angiography13; in addition, this approach is considered controversial.14,15
Despite numerous studies comparing MRA or CTA to DSA, only few data have been published concerning the influence of imaging technique and postprocessing technique on stenosis grading in vivo.16–21 The aim of this study was to intraindividually compare the results of high-resolution MRA and multisection CTA and the effect of different postprocessing techniques on stenosis measurement.
Methods
Patients
Sixty-nine consecutive patients who had symptoms related to atherosclerotic carotid artery disease within a 6-month period and ICA stenosis at sonography were screened for inclusion in this prospective study. Patients with contraindications to MR imaging or iodinated contrast material were excluded from the study. Written informed consent was obtained from all patients and the ethics committee approved the study. CTA and MRA were performed within 24 hours of each other.
Nineteen patients were excluded from the study because of the following reasons: technical failure of the CT scanner (2 patients), incomplete MR examinations (2 patients due to claustrophobia, 2 patients rejecting IV contrast material [CM]), only 1 study performed within 24-hour interval (13 patients) as a result of scanner availability or withdrawal from study. Therefore, the study population consisted of 50 patients (34 men, aged 50–84 years; median, 66.5 years; 16 women: 53–82 years; median, 74.5 years).
CT Angiography
CTA was performed with a 16-section-spiral CT scanner (Somatom Sensation 16; Siemens, Erlangen, Germany). An 18-gauge intravenous catheter was placed in an antecubital vein and 60 mL nonionic CM (Ultravist 370; Schering, Berlin, Germany) were injected with a power injector at a rate of 4 mL/s followed by a saline flush of 80 mL. The start delay (TDelay) was individually adjusted with the test bolus method (10 mL of CM, 50 mL of saline, 4 mL/s). The scan volume included the circle of Willis to the aortic arch; scanning was performed in craniocaudal direction. Scanner settings were: 120 kV, 110 eff · mAs, detector collimation, 16 × 0.75 mm; table speed, 18 mm/rotation; rotation time, 0.5 seconds. The patients were instructed to hold their breath during the scan; total scan time was 9 seconds. Sections (1.0 mm) were reconstructed with 0.5-mm increment. The field of view (FOV) was 120 mm, and the resulting voxel size was 0.2 × 0.2 × 0.5 mm3. Average effective dose was 2.4 mSv for female patients and 2.2 mSv for male patients (International Commission on Radiological Protection publication 60, 1990).22
For each carotid artery a thin slab maximum intensity projection (MIP) (10–15-mm slab thickness) in a sagittal oblique projection was created to display vascular anatomy. Based on this MIP, cross-sectional images perpendicular to the longitudinal axis of the ICA at the site of maximum stenosis and a distal reference site were generated with the multiplanar reformation (MPR) technique. On these cross-sectional images, the lumen diameters were measured. Images were displayed with a window/level setting of 700/200 HU; in cases of massive calcification, a wider setting (1100/200 HU) was applied.23
MR Angiography
Two different MRA sequences were performed with a 1.5T MR unit (Symphony; Siemens) with the use of head and neck array coils.
3D time-of-flight (TOF) MRA of the carotid bifurcation settings were: TR, 35 ms; TE, 6.95 ms; flip angle, 25°; rFOV, 150 × 200 mm; matrix, 192 × 512; slab thickness, 57.6 mm; 72 partitions; voxel size after zero-filling, 0.8 × 0.4 × 0.8 mm3; first-order flow compensation; total scan time, 4:02 minutes.
Contrast-enhanced (CE) MRA, coronal 3D fast low-angle shot (FLASH) sequence settings were: TR, 3.78 ms; TE, 1.54 ms; flip angle, 35°; rFOV, 188 × 300 mm; matrix, 160 × 512; slab thickness, 64 mm; 80 partitions; voxel size after zero-filling, 1.2 × 0.6 × 0.8 mm3; scan time, 21 seconds per scan. The patients were instructed to hold their breath during the scan. TDelay was measured with the test bolus method. The 3D-FLASH sequence was performed before and after the injection of the full CM bolus (20 mL of gadolinium-diethylene-triaminepentaacetic acid; flow, 2 mL/s) for subtraction.
The minimal residual lumen diameter and the nonstenotic diameter of the ICA were measured on the MIP image, selecting the outermost margin of the vessel lumen perpendicular to the longitudinal axis of the vessel. In a second session, MRA was analyzed with the MPR method as described above for CTA.
Image Analysis
To reduce errors by measuring the reference lumen at different sites, a senior radiologist reviewed the TOF-MRA studies and specified for each patient the point of reference measurement (normal ICA lumen) by determining the distance from the carotid flow divider to the point of measurement. Four investigators (4–6 years experience in neurovascular imaging) were blinded to the clinical data and each other’s results; the examinations were anonymized and randomly ordered. Each technique was evaluated by 2 investigators independently. CE-MRA and TOF-MRA were evaluated at different sessions with a delay of at least 2 months. CTA and MRA were evaluated interactively on separate workstations with the Syngo-3D platform (Leonardo VD10B; Siemens); the ICA lumen was measured with a digital ruler (resolution, 0.01 cm). The degree of stenosis was calculated with the following equation: stenosis = (1 − minimal residual lumen/distal ICA diameter) × 100%. Because we did not categorize stenosis, we had to assign cases of local signal intensity loss, where no measurements could be taken, an arbitrary value; we chose 90% as the degree of stenosis in these cases.24,25 Cases of near occlusion (defined as a continuously enhanced lumen or a short segment of nonenhanced lumen due to a very tight stenosis and significant narrowing of the poststenotic ICA) were assigned 95% as the degree of the stenosis according to the literature.26 Each investigator subjectively classified the image quality as excellent (no artifacts, no venous enhancement), good (moderate venous enhancement or minimal artifacts but sufficient for diagnostic purposes), poor (reduced contrast-to-noise ratio [CNR] or major artifacts) and insufficient for diagnosis (low CNR or severe artifacts). Examinations with poor image quality were not excluded from the study. Three imaging acquisition methods (CTA, TOF-MRA, CE-MRA) and 2 postprocessing techniques for MRA resulted in 5 different modalities for each carotid artery.
Statistical Analysis
For each of the 5 modalities (CT, CE-MIP, CE-MPR, TOF-MIP, TOF-MPR), the discrepancy between the 2 independent observers was analyzed by scatterplots and intraclass correlation coefficients (ICC). Stenosis values by 2 observers were averaged within the modalities for comparison. Only the symptomatic side was used for statistical analysis. The global null-hypothesis of the equality of the distributions of the stenosis values derived by the 5 modalities was tested using the Friedman test. The assessment of the deflections from the null-hypothesis was performed by simultaneous 95% Tukey confidence intervals (CI) for the mean difference in stenosis in a 1-way layout for the aligned stenosis values. The alignment of the stenosis values by centering the stenosis values for each patient by their mean allows for a comparison of the stenosis differences between patients at a common measurement scale.27 Hypotheses were rejected when the P value of the corresponding test statistic was less than α = 0.05. The relationship of stenosis values (of the symptomatic side only) for 2 modalities or observers are depicted by scatterplots and Bland-Altman plots with slightly jittered values as recommended for the analysis of carotid artery stenosis measurements by Rothwell.28,29 Mutual dependence of image quality and imaging technique was tested with the Fisher exact test. To examine the influence of image quality on differences on stenosis measurement the estimates and 95% CIs were computed for studies with excellent and good image quality only. All computations were performed in the R system for statistical computing;30 simultaneous confidence intervals were computed using the multcomp add-on package.31
Results
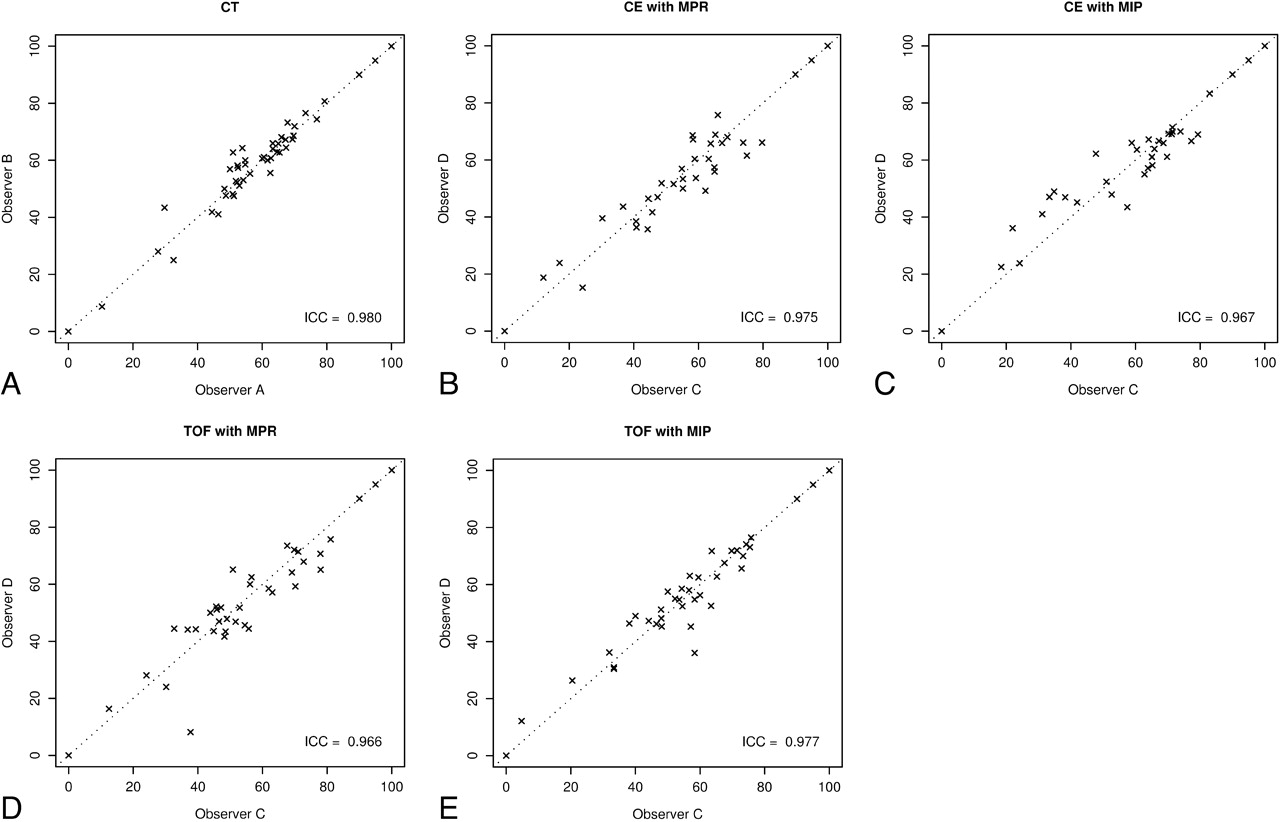
All 3 acquisition methods provided arterial phase images without significant venous enhancement. Overall image quality of the CTA and MRA examinations differed significantly (P < .001, Fisher exact test); in 17 patients, the image quality for CTA was rated 1 or more grades higher than the best MRA sequence, and in 8 patients, the best MRA sequence was rated higher than CTA. Mean grade of stenosis was 60% measured with CT, 67% with CE-MIP, 63% with TOF-MIP, 64% with CE-MPR, and 61% with TOF-MPR, respectively. For the grading of stenosis, no systematic deviations between the 2 observers could be found for any technique. The ICC values and the scatterplots are shown in Fig 1. To test bias from the examiners, CTA and TOF-MIP were evaluated by 1 group; the estimated difference was 0.3% for CTA and −0.5% for TOF-MIP on average.

Variability of stenosis values between 2 observers for the different imaging and evaluation techniques assessed by scatterplots and ICC values showing excellent agreement between the observers.
The 5 modalities differ with respect to the stenosis values; the Friedman test was able to reject the hypothesis of global equality (P < .001). The degree and direction of the deviations were assessed by simultaneous confidence intervals for the difference of stenosis values (Table).
Mean difference in stenosis value and 95% confidence intervals of all symptomatic stenosis for each imaging modality (cases of local signal loss assigned as 90% stenosis)
The highest agreement was found for TOF-MPR and CTA with an estimated difference of 0.6%. CE-MRA differed significantly from CTA, the estimated difference of CE-MIP and CTA was 7.0%, and that of CE-MPR and CTA was 4.0%. TOF-MIP differed significantly from CE-MIP; the estimated difference was −4.2%, indicating that the stenosis values were 4.2% lower with TOF-MIP compared with CE-MIP. The data indicate a trend toward higher degrees of stenosis for MIP compared with MPR for both TOF-MRA and CE-MRA and higher degrees of stenosis with CE-MRA compared with TOF-MRA and CTA. A graphical representation of the confidence intervals is shown in Fig 2, and the stenosis values are depicted in Fig 3.

Comparison of modalities by differences between stenosis values. Pairs of modalities that cross the zero-line are not considered significantly different. In cases of local signal intensity loss, the grade of stenosis was assigned as 90%. On average, stenosis values obtained with CE-MRA and MIP postprocessing were 7% higher than those with CTA. Stenosis values of TOF-MRA with MPR postprocessing were comparable with CTA.

Stenosis values for CTA, CE-MRA, and TOF-MRA evaluated with the MPR method are represented graphically in scatter plots (upper row) and Bland-Altman-plots (lower row). Confidence intervals of the difference in stenosis values are given as gray bands. Highest agreement is found for CTA and TOF-MRA. In cases of local signal loss, the grade of stenosis was assigned as 90%.
When only patients with excellent and good image quality in all of the 3 different image acquisition methods (CTA, CE-MRA, TOF-MRA) were included, the differences between the methods decreased, but the direction of the deviations remained, except for the comparison of TOF-MPR and CTA, where an estimated difference of −0.5% was found.
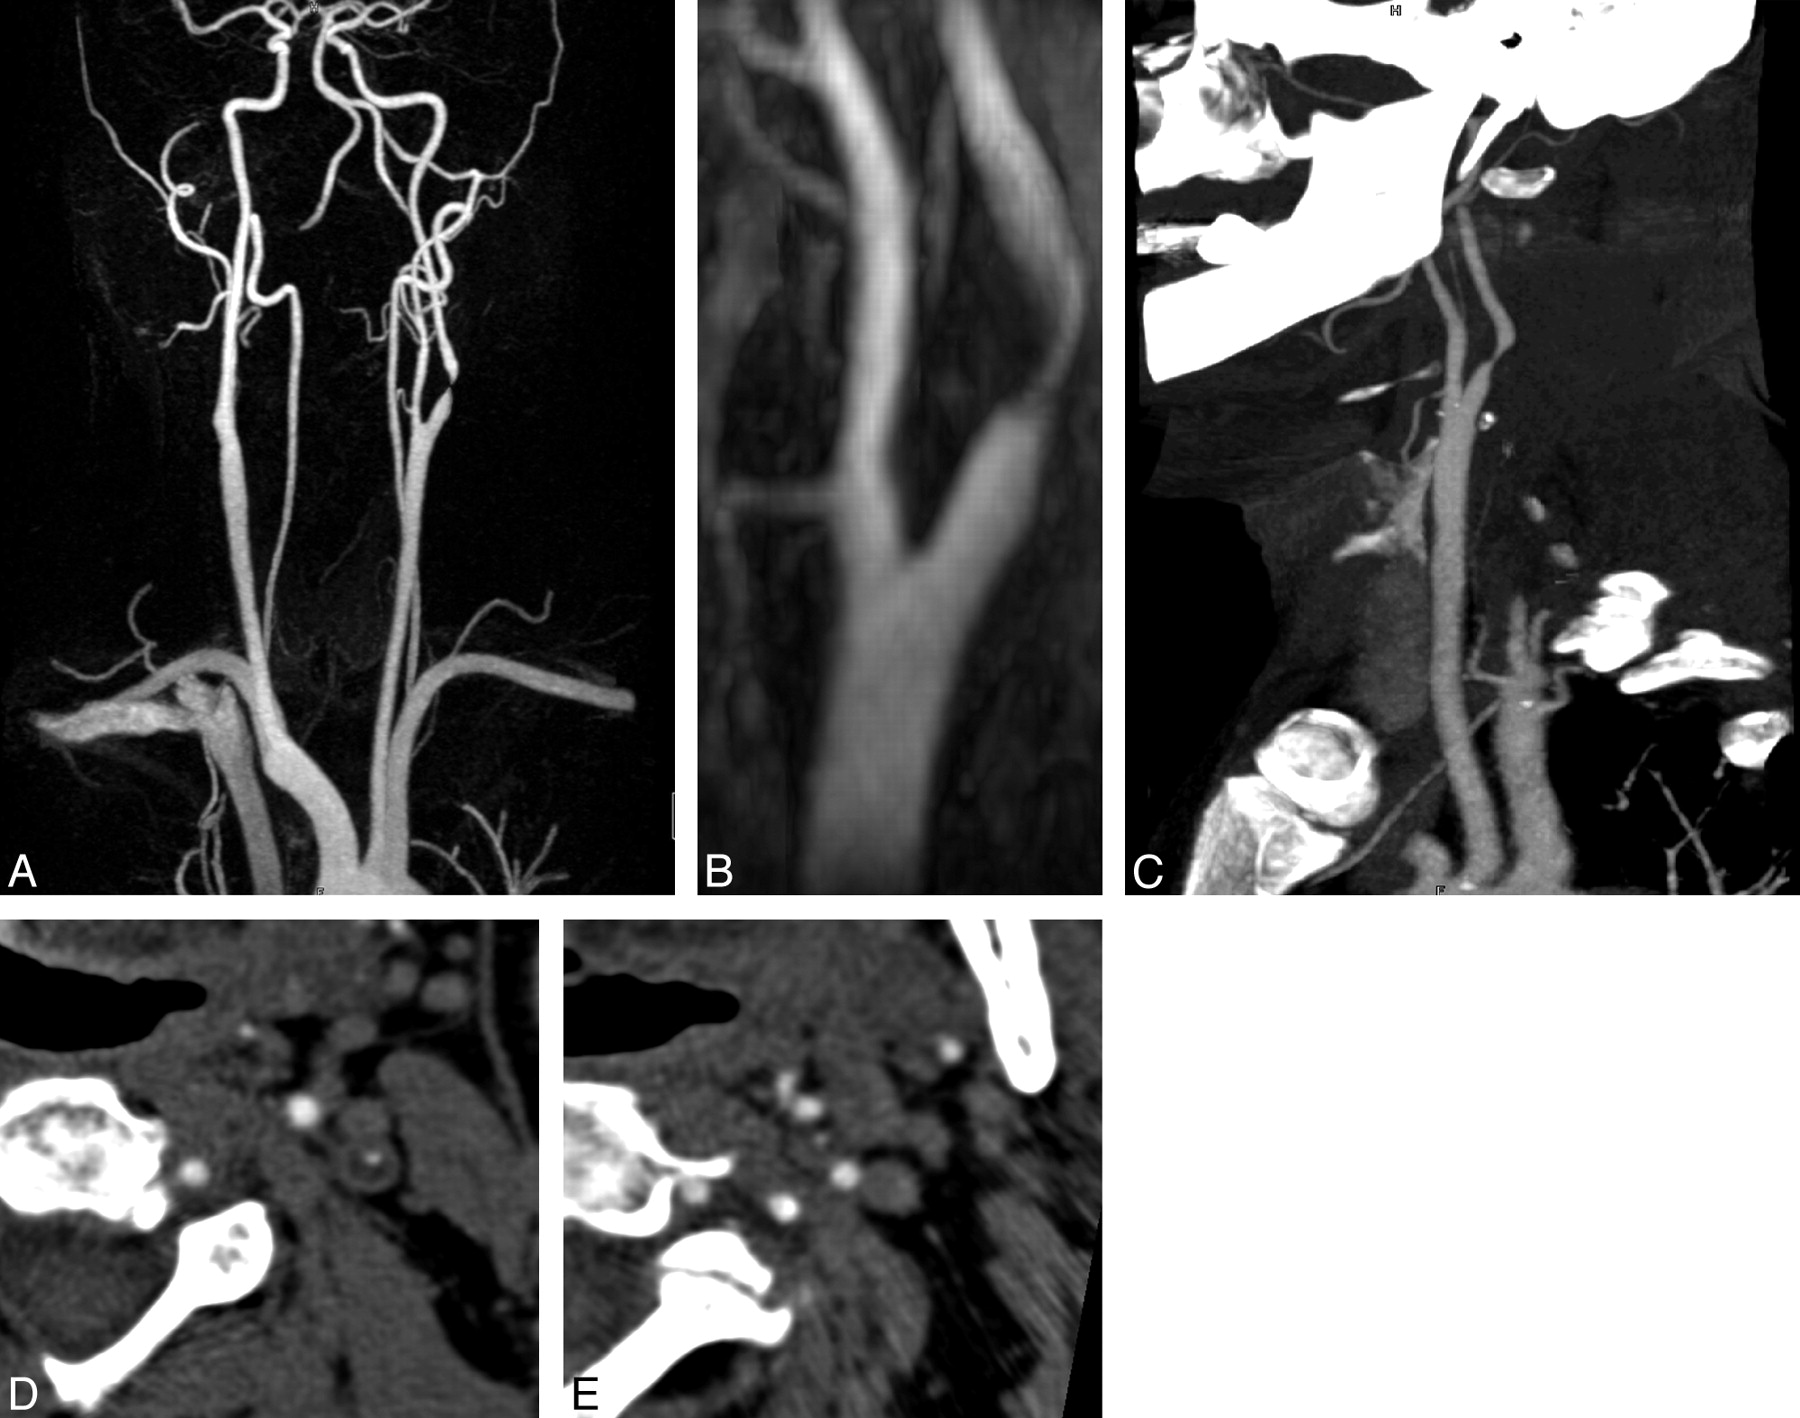
We recorded local signal intensity losses in 12 cases with CE-MRA (Fig 4) and 8 with TOF, whereas on the cross-sectional images of CTA, a residual lumen was depicted in all but 1 case without total occlusion.

Stenosis of the left ICA. Local signal intensity loss at CE-MRA (A) with distal enhancement, but residual signal intensity is detectable with TOF-MRA (B: TOF-MIP) and CTA (C, “scout” MIP; D, transverse MPR at site of minimal lumen; E, transverse MPR at reference site beyond poststenotic dilation). Signal intensity is fading at the edge of the scan volume (B), leading to artificial lumen reduction on MIP images (B).
Excluding cases with local signal intensity loss to avoid bias by arbitrarily assigning a stenosis value resulted in equalizing the estimated differences in stenosis values across the methods, and only borderline significances resulted for TOF-MRA versus CTA and CE-MPR versus CE-MIP (Table).
All 3 image acquisition methods depicted total occlusion in 5 carotid arteries. Another artery was suggested to be occluded on TOF-MRA, but both CE-MRA and CTA could demonstrate distal vessel enhancement; high-grade stenosis was confirmed at surgery.
Discussion
MRA and CTA are promising techniques for detection and grading of carotid artery stenosis. Few studies have been published that focus on the effects of different image acquisition techniques and postprocessing for carotid artery stenosis. In our study, we prospectively compared the findings of multisection CTA and MRA applying standardized protocols for scanning, postprocessing, and measurement to detect the influence of different image acquisition and postprocessing methods on stenosis grading. To reduce errors introduced by different measurement sites of the “nonstenotic” lumen of the ICA,32 the reference site was standardized before evaluation. On average, stenosis values obtained with CE-MIP were 7% higher than those obtained with CTA and 4.2% higher than those obtained with TOF-MIP. CTA and TOF-MRA did not differ significantly. Stenosis led to local signal intensity loss in 12 CE-MRA and 8 TOF-MRA studies, but in only a single CT examination was a “gap” in the ICA detected. It is a phenomenon well known to occur in clinical MRA. Local signal intensity loss is caused by different factors: spin dephasing effects, imaging parameters, and partial volume effects.25,33–36 However, assigning these cases as 90% stenosis may exaggerate the differences between the modalities (see Table, right part). Because we did not categorize the stenoses, we had to determine a certain value as the degree of stenosis.
Besides the acquisition technique, postprocessing can influence the assessment. Lumen measurement can be inaccurate on source images. If the minimal diameter is not perpendicular to the image plane,37 subtle vascular signals may not be distinguished from background signals with the MIP algorithm.38 Calcified plaques preclude MIP evaluation of CTA; therefore, we did not introduce this method in our study. Heavy calcifications or calcified plaque on both sides of the lumen can lead to overestimation of the stenosis in CT39 because of the so called “blooming” artifact. This is why we changed the window-level setting in these cases. The window-level setting is critical; we chose settings proposed in the literature23,40 and validated them with phantom measurements simulating calcified and noncalcified stenosis.
Image quality was found to influence the concordance but to a lesser extent than the type of technique applied. CTA provided higher overall image quality compared with CE-MRA and TOF-MRA. 3D-TOF-MRA was more susceptible to motion artifacts because of the prolonged acquisition time and the limited volume coverage. Tapering vessel walls at the edge of the scan volume may be found on MIP images because of reduction of signal intensity due to increased spin saturation. Image quality in CE-MRA is highly dependent on correct contrast bolus timing and imaging parameters.
Contrary to our study, the only multicenter study including data from multisection CT,41 comparing the results of ultrasound, CTA, and CE-MRA, revealed no significantly different overall concordance rates, but in the subgroup of surgical asymptomatic patients, CTA led to underestimation in 11 of 64 patients. However, the study had some limitations: the study was performed on different scanner types; CTA data acquisition and postprocessing were not standardized, unlike Doppler ultrasound and CE-MRA; and 81.8% of the misclassification came from one center. According to the proposal of Rothwell,28 we did not categorize stenosis but compared the percentage values. These values differed significantly for CTA and CE-MRA, especially if assessed with MIP, whereas the difference between CTA and TOF-MRA was in a range of 0.6–2.8%. The trend toward higher stenosis values in CE-MRA compared with CTA is in agreement with the CARMEDAS study.41
Despite the introduction of CTA in clinical routine, it is still not a standardized method, which explains why results for single-section CTA are rather controversial. A recently published meta-analysis reported sensitivities in the range of 85%–95% and specificities of 93%–98% for detecting severe stenosis (>70%) with CTA.42,43
The largest study comparing DSA and TOF-MRA was published by Nederkoorn et al44; the sensitivity for detecting severe stenosis was 92.2% and specificity was 75.7% for TOF-MRA. CE-MRA tended to overestimate stenosis compared with DSA by a mean bias of 2.4–3.8% according to U-King-Im et al.35 A multivariable receiver operating characteristic curve analysis45 demonstrated that the presence of verification bias predicted the performance of ultrasound, whereas the type of scanner predicted the performance of MRA. Performance of MRA is dependent on multiple factors including spatial resolution, type of sequence, interpolation algorithms, and implementation details,25 making the comparison of results with different MRA techniques difficult.
A limitation of our study is the relatively small patient population; to reduce bias, we analyzed only the symptomatic side of each patient. We did not analyze the performance of duplex sonography, because the examinations were performed in different laboratories with nonuniform equipment and expertise. DSA or—preferably—3D-rotational DSA as a reference standard would have been desirable, but our primary goal was to intraindividually compare the results of high-resolution MRA and multisection CTA and the effect of different postprocessing techniques on stenosis measurement. Defining the site of the distant reference lumen measurement (denominator in the formula) conflicts with clinical practice but was necessary for this study to reduce potential method-independent errors.
In conclusion, we found the grade of stenosis in carotid angiography by CT and MR to be dependent on the examination method (CT, CE-MRA, TOF-MRA) and the postprocessing method (MIP, MPR). The highest agreement was found for CTA and TOF-MRA evaluated with the MPR method, irrespective of assigning cases of local signal intensity loss as 90% stenosis. A separate analysis of all studies without local signal intensity loss indicates that those differences vanish. Further trials will be needed to determine whether the differences are clinically significant in patient outcome.
References
- Received December 24, 2005.
- Accepted after revision March 13, 2006.
- Copyright © American Society of Neuroradiology
In this issue


Jump to section
Related Articles
Cited By...
- CT Attenuation Analysis of Carotid Intraplaque Hemorrhage
- 2011 ASA/ACCF/AHA/AANN/AANS/ACR/ASNR/CNS/SAIP/SCAI/SIR/SNIS/SVM/SVS Guideline on the Management of Patients With Extracranial Carotid and Vertebral Artery Disease: A Report of the American College of Cardiology Foundation/American Heart Association Task Force on Practice Guidelines, and the American Stroke Association, American Association of Neuroscience Nurses, American Association of Neurological Surgeons, American College of Radiology, American Society of Neuroradiology, Congress of Neurological Surgeons, Society of Atherosclerosis Imaging and Prevention, Society for Cardiovascular Angiography and Interventions, Society of Interventional Radiology, Society of NeuroInterventional Surgery, Society for Vascular Medicine, and Society for Vascular Surgery
- 2011 ASA/ACCF/AHA/AANN/AANS/ACR/ASNR/CNS/SAIP/SCAI/SIR/SNIS/SVM/SVS Guideline on the Management of Patients With Extracranial Carotid and Vertebral Artery Disease: A Report of the American College of Cardiology Foundation/American Heart Association Task Force on Practice Guidelines, and the American Stroke Association, American Association of Neuroscience Nurses, American Association of Neurological Surgeons, American College of Radiology, American Society of Neuroradiology, Congress of Neurological Surgeons, Society of Atherosclerosis Imaging and Prevention, Society for Cardiovascular Angiography and Interventions, Society of Interventional Radiology, Society of NeuroInterventional Surgery, Society for Vascular Medicine, and Society for Vascular Surgery
- 2011 ASA/ACCF/AHA/AANN/AANS/ACR/ASNR/CNS/SAIP/SCAI/SIR/SNIS/SVM/SVS Guideline on the Management of Patients With Extracranial Carotid and Vertebral Artery Disease: A Report of the American College of Cardiology Foundation/American Heart Association Task Force on Practice Guidelines, and the American Stroke Association, American Association of Neuroscience Nurses, American Association of Neurological Surgeons, American College of Radiology, American Society of Neuroradiology, Congress of Neurological Surgeons, Society of Atherosclerosis Imaging and Prevention, Society for Cardiovascular Angiography and Interventions, Society of Interventional Radiology, Society of NeuroInterventional Surgery, Society for Vascular Medicine, and Society for Vascular Surgery Developed in Collaboration With the American Academy of Neurology and Society of Cardiovascular Computed Tomography
- Contrast-Enhanced MR Angiography Is Not More Accurate Than Unenhanced 2D Time-of-Flight MR Angiography for Determining >=70% Internal Carotid Artery Stenosis
- High-Resolution 3T MR Angiography of the Carotid Arteries: Comparison of Manual and Semiautomated Quantification of Stenosis