
Abstract
BACKGROUND AND PURPOSE: CT perfusion (CTP) mapping has been reported to be useful in the differentiation of the infarct core and ischemic penumbra. However, the value of the CTP source imaging (CTP-SI) during the arterial and venous phases has not been fully investigated. The purpose of this study was to develop a CTP-SI methodology for acute ischemic stroke and compare its efficacy with cerebral blood flow (CBF) and cerebral blood volume (CBV) in predicting infarct core and penumbra.
MATERIALS AND METHODS: CT examinations, including non-contrast-enhanced CT, CTP, and CT angiography (CTA), were performed in 42 patients with symptoms of stroke for <9 hours. The Alberta Stroke Program Early CT Score (ASPECTS) was analyzed on the arterial phase CTP-SI and venous phase CTP-SI and then compared with the ASPECTS on CBF and CBV for efficacy assessment.
RESULTS: The ASPECTS on the arterial phase CTP-SI was closely correlated with the ASPECTS on CBF, the Pearson correlation coefficient was 0.88 (P < .001), and the concordance correlation coefficient was 0.7603 (95% confidence interval [CI], 0.6331–0.8476). The ASPECTS on the venous phase CTP-SI revealed a significant correlation with the ASPECTS on CBV, the Pearson correlation coefficient was 0.92 (P < .001), and the concordance correlation coefficient was 0.8880 (95% CI, 0.8148–0.9334). Significant differences were shown between the arterial phase CTP-SI/ venous phase CTP-SI (P < .001) and CBF/CBV (P < .001).
CONCLUSIONS: This study provides preliminary evidence that the arterial phase and venous phase CTP-SI mismatch model could possibly be applied to ischemic regions in the acute stage of stroke to determine penumbra and infarct core.
While MR imaging is superior in the diagnosis of acute ischemia, particularly in small vessel and brain stem ischemia,1–4 CT is more accessible and readily available at most centers compared with MR imaging.5–8 Despite its limited spatial coverage, CT is reported to be valuable in patients with hemispheric stroke for characterizing reversible/irreversible tissue and for helping in individual treatment decisions.8–11
Current intravenous thrombolysis criteria are mainly based on the time of onset and extent of ischemic involvement as demonstrated by imaging and the National Institutes of Health Stroke Scale (NIHSS). CT perfusion (CTP) mapping has been reported to be useful in the differentiation of the infarct core and ischemic penumbra.12 However, to our knowledge, the value of the CTP source imaging (CTP-SI) method during the arterial and venous phases has not been fully investigated.
The purpose of this study was to develop a CTP-SI−based method on both arterial and venous phases for acute stroke and to evaluate its effectiveness in estimating the infarct core and ischemic penumbra by comparing it with the gold standard, cerebral blood flow (CBF) and cerebral blood volume (CBV).
Materials and Methods
Patient Selection
We prospectively studied 42 consecutive patients with lesions in the middle cerebral artery (MCA) territory (April 2007-August 2008). Inclusion criteria were the following: arrival <9 hours from onset of stroke symptoms, male or female patients 18–80 years of age, NIHSS score ≥4, no history of stroke or premorbid symptoms, and modified Rankin Scale (mRS) score ≤2. Patients who satisfied these criteria were subsequently excluded for the following reasons: intracranial hemorrhages or brain tumors; NIHSS score ≥25; a history of contrast medium allergy or renal failure; serum glucose level <2.7 mmol/L or >22.2 mmol/L; and degradation of baseline or follow-up imaging examinations by poor imaging quality, including severe motion artifacts. The study protocol was approved by local institutional review board.
Imaging Acquisition
All non-contrast-enhanced CT, CTP, and CT angiography (CTA) examinations were performed on 16-section CT scanners (Somatom Volume Zoom; Siemens, Erlangen, Germany). The imaging protocol included a mandatory admission “one-stop shop” CT examination and a follow-up (2–7 days postadmission) CT/MR imaging of the brain. The admission CT examination included a whole brain contrast-enhanced CT, followed by a 2-level CTP, then a whole-brain CTA. First, the whole-brain contrast-enhanced CT was performed with a section thickness of 9 mm supratentorially and 4.5 mm infratentorially to exclude intracranial hemorrhage. As a follow-up, 2contiguous-section CTP examinations at the level of the basal ganglia/internal capsules and the upper portion of the lateral ventricles were performed, encompassing the anterior, posterior, and MCA territories. A bolus of 40-mL nonionic iodinated contrast agent (iobitridol, 300 mg/mL, Xenetix; Guerbet, Aulnay-sous-Bois, France) was administered into the antecubital vein at an injection rate of 8 mL/s (20-gauge intravenous cannula). Corresponding CT scans were initiated 4 seconds after the injection with the following acquisition parameters: 80 kVp, 209 mA, 1.0 s/rotation, 40-second scanning time, 12 -mm section thickness, and 40 images per section. Finally, a whole-brain CTA was performed with an additional 90 mL of contrast agent, which was injected at a rate of 5 mL/s. The acquisition parameters were 100 kVp, 322 mA, 1.0-mm section thickness, 10-second delay, and 6-second scanning time.
Follow-up imaging was performed on all patients, either with the same CT scanner or by using a 3T MR imaging scanner (Magnetom Trio; Siemens). Axial fluid-attenuated inversion recovery images (TR, 9000 ms; TE, 110 ms; TI, 2500 ms) were used to assess the presence and extent of infarction.
Image Postprocessing
CTP-SIs were loaded from the PACS of our institution onto an off-line workstation (5i3D; Neusoft Medical Systems, Shenyang, China) equipped with postprocessing software, which is a research version of the CTP software of Neusoft Medical Systems used to select arterial phase and venous phase CTP source images and generate CTP color maps.
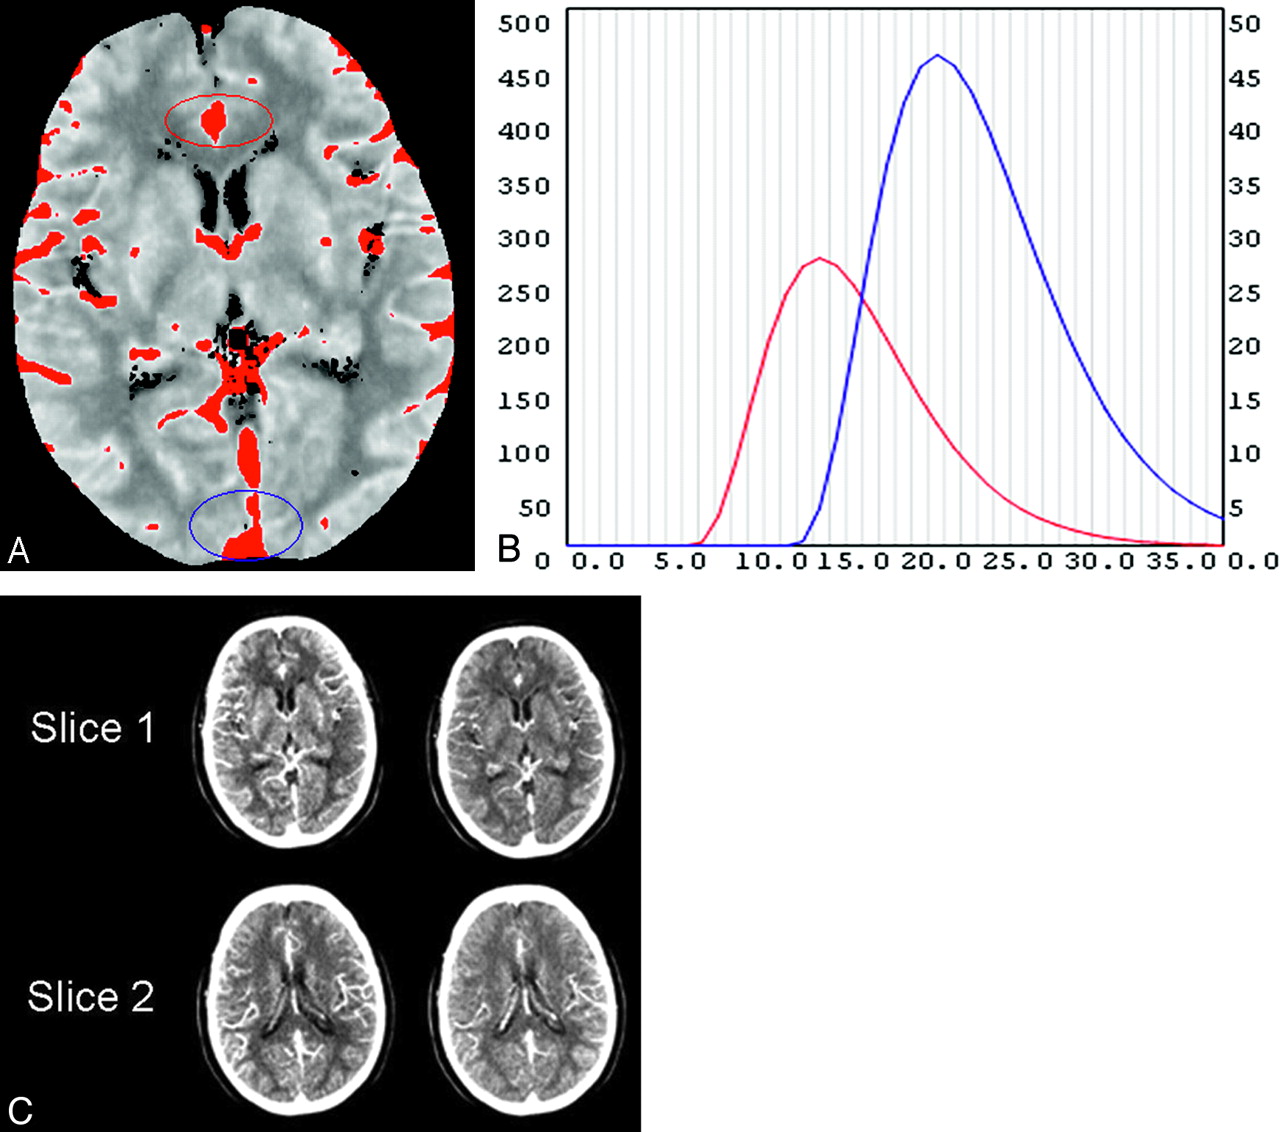
Postprocessing was performed by 2 neuroradiologists (with 5 years' experience in generating and interpreting CTP) from our institution, and they had no other involvement in the study. The raters input the CTP-Sis into the CTP software. After the rater selects 1 section from the 2 axial sections on the CTP-SI, the software will automatically determine the maximum intensity projection (MIP) image (Fig 1A). On the MIP image, the time attenuation curve (TAC) (Fig 1B) was obtained from the anterior cerebral artery and superior sagittal sinuses. The scanning time was 40 seconds, so there were 40 seconds in the horizontal axis in the TAC, the number of time points corresponding to 1 image in each section. The arterial phase CTP-SI and venous phase CTP-SI were respectively obtained at peak points of the arterial (red) and venous TAC (blue) curves (Fig 1C). The other section would be processed the same way. The CTP color map was postprocessed with the same software, which produced CBF, CBV, mean transit time (MTT), and time-to-peak (TTP) maps.

The arterial phase CT perfusion source image (CTP-SI) and the venous phase CTP-SI are respectively obtained at the peak points of the arterial (B, red curve) and venous time attenuation curves (TACs) (B, blue curve). On the maximum-intensity-projection image (A), the region of interest is on the area of the anterior cerebral artery (A, red circle); for the arterial TAC curve (B, red curve), the region of interest is on the area of the venous sinus (A, blue circle) for the venous TAC (B, blue curve). On the TAC (B), the horizontal axis is time (seconds) and the vertical axis is attenuation (Hounsfield units). There are 40 seconds in the horizontal axis, every second corresponding to 1 image in each section. With this patient as an example, the peak point of the arterial phase is 15 seconds after scanning begins (at the peak point of the red curve, B).The arterial phase CTP-SI is the fifteenth image in each section (C, left side); the peak point of the venous phase is 23 seconds after scanning begins at the peak point of blue curve (B). The venous phase CTP-SI is the twenty-third image in each section (C, right side).
Imaging Analysis
The arterial/venous phase source images can be reviewed directly at the CT workstation. Regions of relatively diminished contrast enhancement were scored as abnormal on the arterial phase and venous phase CTP-SIs. For the CBF and CBV maps, the raters visually evaluated each Alberta Stroke Program Early CT Score (ASPECTS) region for relatively low CBF and CBV compared with the mirror region in the contralateral hemisphere.
For quantification of the affected territory of the MCA, the methods described for the ASPECTS were used. In ASPECTS topography, the MCA territory was divided into 10 regions (caudate, lentiform nucleus, internal capsule, insula, and M1-M6).13–15 The ASPECTSs of arterial phase and venous phase CTP-SIs were reviewed first, and CBF and CBV were interpreted at least 1 week later to limit potential recall bias. The raters assessed the imaging independently, blinded to clinical information, and did not know follow-up imaging results.
Statistical Analyses
The unit of analysis was the mean of the 2 raters' ASPECTSs. The relationship between the different imaging parameters (arterial phase CTP-SI and CBF ASPECTS, venous phase CTP-SI and CBV ASPECTS) was analyzed by the Pearson correlation coefficient, the concordance correlation coefficient, and Bland-Altman plots. The Wilcoxon signed rank test was used to assess the differences between the arterial phase CTP-SI and the venous phase CTP-SI. The relationship between the CTP-SI and follow-up imaging was analyzed by the Pearson correlation coefficient. To visually evaluate concordance between raters in assessing ASPECTS in different imaging parameters, we created scatterplots comparing the 2 raters' assessments, with regression lines and 95% limits of agreement; and we also calculated the concordance correlation coefficient by using Pearson statistics. Intraobserver agreements were analyzed by the Pearson correlation coefficient and the concordance correlation coefficient. A P value <.05 was statistically significant. The Statistical Package for the Social Sciences (Version 16.0, SPSS, Chicago, Illinois) was used for statistical analyses.
Results
Patient Characteristics
Forty-two consecutive patients with acute stroke (29 men, 13 women) with a mean age of 57.4 ± 12.2 years were included in this study; the median baseline NIHSS was 10. Fourteen patients received thrombolytic therapy with recombinant tissue plasminogen activator (rtPA). Nine of 14 patients' recanalizations were documented on follow-up CTA or MRA; the other 28 patients did not accept rtPA therapy. Thirteen of 28 patients did not accept arterial occlusion proximal to M3 on baseline CTA nevertheless had infarcts in the MCA territories; thus, spontaneous recanalization of an occlusion was assumed before CT imaging for acute symptoms. Median mRS score at 90 days was 2. All lesions were located in the MCA territory (23 on the left side, 19 on the right side).
Differences between CTP-SIs and CTP Color Maps
The unit of analysis was the mean of the 2 raters' ASPECTSs. The mean ± SD ASPECTS and 95% confidence interval (CI) for the mean in ASPECTS at baseline CTP parameters are shown in the Table. The Wilcoxon signed rank test was used to assess the differences between parameters. Significant differences were shown on arterial phase CTP-SI−venous phase CTP-SI ASPECTSs, CBF–CBV ASPECTSs, and CBF−arterial phase CTP-SI ASPECTSs, whereas CBV ASPECTSs were not significantly different from venous phase CTP-SI ASPECTSs (Table).
Comparison of lesion ASPECTS at baseline CTP-SI and color maps
Relationship between CTP-SIs and CTP Color Maps
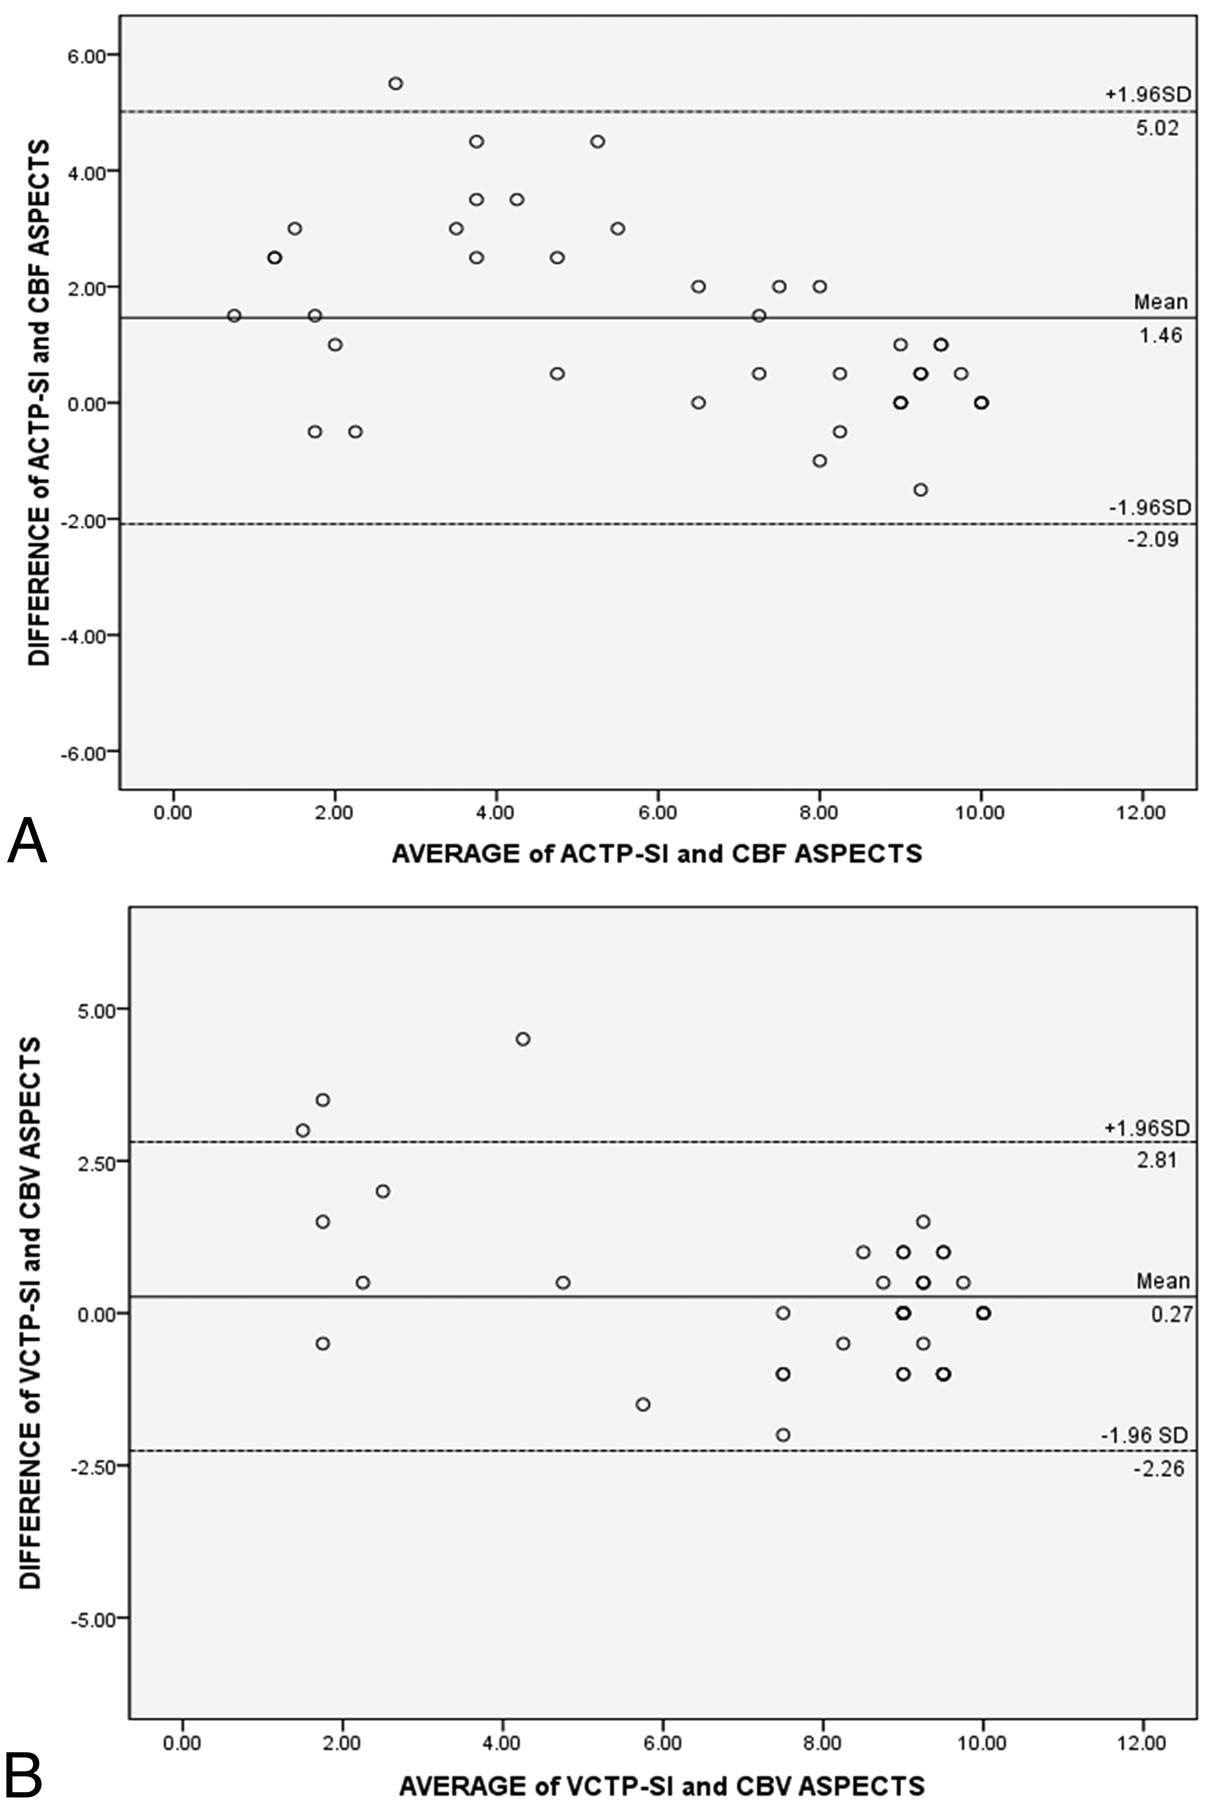
The ASPECTS on the arterial phase CTP-SI was closely correlated with the ASPECTS on CBF. The Pearson correlation coefficient was 0.88 (P < .001), and the concordance correlation coefficient was 0.7603 (95% CI, 0.6331–0.8476). The ASPECTS on the venous phase CTP-SI revealed a significant correlation with the ASPECTS on CBV, the Pearson correlation coefficient was 0.92 (P < .001), and the concordance correlation coefficient was 0.8880 (95% CI, 0.8148–0.9334). Bland-Altman plots that relate differences between the various perfusion parameters are given in Fig 2. The figures demonstrate that the differences were independent from the magnitude of the ASPECTS on the various perfusion parameters. Figure 3 shows an example of CT examinations for a 74-year-old woman by using different approaches.

Bland-Altman plots of the differences against the mean value for the arterial phase CTP-SI (ACTP-SI) Alberta Stroke Program Early CT Score (ASPECTS) and cerebral blood flow (CBF) ASPECTS (A); and venous phase CTP-SI (VCTP-SI) ASPECTS and cerebral blood volume (CBV) ASPECTS (B). The solid line represents the mean bias, and the dotted lines indicate the upper and lower limits of agreement.

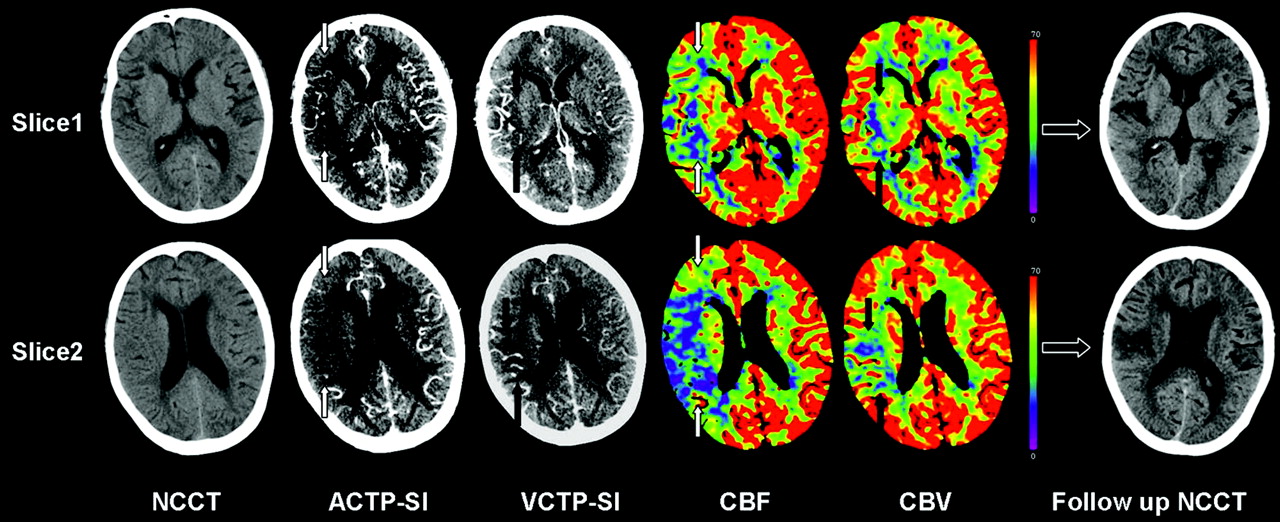
A 74-year-old women imaged 6 hours 40 minutes after sudden onset of left hemiparesis. Non-contrast CT (NCCT) demonstrates sulcal effacement in the right M5 territory, yielding an ASPECTS of 9. ACTP-SI reveals a hypoattenuation in the right middle cerebral artery territory; ACTP-SI ASPECTS is consistent with CBF (white arrows), yielding an ASPECTS of 3. VCTP-SI and CBV ASPECTS is 7 (black arrows), which was confirmed by follow-up NCCT.
Relationship between CTP-SIs and Follow-Up
In 18 patients without recanalization, the ASPECTSs (mean ± SD) on the arterial phase CTP-SI, venous phase CTP-SI, and follow-up were 5.56 ± 2.84, 6.28 ± 2.97, and 4.56 ± 3.46, respectively. Both the arterial phase CTP-SI ASPECTS (r = 0.863, P < .001) and the venous phase CTP-SI ASPECTS (r = 0.874, P < .001) showed significant correlation with follow-up imaging. In 24 patients with recanalization, the ASPECTSs (mean ± SD) on the arterial phase CTP-SI, the venous phase CTP-SI, and follow-up were 7.85 ± 2.24, 9.06 ± 9.24, and 8.77 ± 8.21, respectively. The venous phase CTP-SI ASPECTS showed higher values (r = 0.722, P < .001) with respect to infarction size than the arterial phase CTP-SI ASPECTS (r = 0.620, P = .001).
Interobserver Agreement Determination
Scatterplots comparing each observer's measurements, with confidence bands, are illustrated in Fig 4. The concordance correlation coefficient for the arterial phase CTP-SI ASPECTS was 0.9581 (95% CI, 0.9245–0.9769); 0.9548 (95% CI, 0.9199–0.9747) for the venous phase CTP-SI ASPECTS; 0.9703 (95% CI, 0.9456–0.9839) for the CBF ASPECTS; and 0.9688 (95% CI, 0.9435–0.9828) for the CBV ASPECTS. The resulting values indicated an optimal interobserver agreement.

Scatterplot demonstrating the good agreement between raters for ACTP-SI ASPECTS (A), VCTP-SI ASPECTS (B), CBF ASPECTS (C), and CBV ASPECTS (D) in patients with acute stroke. The best-fit linear regression line (single solid line) and 95% confidence intervals for the data points (paired dotted lines) are shown.
Intraobserver Agreement Determination
The Pearson correlation coefficients for the arterial phase CTP-SI ASPECTS, venous phase CTP-SI ASPECTS, CBF ASPECTS, and CBV ASPECTS were, respectively, 0.983 (P < .001), 0.981 (P < .001), 0.970 (P < .001), and 0.973 (P < .001). The concordance correlation coefficients for the arterial phase CTP-SI ASPECTS, venous phase CTP-SI ASPECTS, CBF ASPECTS, and CBV ASPECTS were, respectively, 0.979 (95% CI, 0.962–0.988), 0.976 (95% CI, 0.958–0.986), 0.969 (95% CI, 0.944–0.983), and 0.971 (95% CI, 0.947–.984). The resulting values indicated an optimal intraobserver agreement.
Discussion
In this study, we developed an arterial phase CTP-SI/venous phase CTP-SI mismatch model. To the best of our knowledge, this is a new CT mismatch model to evaluate penumbra and infarct core in acute ischemic stroke. We had 2 important results: First, there was a mismatch between the arterial phase CTP-SI and the venous phase CTP-SI (P < .001), as well as between CBF and CBV (P < .001). Second, the arterial phase CTP-SI ASPECTS was closely correlated with the CBF ASPECTS, and the venous phase CTP-SI ASPECTS revealed a significant correlation with the CBV ASPECTS.
With our mismatch model, a hypoattenuated area on the venous phase CTP-SI represented an infarct core; the penumbra region was characterized by a mismatch between the arterial phase CTP-SI and the venous phase CTP-SI. This mismatch model differed from previous work because it incorporated 2 different phases, arterial/venous phase CTP-SIs, which improved differentiation between penumbra and infarct core more than 1 phase CTP-SI alone.12
Within a hypoattenuated area on the arterial phase CTP-SI, brain perfusion is altered, while autoregulation is preserved. Vasodilation and recruitment of collaterals lead to an increase on venous phase CTP-SI to maintain CBF.16,17 Our results revealed that venous phase CTP-SI lesions were smaller than arterial phase CTP-SI lesions, and a mismatch that existed between the arterial phase and venous phase CTP-SI might have reflected penumbra. We also found that the arterial phase CTP-SI hypoattenuated areas were, on average, smaller than the CBF hypoperfusion areas. We supposed that arterial phase CTP-SI/venous phase CTP-SI areas were closer to the true salvageable cerebral tissue (progresses to infarction without treatment) than the “penumbra area” from the CBF/CBV mismatch model, which included benign oligemia and penumbra. Obviously, further studies are needed to confirm this supposition.18
Previous studies confirmed that decreased CBV has been shown to be a reasonably reliable marker of the infarct core. The study of Parsons et al12 found that mean CBV and CTP-SI ASPECTSs are predictive of the final infarct ASPECTS in patients with major reperfusion. Our results agree with their findings, though we would point out that their study provided only 1-phase lesions on CTP-SIs.
Some mismatch models have been proposed to define the ischemic penumbra and infarct core from CTP data, including 2 major mismatch models of MTT/CBV and CBF/CBV.16,19,20 Previous studies indicated that abnormal areas on MTT maps were visibly easier to identify than those on the CBF maps, because they covered the whole ischemic area. In this study, we assessed the ASPECTS on CBF maps, because we found that with the CBF map, it was easier to differentiate the small anatomic structures, such as the caudate nucleus, lentiform nucleus, and internal capsule. Although further work is needed to define which parameter is optimal to identify ischemic change, in this study we compared the arterial and venous phase CTP-SIs with, respectively, CBF/CBV to differentiate infarct core and penumbra in acute ischemic stroke.
Acute ischemic stroke requires urgent assessment of the clinical and radiologic features of the brain insult. Discrimination between infarct core and surrounding potentially salvageable tissue is important to better identify patients suitable for treatment. In fact, the identification of the penumbra might allow rtPA use in those patients with large penumbra and small infarct core, even beyond the 3-hour time window.5,6,9,16 The ability to identify an acute ischemic change on CTP color maps is helpful in confirming the diagnosis of acute stroke. While specialized expertise in reliably generating and interpreting these maps is necessary,12,17,21 a CTP-SI is automatically generated during the CTP sequence and does not need any postprocessing. Even medical staff who do not have specialist neuroimaging knowledge can immediately access the CTP-SI at the CT workstation. Moreover, movement artifacts might result in failure in generating CTP color maps.21 In comparison with CTP color maps, movement artifacts on CTP-SIs are not a great hindrance in assessing ischemic brain tissue. These findings could have important implications in emergency treatment.
This study is not without limitations. Our readouts occurred in a sequence of arterial/venous phase CTP-SIs, then CBF and CBV. This review sequence was designed to prevent any possibility of recall bias favoring the CTP-SI, a technique that we hypothesized would be able to delineate infarct and penumbra by using the ASPECTS. However, in doing so, we cannot exclude the possibility that recall bias may have inadvertently increased the accuracy of the CTP color maps.
Conclusions
This study provides preliminary evidence that the arterial phase and venous phase CTP-SI mismatch model could possibly be applied to determine penumbra and infarct core in the acute stage of stroke. Obviously, this technique needs to be tested in a larger randomized prospective trial to examine its efficacy and whether it could be used to guide treatment decisions and possibly improve clinical outcomes.
Footnotes
-
This work was supported by the National Key Project of scientific and technical supporting programs funded by the Ministry of Science and Technology of China during the 11th 5-year plan (No. 2007BAI05B07) and by a grant from the Beijing New Star Plan of Science and Technology (No.2007B047).
Indicates open access to non-subscribers at www.ajnr.org
References
- Received November 18, 2008.
- Accepted after revision May 26, 2009.
- Copyright © American Society of Neuroradiology
In this issue


Jump to section
Related Articles
Cited By...
- Optimal Perfusion Computed Tomographic Thresholds for Ischemic Core and Penumbra Are Not Time Dependent in the Clinically Relevant Time Window
- Pre-intervention triage incorporating perfusion imaging improves outcomes in patients undergoing endovascular stroke therapy: a comparison with the device trials
- CT Angiographic Source Images Predict Outcome and Final Infarct Volume Better Than Noncontrast CT in Proximal Vascular Occlusions