
Abstract
BACKGROUND AND PURPOSE: Aneurysm hemodynamics has been associated with wall histology and inflammation. We investigated associations between local hemodynamics and focal wall changes visible intraoperatively.
MATERIALS AND METHODS: Computational fluid dynamics models were constructed from 3D images of 65 aneurysms treated surgically. Aneurysm regions with different visual appearances were identified in intraoperative videos: 1) “atherosclerotic” (yellow), 2) “hyperplastic” (white), 3) “thin” (red), 4) rupture site, and 5) “normal” (similar to parent artery), They were marked on 3D reconstructions. Regional hemodynamics was characterized by the following: wall shear stress, oscillatory shear index, relative residence time, wall shear stress gradient and divergence, gradient oscillatory number, and dynamic pressure; these were compared using the Mann-Whitney test.
RESULTS: Hyperplastic regions had lower average wall shear stress (P = .005) and pressure (P = .009) than normal regions. Flow conditions in atherosclerotic and hyperplastic regions were similar but had higher average relative residence time (P = .03) and oscillatory shear index (P = .04) than thin regions. Hyperplastic regions also had a higher average gradient oscillatory number (P = .002) than thin regions. Thin regions had lower average relative residence time (P < .001), oscillatory shear index (P = .006), and gradient oscillatory number (P < .001) than normal regions, and higher average wall shear stress (P = .006) and pressure (P = .009) than hyperplastic regions. Thin regions tended to be aligned with the flow stream, while atherosclerotic and hyperplastic regions tended to be aligned with recirculation zones.
CONCLUSIONS: Local hemodynamics is associated with visible focal wall changes. Slow swirling flow with low and oscillatory wall shear stress was associated with atherosclerotic and hyperplastic changes. High flow conditions prevalent in regions near the flow impingement site characterized by higher and less oscillatory wall shear stress were associated with local “thinning” of the wall.
ABBREVIATIONS:
- avg
- average
- GON
- gradient oscillatory number
- IA
- intracranial aneurysm
- max
- maximum
- min
- minimum
- OSI
- oscillatory shear index
- PRE
- dynamic pressure
- RRT
- relative residence time
- UIA
- unruptured intracranial aneurysm
- WSS
- wall shear stress
Unruptured intracranial aneurysms (UIAs) are relatively frequent in the population older than middle age, with a prevalence of approximately 3%.1 Although most UIAs are asymptomatic and are found incidentally, when diagnosed, they cause significant concern because some may eventually rupture, causing aneurysmal subarachnoid hemorrhage, which has a mortality rate of approximately 40%.2 Due to this sinister outcome of aneurysmal SAHs, many diagnosed UIAs are treated to prevent rupture. The currently available treatment options are, however, all invasive interventions that carry a significant risk of morbidity (5%–7%) and even a low risk of mortality (1%).3,4 Interventions to prevent UIA rupture should therefore be focused on those UIAs that are indeed at risk of rupture, especially because many UIAs remain unruptured during the entire lifetime of their carrier.5
An aneurysms ruptures when the mechanical load imposed on its wall exceeds the strength of the wall. This mechanical load may vary depending on physical activity; hence, the most important factor to consider when determining the risk of aneurysm rupture is the strength of the aneurysm wall, which can vary substantially across even UIAs.6 Histologic studies have shown that UIAs can have very different wall structures7,8; this feature is often clear during an operation when the UIA is exposed.9 At the moment, there are no diagnostic tools available to determine the structure of a UIA without direct visualization at an operation.
Flow interacts with the vessel wall and activates signaling pathways that regulate vessel wall remodeling.10 Flows within aneurysms are not physiologic and are influenced by the aneurysm and parent artery geometry, the position of the orifice on the parent artery, and the local angioarchitecture, among other factors.11 However, flow conditions are statistically different between UIAs and ruptured IAs.12⇓–14 Recently, we have shown an association between flow conditions and the overall wall histology of the intracranial aneurysm (IA), as well as with the degree of inflammatory cell infiltration in the IA wall.15 Because our prior results suggest that global flow inside the IA fundus regulates the remodeling of the IA wall, we now investigate whether local flow conditions are associated with the focal variations in the IA wall structure observed during an operation.
Materials and Methods
Patients and Data
Sixty-six patients with intracranial aneurysms treated with surgical clipping were studied. Patients gave informed consent, and the study was approved by the institutional review boards of Helsinki University Hospital, Allegheny General Hospital, and the University of Illinois at Chicago. Video recordings obtained during the surgical procedures were collected. Only aneurysms that were visibly exposed in the videos were included in the study. In the videos of 8 patients, the aneurysm surface could not be reliably visualized, and these cases were discarded. One further case was excluded because it was observed to be heavily thrombosed. The remaining 57 patients had 65 aneurysms that were further studied. Before the operation, 37 of these patients were imaged with 3D CT angiography, and 20, with 3D rotational angiography. The aneurysm and patient characteristics are summarized in On-line Table 1.
Hemodynamics Modeling
Computational fluid dynamics models were constructed from the presurgical 3D images using previously described techniques.16 Blood was mathematically modeled as an incompressible Newtonian fluid, and the 3D unsteady Navier-Stokes equations were numerically solved using finite elements with in-house software.17 Pulsatile inflow boundary conditions were prescribed using flow waveforms measured in healthy subjects and scaled with a power law of the area of the inflow vessel.18 Outflow boundary conditions consistent with the Murray law were prescribed at the outlets.19 Wall compliance was neglected, and no-slip boundary conditions were prescribed at the walls. Numeric simulations were run for 2 cardiac cycles using a timestep of 0.01 seconds, and data from the second cycle were saved for analysis. From the results of the second cycle, the following quantities were computed at the aneurysm wall: oscillatory shear index (OSI), mean wall shear stress (WSS), mean wall shear stress divergence, mean wall shear stress gradient, mean gradient oscillatory number (GON), mean pressure (PRE), and relative residence time (RRT). Here, “mean” refers to the time average of these quantities over the cardiac cycle. The mathematic definitions of these quantities and their meanings are listed in On-line Table 2.
Regional Analysis
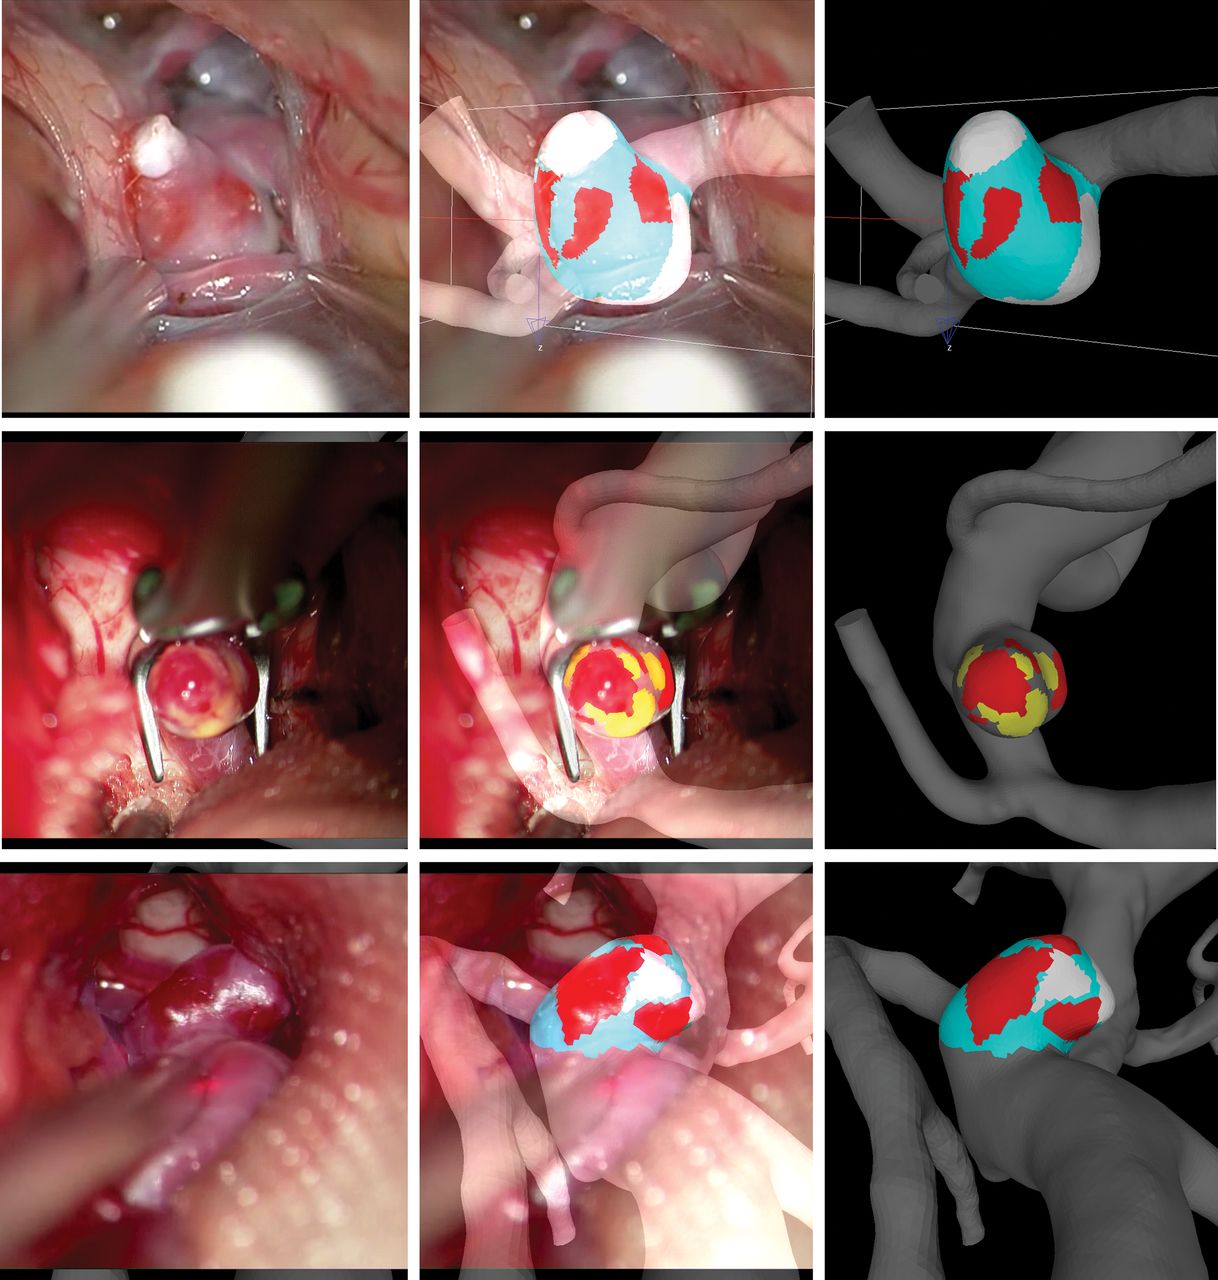
Five types of aneurysm wall regions were considered according to their appearance in the surgical videos: 1) atherosclerotic walls characterized by a yellow appearance; 2) hyperplastic walls that appear white; 3) thin walls with a red translucent appearance; 4) rupture (site visible as a hole in the wall or a hematoma attached to the rupture site [more details in On-line Fig 1]); and 5) normal, the remainder of the wall that had no remarkable features. Note that the exact connection between the visual appearance and the histologic characteristics of these regions remains to be established. Using a recently developed 3D virtual marking tool (ChePen3D),20 we rotated the patient-specific vascular geometry to the same orientation as the surgical view in a superposed semitransparent video frame where the aneurysm is exposed. The different wall regions visible in the video were then marked directly onto the computational fluid dynamics model with different color labels, enabling direct analysis of the relationship between flow and wall features. On average, the areas of the aneurysm not visible in the videos were 28.9% ± 25.6% of the total aneurysm area. Subsequent analysis was restricted to the visible regions. We performed the marking blinded to hemodynamic results. Examples of aneurysm markings are presented in Fig 1.

Marking aneurysm regions in 2 sample aneurysms. Left column, Selected frames of intraoperative videos displaying the aneurysm wall. Center column, Superposition of semitransparent video frame and marked 3D vascular model. Right column, Final virtual marking of aneurysm wall regions (red indicates thin; yellow, atherosclerotic; white, hyperplastic; cyan, normal-appearing).
Once the aneurysm regions were labeled, the maximum (max), minimum (min), and average (avg) of each hemodynamic variable, normalized with the mean value over the aneurysm sac, was computed for each simply connected region of a given wall type. Subsequently, the median and lower and upper quartiles of each variable over the 5 different wall types were computed, and the medians were statistically compared using the nonparametric Mann-Whitney U test. Pair-wise differences were considered significant with P < .05, and the P values were adjusted for multiple testing.
Next, 3 multivariate statistical models were constructed using a regularized logistic regression (Lasso) approach, which reduces overfitting errors. The regularization parameters were computed using a 10-fold cross-validation strategy. In the first model, the atherosclerotic and hyperplastic regions were combined into a single group and compared with the group of normal-appearing walls. In the second model, the thin regions were compared with the normal-appearing walls, and in the third model, the atherosclerotic and hyperplastic regions combined were compared with the thin regions.
Finally, the locations of the different wall regions were visually compared with global flow features such as the inflow jet, regions of flow recirculation and swirling flow, and so forth.
Results
The median and lower and upper quartiles of each hemodynamic variable over each of the 5 wall regions as well as the entire aneurysm sac are presented in On-line Table 3. The P values of pair-wise comparisons between the pathologic and normal-appearing wall regions are listed in Table 1 and those between the different pathologic wall regions, in Table 2. For these comparisons, the hemodynamic variables were normalized with their values over the entire aneurysm sac, to facilitate the comparisons of regions from different aneurysms at different locations. Statistically significant differences adjusted for multiple regions testing are indicated with a “b”, and the region with the higher median is indicated in parenthesis. Variables that remain significant after further adjusting for multiple variable testing are indicated with a “c”.
P values of pair-wise comparisons of pathologic and normal-appearing aneurysm regionsa
P values of pair-wise comparisons of pathologic aneurysm regionsa
Focal Wall Changes Are Associated with Local Flow Conditions
Heterogeneous wall was observed in 59/65 (91%) of the studied IAs during the operation. Compared with wall regions that did not appear hyperplastic, atherosclerotic, or thin during surgical exposure, the local flow conditions at the regions of remodeled wall were different (On-line Table 4). In general, normal-appearing walls had larger ranges (higher maximum and lower minimum) for all hemodynamic variables compared with pathologic regions (either atherosclerotic, hyperplastic, thin, or ruptured).
Characteristics of Flow in Hyperplastic (White) and Atherosclerotic (Yellow) Regions
Compared with normal-appearing regions, hyperplastic regions had lower mean wall shear stress (WSSavg, P = .005) and mean pressure (PREavg, P = .009). Mean variables were not significantly different between atherosclerotic and normal-appearing regions, except for mean wall shear stress, which was lower (WSSavg, P = .01). Atherosclerotic and hyperplastic regions (Table 2) had statistically similar flow features; only minimum pressure was higher in the atherosclerotic regions (PREmin, P = .01). Additionally, atherosclerotic and hyperplastic regions had flow features statistically similar to those in rupture regions except that the mean pressure was higher in the ruptured regions (PREavg, atherosclerotic versus rupture: P = .01; hyperplastic versus rupture: P = .009). In contrast, compared with thin regions, atherosclerotic and hyperplastic regions had slower flows (higher RRTavg, atherosclerotic versus thin: P = .03; hyperplastic versus thin: P < .001), more oscillatory wall shear stress (OSIavg, atherosclerotic versus thin: P = .05; hyperplastic versus thin: P = .04), and more oscillatory shear stress gradients (hyperplastic versus thin: GONavg, P = .002).
Characteristics of Flow in Thin (Red) Regions
Compared with normal-appearing regions, thin (red) regions had faster flows (RRTavg, P < .001), less oscillatory wall shear stress (OSIavg, P = .006), and less oscillatory shear stress gradient (GONavg, P < .001). Additionally, thin regions had higher wall shear stress (WSSavg) than hyperplastic (P = .006) and ruptured regions (P = .01), and they had higher pressure than hyperplastic regions (PREavg, P = .009) but not compared with ruptured regions (P = .09). Compared with ruptured regions, thin regions also had larger wall shear stress (WSSavg, P = .01).
Characteristics of Flow at the Sites of Rupture
Compared with normal regions, the rupture sites had lower wall shear stress (WSSavg, P = .005) and higher pressure (PREavg, P = .03). Most interesting, the pressure (PREavg) was higher in ruptured regions compared with atherosclerotic (P = .01) and hyperplastic (P = .009) regions, but lower than in thin regions (P = .009).
Qualitative Flow Characteristics and Wall Appearance
Qualitatively, thin wall regions tend to be aligned with the flow stream in the aneurysm (approximately 86% of thin regions are aligned with the inflow jet). Thus, they tend to be in regions of faster flow that have higher wall shear stress (approximately 90% of thin regions are observed in regions of high or moderate WSS) and pressure (closer to flow impingement). In contrast, thick (atherosclerotic and hyperplastic) regions tend to be aligned with the ends of the intrasaccular vortices (approximately 61% of thick regions), which are perpendicular to the flow stream. Thus, thick regions tend to coincide with locations of slow swirling flow (approximately 78% of these regions) that have low wall shear stress (approximately 85% of thick regions are observed in regions of low WSS), high residence time, and higher oscillatory wall shear stress and shear stress gradients.
An example is presented in Fig 2. In this case, the aneurysm has a thin (red) region aligned with the inflow jet and under higher wall shear stress and a hyperplastic (white) region under lower wall shear stress that coincides with the end of a vortex core line around which the flow swirls within the aneurysm. Further examples of aneurysms are presented in On-line Figs 2–5.

Sample aneurysm with thin and hyperplastic regions. A, Wall regions (red indicates thin; white, hyperplastic; cyan, normal-appearing). B, Wall shear stress. C, Oscillatory shear index. D, Vortex core lines. E, Flow streamlines. F, Swirling around vortex core lines.
Discrimination of Aneurysm Wall Characteristics Based on Local Flow Conditions
Results of multivariate statistical models built to discriminate among the different aneurysm wall regions are presented in On-line Fig 6. This figure shows receiver operating characteristic curves and calibration plots for the 3 models: 1) atherosclerotic and hyperplastic versus normal regions, 2) thin versus normal regions, and 3) atherosclerotic and hyperplastic versus thin regions. The corresponding areas under the curve were 0.92, 0.97, and 0.70, respectively. These areas under the curve indicate very good discrimination between the pathologic and normal regions and relatively good discrimination between thin and thickened wall regions. Visually, the calibration plots show reasonable fits to the data, with small deviations of the fitted lines from the 45° straight line, which correspond to a perfect goodness of fit.
The coefficients of each hemodynamic variable in each of the 3 models ordered by their importance (influence on the outcome and frequency of inclusion in the model during cross-validation) are presented in On-line Tables 4–6. The most important variables to discriminate atherosclerotic and hyperplastic regions from normal regions were GONmin, RRTavg, maximum wall shear stress gradient, and OSImin,avg. The most important variables to discriminate between thin and normal regions were wall shear stress gradient (min, max), GONavg, RRTmin, max, and PREmax. Finally, the most important variables to discriminate atherosclerotic and hyperplastic from thin regions were RRTavg,max, GONmax, and WSSmin.
Discussion
Flow and Wall Remodeling
The flow characteristics prevalent in atherosclerotic and hyperplastic thick regions of the aneurysm wall are similar to those previously associated with atherosclerosis in arteries,21,22 namely low and oscillatory wall shear stress in regions of slow and recirculating flow. In IAs, these regions tend to be located near the end of intrasaccular vortex core lines and toward the sides of the intra-aneurysmal flow stream. These observations suggest that such low-flow conditions promote wall remodeling that results in local thickening of the wall. This conjecture needs to be further investigated to prove that, indeed, atherosclerotic (yellow) and hyperplastic (white) regions are thicker than normal-appearing walls as suggested by previous studies23,24 and that their histologic characteristics include lipid accumulation, cell proliferation, and so forth. Furthermore, although these regions may be thicker, this characteristic does not automatically imply that they are mechanically stronger. On the contrary, it is plausible that the wall structure and, in particular, the collagen fiber reinforcements in these regions are degraded, resulting in an overall weaker wall region.
In contrast to atherosclerotic and hyperplastic regions, thin wall regions tend to be aligned with the flow stream and located toward the region where the inflow jet impacts the aneurysm wall. These results agree with previous studies in which the authors reported the correlation between the thin region and impingement flow.25 The local flow conditions in these regions seem similar to those that predispose arteries to aneurysm formation,14 (ie, faster flow and wall shear stress and WSS gradient with larger magnitudes and less oscillations). Another study of unruptured aneurysm walls found de-endothelialization as a consistent feature in thinned regions.23 Perhaps these are indications of impaired remodeling of these regions because the time of the aneurysm inception or of degenerative remodeling is associated with abnormally high flow conditions.
Flow as a Trigger of Aneurysm Rupture
Rupture sites share some characteristics with thin wall regions and other characteristics with atherosclerotic and hyperplastic wall regions. Similar to thin regions, rupture sites tend to be aligned with the inflow and have higher pressure (an indication of proximity to the flow-impingement site) than thick wall regions. These features are consistent with previous work in which thin wall regions of unruptured aneurysms coincided with the diverging WSS vector and a local rise in the pressure, again as an indicator of flow impingement.23,26 An earlier study of pathologic changes in the aneurysm wall found that thin, hypocellular, de-endothelialized walls were always ruptured.27 On the other hand, similar to atherosclerotic and hyperplastic regions, ruptured regions tend to have lower wall shear stress, higher oscillatory shear index, and higher oscillations of the shear stress gradient than thin regions. These similarities and differences may suggest that there could be >1 failure mode of the aneurysm wall, one associated with thickened walls and another associated with thinned walls. They are a subject of ongoing investigation.
Diagnostic Application of Computational Fluid Dynamics?
Local hemodynamics-based statistical models seem capable of discriminating between normal-appearing regions of the wall and regions of wall thinning or atherosclerotic thickening. On one hand, this capability suggests that local flow conditions have an important influence on the local evolution and remodeling of the aneurysm wall and, on the other hand, that in principle, they could be used as a surrogate biomarker of the wall status when evaluating patients with cerebral aneurysms.
Comparison with Previous Studies and Limitations
Several previous studies have investigated the relationship between hemodynamics and wall characteristics observed during an operation.9,28⇓⇓⇓⇓–33 Comparisons with our findings are presented in On-line Table 7. In all 3 studies that compared the hemodynamics at the site of rupture and elsewhere in the IA fundus, low WSS was characteristic of the site of rupture. Similarly, higher pressure was characteristic of thin regions in all 3 studies investigating pressures, and prolonged relative residence time was characteristic of a hyperplastic or atherosclerotic wall in all 4 studies investigating thick or atherosclerotic walls. The observation that there are hemodynamic variables that are consistently associated with IA wall characteristics in different studies despite slightly different methodology, study design, and different patient populations implies that these associations are real and potentially causal. Whether the other hemodynamic variables reported to be associated with IA wall type in some of the studies that have not been replicated by others are, in fact, associated with IA wall remodeling or perhaps just covariates or coincidental findings remains to be determined by large studies with sufficient statistical power. These large studies comparing the flow dynamics and the characteristics of the IA wall are also needed to replicate our finding that IA wall type can be relatively accurately predicted with computational fluid dynamics models.
This study has several limitations. Arterial walls were approximated as rigid, and blood was approximated as a Newtonian fluid. Patient-specific flow conditions were not available; therefore, typical flows from healthy subjects were used. Flow variables were normalized with the average values over the aneurysm sac to compare the local hemodynamics of the different regions of aneurysms at different locations. In general, normalized values are more robust with respect to uncertainties in the inflow conditions. Minimum and maximum values of hemodynamic variables computed over tissue regions are less robust than mean values and require finer meshes for a more precise calculation. The identification of the different wall regions was performed subjectively by visual inspection of the intraoperative videos and markings of the corresponding 3D models. Inaccuracies in the definition of small regions in places where the hemodynamic variables are highly heterogeneous can have an effect on the values computed over these regions. The reproducibility of region delineation was not assessed because the regions of each aneurysm were marked by 1 observer. Additionally, the assumptions that yellow regions correspond to atherosclerotic changes, white regions to hyperplastic changes, and red regions to thin decellularized regions needs to be further demonstrated. Finally, the sample size limited the significance of some comparisons, such as those involving rupture sites (n = 13). The trends identified in this study should be confirmed with larger samples.
Conclusions
Local flow conditions are associated with local remodeling of the aneurysm wall. Low flow conditions prevalent in regions of slow-swirling flow characterized by low and oscillatory shear stress are associated with atherosclerotic and hyperplastic changes of the wall. High flow conditions prevalent in regions near the flow impingement site characterized by higher and less oscillatory wall shear stress are associated with local thinning of the wall. Local hemodynamics could, in principle, be used to identify local regions of the wall with different histologic and structural properties. This study demonstrates the value of intraoperative data for understanding the role of intrasaccular hemodynamics in IA wall changes.
Footnotes
Disclosures: Juan R. Cebral—RELATED: Grant: National Institutes of Health, Comments: research grant*; UNRELATED: Grants/Grants Pending: National Institutes of Health, Philips Healthcare, Comments: research grants.* Behnam Rezai Jahromi—UNRELATED: Grants/Grants Pending: Ehrnrooth Foundation, Comments: €19,600 for research purpose as a personal grant; Travel/Accommodations/Meeting Expenses Unrelated to Activities Listed: Neuro Interventional Master Course Frontiers in Neurointerventional Radiology, 2018, Comments: Travel and accommodation expenses for Neuro Interventional Master Course Frontiers in Neurointerventional Radiology, 2018, in Madrid, Spain. Hanna Lehto—UNRELATED: Employment: Heösinki University Hospital. Alexander Yu—UNRELATED: Consultancy: Medtronic, SynAptiv, Karl Storz. Yasutaka Tobe—RELATED: Grant: National Institutes of Health*; UNRELATED: Employment: National Institutes of Health, Comments: I am a postdoctural researcher on this grant.* Juhana Frösen—RELATED: Grant: Finnish Medical Foundation, Kuopio University Hospital.* Anne Robertson—RELATED: Grant: National Institutes of Health*; Provision of Writing Assistance, Medicines, Equipment, or Administrative Support: National Institutes of Health*; UNRELATED: Employment: National Institutes of Health*; Grants/Grants Pending: National Institutes of Health, National Science Foundation*; Payment for Lectures Including Service on Speakers Bureaus: Virginia Tech*; Travel/Accommodations/Meeting Expenses Unrelated to Activities Listed: National Institutes of Health, Virginia Tech, The 13th International Symposium on Biomechanics in Vascular Biology and Cardiovascular Disease, École Nationale Supérieure des Mines de Saint-Étienne.* *Money paid to the institution.
This work was supported by National Institutes of Health grant No. R01NS097457, Kuopio University Hospital and Helsinki University Hospital research funds, and a research grant from the Finnish Medical Foundation.
Indicates open access to non-subscribers at www.ajnr.org
References
- Received September 14, 2018.
- Accepted after revision December 25, 2018.
- © 2019 by American Journal of Neuroradiology


Jump to section
Related Articles
Cited By...
- Radiomic profiling of high-risk aneurysms with blebs: an exploratory study
- Left atrial wall shear stress distribution correlates with atrial endocardial electrogram voltage and fibrosis in patients with atrial fibrillation
- Fluid-structure interaction simulation of tissue degradation and its effects on intra-aneurysm hemodynamics
- Hemodynamics in aneurysm blebs with different wall characteristics
- High Spatiotemporal Resolution 4D Flow MRI of Intracranial Aneurysms at 7T in 10 Minutes