Abstract
BACKGROUND AND PURPOSE: Spontaneous intracranial hypotension is a condition resulting from a leak of CSF from the spinal canal arising independent of a medical procedure. Spontaneous intracranial hypotension can present with normal brain MR imaging findings and nonspecific symptoms, leading to the underdiagnosis in some patients and unnecessary invasive myelography in others who are found not to have the condition. Given the likelihood that spontaneous intracranial hypotension alters intracranial biomechanics, the goal of this study was to evaluate MR elastography as a potential noninvasive test to diagnose the condition.
MATERIALS AND METHODS: We performed MR elastography in 15 patients with confirmed spontaneous intracranial hypotension from September 2022 to April 2023. Age, sex, symptom duration, and brain MR imaging Bern score were collected. MR elastography data were used to compute stiffness and damping ratio maps, and voxelwise modeling was performed to detect clusters of significant differences in mechanical properties between patients with spontaneous intracranial hypotension and healthy control participants. To evaluate diagnostic accuracy, we summarized each examination by 2 spatial pattern scores (one each for stiffness and damping ratio) and evaluated group-wise discrimination by receiver operating characteristic curve analysis.
RESULTS: Patients with spontaneous intracranial hypotension exhibited significant differences in both stiffness and damping ratio (false discovery rate–corrected, Q < 0.05). Pattern analysis discriminated patients with spontaneous intracranial hypotension from healthy controls with an area under the curve of 0.97 overall, and the area under the curve was 0.97 in those without MR imaging findings of spontaneous intracranial hypotension.
CONCLUSIONS: Results from this pilot study demonstrate MR elastography as a potential imaging biomarker and a noninvasive method for diagnosing spontaneous intracranial hypotension, including patients with normal brain MR imaging findings.
ABBREVIATIONS:
- AUC
- area under the curve
- CVF
- CSF-venous fistula
- FDR
- false discovery rate
- MCALT
- Mayo Clinic Adult Life span Template
- MRE
- MR elastography
- nm
- normal
- SIH
- spontaneous intracranial hypotension
- SVM
- support vector machine
Spontaneous intracranial hypotension (SIH) can present with debilitating symptoms and is caused by spontaneous CSF leakage from the spine. Identified leaks can be subtyped into dural tears (ventral type 1a, posterolateral type 1b), ruptured meningeal diverticula (type 2), or CSF-venous fistula (CVF) (type 3), the last of which is only diagnosed with a myelogram requiring lumbar puncture.1 While patients with SIH most frequently present with orthostatic headaches, they can also present with other nonspecific symptoms such as nausea, neck pain, hearing changes, dizziness, or even behavioral changes mimicking dementia.2 As part of the diagnostic work-up of SIH, brain MR imaging can show diffuse dural thickening and enhancement, subdural fluid collections, venous distension, and morphologic changes of brain sag.3 Up to 20% of patients with SIH, however, have normal findings on brain MR imaging.2 Additionally, CSF pressures can be misleading, because most patients with SIH have a normal opening CSF pressure.4 Patients with a delay in diagnosis can have increased morbidity.5 Thus, the search for additional noninvasive tests to diagnose SIH and accurately triage patients to undergo myelography is critical in the treatment of these patients.
MR elastography (MRE) is a noninvasive technique to measure tissue mechanical properties.6 During the application of external vibration, a phase-contrast MR imaging pulse sequence is used to measure the resulting displacement field. Tissue mechanical properties are then estimated from the displacement field with an inversion algorithm, which can include measures of elasticity and viscosity. MRE has been used to evaluate brain shear stiffness (or simply stiffness) in many other conditions including brain tumors, Alzheimer disease, demyelinating and neuroinflammatory disorders, amyotrophic lateral sclerosis, and traumatic brain injury.7,8 The purpose of this study was to use MRE to measure brain stiffness and damping ratio in patients with known SIH and compare them with controls. We hypothesized that there will be stiffness changes at the vertex in addition to the brainstem from the effects of brain sag.
MATERIALS AND METHODS
Patient Selection
After we obtained institutional review board approval and written informed consent, brain MRE examinations were performed on 15 patients with SIH who were diagnosed with a CVF from September 2022 to April 2023. Dynamic myelogram images diagnosing the CVF were obtained and interpreted by one of our board-certified neuroradiologists who specializes in CSF leaks. The CVF was subsequently verified by an additional neuroradiologist (I.T.M.). All patients met The International Classification of Headache Disorders-3 criteria for SIH. The number of days between diagnostic myelography and MRE was recorded. MRE was performed before catheter embolization treatment. Patient age, sex, and symptom duration were recorded. Brain MRIs were reviewed for the Bern score.9
Image Acquisition
MRE data and T1-weighted anatomic images were collected on 3T MR imaging scanners (GE Healthcare). All MRE examinations were performed at 60 Hz with 3-mm resolution.
Data from 44 control participants (age range, 56–89 years) were included from a previously published study.10 This cohort was scanned on a 3T GE Healthcare scanner and confirmed to be negative for amyloid-PET and cognitive impairment. In this cohort, an inversion recovery echo-spoiled gradient echo (the pulse sequence was used for anatomic imaging with parameters including an imaging matrix of 256 by 256 pixels, TR/TE of 6.3/2.8 ms, flip angle of 11°, inversion time of 400 ms, FOV of 27 cm, and bandwidth of 31.25 kHz). The MRE data were acquired using a spin-echo echo-planar imaging technique at 60-Hz vibration. The acquisition parameters were the following: TR/TE of 3600/62 ms, FOV of 24 cm, imaging matrix of 72 × 72 reconstructed to 80 × 80, 48 contiguous 3-mm-thick axial slices, one 18.2 -ms motion-encoding gradient on each side of the refocusing radiofrequency pulse, motion-encoding in x, y, and z directions, and 8 phase offsets spaced evenly during a period corresponding to 60-Hz motion.
The remaining 21 control participants (range, 19–53 years of age) and 15 patients with SIH (range, 35–70 years of age) were scanned on a compact GE Healthcare 3T system.11,12 The controls in this cohort did not have any neurologic conditions or increased intracranial pressure. Anatomic images were obtained using a T1-weighted MPRAGE acquisition with parameters of TR/TE of 6.1/2.5 ms, inversion time of 600 ms, flip angle of 8°, FOV of 160 × 160 mm, image matrix of 256 × 256, section thickness of 1.2 mm, and acquisition time of 4 minutes 18 seconds. MRE acquisition was performed using a flow-compensated spin-echo echo-planar imaging method, and vibrations were applied by a pneumatic actuator with a frequency of 60 Hz. The acquisition parameters were TR/TE of 4000/59 ms, FOV of 24 × 24 cm, image matrix of 80 × 80, 48 contiguous 3-mm-thick axial slices, one 16.7 -ms 8-G/cm motion-encoding gradient on each side of the refocusing pulse, motion-encoding in x, y, and z directions, and 8 phase offsets spaced evenly over 1 period corresponding to a motion of 60 Hz.13
Viscoelastic Property Map Estimation
Stiffness and damping ratio maps were computed by neural network inversion.14 The shear modulus of a viscoelastic material at a given frequency is given by the complex valued quantity G = G’ + iG″. From this modulus, stiffness is computed as 2|G|2/(G’+|G|), and the damping ratio is the defined as  .15,16 Training data were generated with a finite difference model of the wave equations, assuming harmonic motion in linear viscoelastic materials using a random distribution of shear moduli (stiffness range, 1–5 kPa; damping ratio range, 0–0.5), which was described in detail in previous studies.14,17 The true mechanical properties were spatially varied to relax the tissue homogeneity assumption. From the training set, random patches were selected and randomized by the application of phase cycling, noise, and masking. Separate neural networks were trained to estimate the stiffness and damping ratio using Keras and TensorFlow backend.18,19 Training was performed with an Adam optimizer using a batch size of 100 and 1000 batches per epoch.20 Two learning rates were used (0.001 and 0.0001), and learning was stopped at each rate when the mean squared error did not improve for 3 consecutive epochs.
To apply the Neural Network Intelligence (NNIs) in vivo, first, we computed tissue probability maps for each participant using the unified segmentation algorithm in SPM12 software (http://www.fil.ion.ucl.ac.uk/spm/software/spm12) and tissue priors from the Mayo Clinic Adult Life span Template (MCALT).21,22 T1-weighted images were registered and resliced to the MRE magnitude image (T2-weighted), and segmentation was performed according to both channels to obtain tissue probability maps in MRE space. A brain mask was computed to indicate voxels with a combined probability of white and gray matter tissues greater than the probability of CSF. The inverse deformation field was applied to the MCALT lobar atlas to obtain these region assignments in MRE space.
Displacement data were filtered to reduce interslice phase discontinuities,23 unwrapped by using a graph cuts algorithm,24 and an adaptive curl operator was applied to reduce the effects of longitudinal waves on shear property estimation. Each examination was processed in 3 subregions to avoid processing across the major dural folds, which act as shear wave sources. These subregions, defined as the intersection of relevant lobar atlas assignments and the brain mask, were the left cerebrum plus the corpus callosum, right cerebrum plus the corpus callosum, and the cerebellum plus the brainstem. Because the corpus callosum is included in 2 subregions, final estimates were computed as the average of the 2 subregion estimates. This procedure was repeated for the stiffness and damping ratio separately.
Voxelwise Mapping
Using the previously computed deformation field, we warped mechanical property maps into the MCALT space using nearest-neighbor interpolation. Then at each voxel, a linear model was fit to stiffness estimates at each voxel with predictors, including a constant, age, age2, sex, and a categoric variable for the diagnosis of SIH. These predictors were included because the brain stiffness has been shown to be associated with age and sex,10 and these effects could obscure the SIH effect. A quadratic term for age was included because of the wide age range of study participants, resulting in a significant nonlinear age effect on both mechanical properties, as shown in the Online Supplemental Data. A t test was performed on the SIH predictor, and false discovery rate (FDR) correction was applied according to the method of Storey, with Q < 0.05 considered significant. An additional categoric predictor for the scanner was evaluated, but the scanner predictor was excluded because none of the voxels were found to have a significant effect after the FDR correction.
Pattern Analysis
We used a previously described pattern analysis to summarize each participant’s MRE findings.25 For computing an individual’s pattern scores with leave-one-out cross-validation, first their viscoelastic map was held aside and voxelwise modeling was performed in the remaining participants (with the same predictors as above). The map of the held-out individual was corrected for age, sex, and the mean viscoelastic property on the basis of the modeling result. Then a correlation coefficient was calculated between the corrected viscoelastic property map and a map of the expected SIH effect and converted to a z score via the Fisher transformation. For each participant, the z scores were calculated separately for the stiffness and damping ratio maps and used as features in a support vector machine (SVM) classifier with a linear kernel and box constraint of 1. Using leave-one-out cross-validation, we evaluated the SVM model for its ability to distinguish the SIH group from the control group as measured by accuracy and the area under the receiver operating characteristic curve. Including the scanner effect slightly improved the estimated area under the receiver operating characteristic curve and accuracy, but the scanner effect was not statistically significant. Therefore, we excluded it and opted to report the more conservative result.
RESULTS
Fifteen patients with confirmed CVF were enrolled and imaged with brain MRE. Eleven patients had a CVF diagnosed with digital subtraction myelography,26,27 and 4 patients were diagnosed with dynamic photon-counting CT myelography (CTM).28 Nine patients (60%) were women. The mean age was 53.2 years (range, 35–70 years). The mean Bern score was 4.7 (range, 0–9). Four patients had a Bern score of 0. Symptom duration ranged from 1 month to 6 years. All 15 patients reported headache. Thirteen (86.7%) had orthostatic headache, while the remaining 2 (13.3%) had headaches that worsened with exertion. Five patients (33.3%) had photophobia, and 10 (66.7%) patients reported tinnitus. MRE was performed at least 1 day after myelography (mean, 10.7 days; range, 1–77 days).
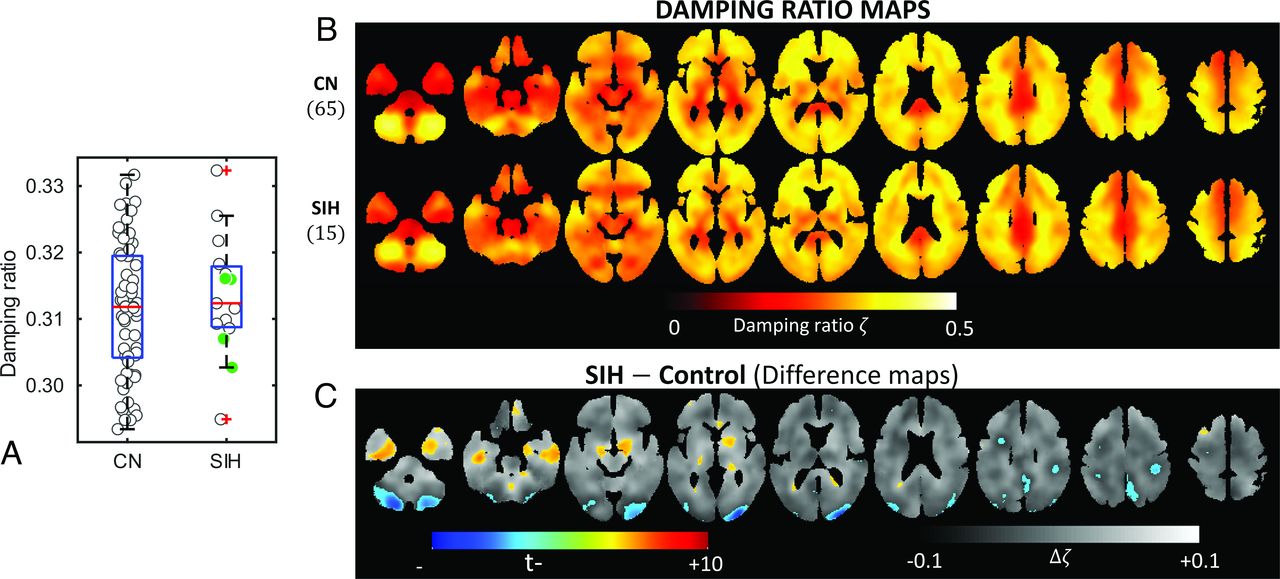
Global stiffness (Fig 1A) and damping ratio (Fig 2A) estimates did not significantly differ between control participants and patients with SIH, but significant clusters were detected for each measure by voxelwise modeling. Mean stiffness maps for each group are shown in Fig 1B, while differences are shown in Fig 1C. Patients with SIH had increased brain stiffness in the periventricular structures, including the medial basal forebrain, right periatrial white matter, and anterior corpus callosum and decreased stiffness toward the cerebellum and the frontal lobe around the ventricle (t test, Q < 0.05, 9037 significant voxels detected). The findings were more pronounced when evaluating the damping ratio (Fig 2B, -C), with patients with SIH having additional voxels of a decreased damping ratio in the occipital poles and posterior cerebellum. The inferior temporal lobes also demonstrated an increased damping ratio in patients with SIH (19,103 significant voxels detected).

A, Group-wise boxplot and mean stiffnesses of individuals shown with a jitter plot. The solid (green) markers are cases of SIH-nm. B, Averaged stiffness maps of the controls and patients with SIH (upper row) and a difference map between the 2 groups (lower row). The SIH group has increased stiffness around the ventricles compared with the controls as seen in the difference plots (C) around the frontal horns and atria of the lateral ventricles. There is also softening around the frontal horn of the right lateral ventricle in the SIH group. A gray-scale map in the difference maps shows the plain difference between the groups, and the colormap shows the positive false discovery thresholded (Q < 0.05, t-statistics map); 9037 voxels reach the positive false discovery threshold for the stiffness difference maps. CN indicates control.

A, Group-wise boxplot and mean damping ratios of individuals shown with a jitter plot. The solid (green) markers are SIH-nm cases. B, Averaged damping ratio maps of the controls and patients with SIH (upper row) and a difference map between the 2 groups (lower row). There is an increased damping ratio around the lateral ventricles and inferior temporal lobes in patients with SIH as seen in the difference maps (C). There are additional areas of decreased damping ratio in the occipital poles and posterior cerebellum compared with decreased stiffness around those areas. CN indicates control.
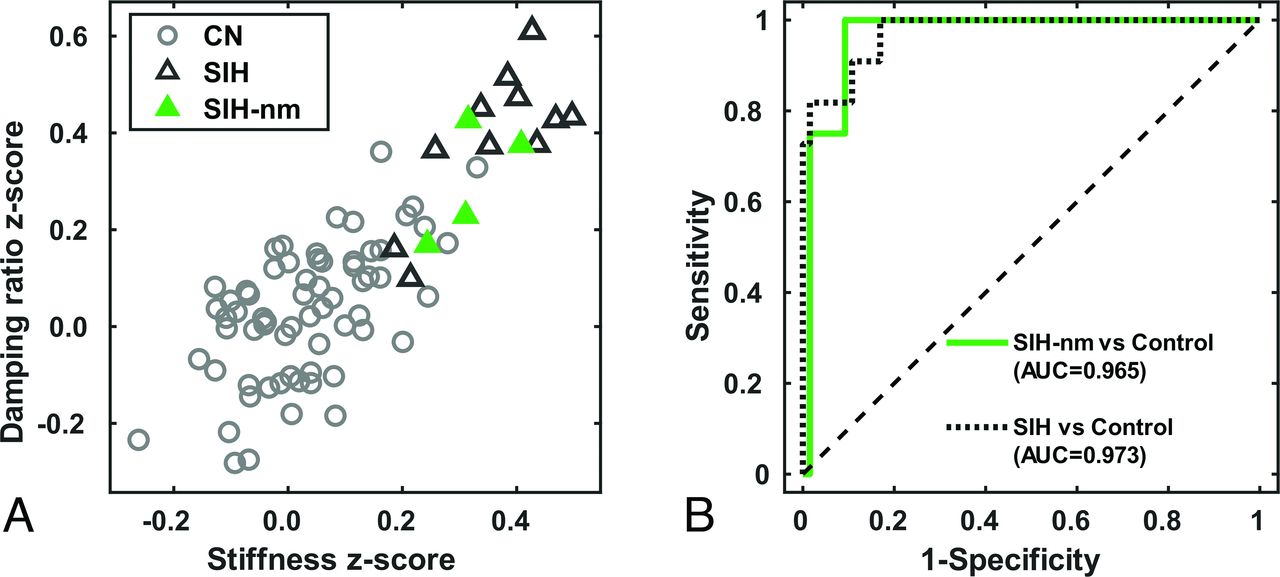
Results from the pattern analysis are summarized in Fig 3. Patients with SIH clustered distinctly from controls (Fig 3A). Overall, patients with SIH had an area under the curve (AUC) of 0.97 compared with controls. Four patients with normal brain MR imaging findings (Bern score 0 and labeled as SIH-nm) also had high stiffness and damping ratio z scores compared to controls. The SVM classifier had an AUC of 0.97 and an accuracy of 94% for distinguishing those with SIH-nm from controls as shown in Fig 3B. The cases with MR imaging features of SIH had an AUC of 0.97 and accuracy of 92%.

Leave-one-out pattern analysis correlation z score plot (A) and the receiver operating characteristic curve (B) from a cross-validated SVM model using the z scores as predictors for distinguishing patients with SIH from controls. Patients with SIH are shown with triangular markers separated into distinct clusters in the pattern analysis plot. The solid (green) triangular markers are patients with SIH with Bern 0 brain MR imaging, labeled as SIH-nm, compared with the open triangular markers that show some degree of sag on MR imaging. The SVM model has an AUC of 0.97, overall distinguishing SIH from controls, and 0.96 for distinguishing SIH-nm from controls. CN indicates control.
DISCUSSION
In this study, we demonstrated that patients with SIH have distinct brain stiffness and damping ratio patterns relative to controls and can be distinguished by using a machine learning classifier. This finding potentially has clinical significance because patients with SIH can present with nonspecific symptoms and normal findings on brain MR imaging. An efficient work-up and diagnosis of SIH is paramount, because a delay in SIH diagnosis can lead to increased patient morbidity. Thus, MRE merits further investigation as a potential noninvasive imaging biomarker for SIH.
Previous studies have reported on both qualitative and quantitative brain MR imaging findings that suggest SIH.9,29⇓-31 A systematic review and meta-analysis revealed that 19% of patients with SIH have normal findings on brain MR imaging.2 Schievink et al32 later studied 60 patients with orthostatic headache and normal brain and spine imaging findings and found that 10% of those patients had a CVF. This cohort of patients with SIH and normal findings on brain MR imaging presents 2 problems: First, the presumed exclusion of SIH based on normal findings on brain MR imaging leads to underdiagnosis. Second, many patients who do not have SIH end up undergoing an invasive myelogram, driven by high clinical concern and the lack of objective data with high sensitivity that can exclude SIH. Our study, while only including a small number of patients as pilot data, is the first step in working toward a quantifiable approach that can help address these problems.
Multiple prior studies have used brain MRE to evaluate stiffness changes with increased intracranial pressure. Using a porcine model, Arani et al33 demonstrated that MRE brain stiffness measurements changed with acute intracranial pressure increases. Kolipaka et al34 found increased global brain stiffness in patients with idiopathic intracranial hypertension compared with healthy controls. Later, Cogswell et al13 found increased brain stiffness pattern scores in patients with idiopathic intracranial hypertension, which were reversable after continuing treatment. No prior work has been performed with MRE to measure brain stiffness in patients with SIH. We found clusters of voxels with increased stiffness and damping ratio along the inferior temporal lobes, medial basal forebrain, anterior corpus callosum, and periatrial white matter and decreased stiffness and damping ratio toward the occipital lobe, cerebellum, and posterior parietal lobe. When designing this study, we hypothesized that changes in brain stiffness would occur at the vertex as well as in the brainstem, due to morphologic changes of brain sag. Our study found that this hypothesis was not the case. The exact etiology that preferentially alters stiffness in the central and inferior structures is unclear, but perhaps is due to downward pressure on the brain from the loss of spinal CSF. Alternatively, brain stiffness changes related to altered venous outflow or glymphatic flow could contribute to these findings but would need further exploration.
Most interesting in our study, 4 of the 15 patients had a Bern score of 0 but still exhibited the characteristic brain stiffness and damping ratio patterns similar to those in the cases with SIH with higher Bern scores. While SIH symptomatology is frequently orthostatic, it is unknown whether imaging findings of brain sag and venous distension can normalize in the supine position. Our findings could be explained by 2 potential phenomena: Supine positioning could alleviate brain sag and venous distension while brain stiffness changes persist, or brain stiffness changes could occur before the patient develops brain sag and venous engorgement. This is an area for future investigation.
The main limitation of this study is the small number of patients with SIH, particularly the cases with normal MR imaging findings. A larger sample will first enable lower-variance validation designs to provide more stable estimates of out-of-sample accuracy and also allow analysis of subgroups, particularly those stratified by brain MR imaging findings or symptoms. This pilot study serves as a starting point that warrants further investigation to determine the potential value of MRE in diagnosing SIH and providing a new window into its etiology.
CONCLUSIONS
This study used MRE to evaluate patients with SIH and found distinct stiffness and damping ratio patterns in patients with SIH relative to controls, including patients with normal findings on brain MR imaging. This pilot study introduces MRE as a new potential imaging biomarker and diagnostic test for SIH.
Footnotes
This work was supported by the National Institutes of Health (R37 EB001981 and R01 AG076636).
Disclosure forms provided by the authors are available with the full text and PDF of this article at www.ajnr.org.
Indicates open access to non-subscribers at www.ajnr.org
References
- 1.
- 2.
- 3.
- 4.
- 5.
- 6.
- 7.
- 8.
- 9.
- 10.
- 11.
- 12.
- 13.
- 14.
- 15.
- 16.
- 17.
- 18.
- 19.
- 20.
- 21.
- 22.
- 23.
- 24.
- 25.
- 26.
- 27.
- 28.
- 29.
- 30.
- 31.
- 32.
- 33.
- 34.
- Received November 3, 2023.
- Accepted after revision January 3, 2024.
- © 2024 by American Journal of Neuroradiology