
Abstract
BACKGROUND AND PURPOSE: MR Spectroscopy (MRS) has the unique ability to analyze tissue at the molecular level noninvasively. The purpose of this study was to determine if peak heights revealed by proton MRS (1H-MRS) signals showed that neural networks (NN) provided better accuracy than linear discriminant analysis (LDA) in differentiating head and neck squamous cell carcinoma (SCCA) from muscle
METHODS: In vitro 11-T 1H-MR spectra were obtained on SCCA tissue samples (n = 16) and muscle (n = 12). The peak heights at seven metabolite resonances were measured: olefinic acids at 5.3 ppm, inositol at 3.5 ppm, taurine at 3.4 ppm, choline (Cho) at 3.2 ppm, creatine (Cr) at 3.0 ppm, sialic acid at 2.2 ppm, and methyl at 0.9 ppm. Using leave-one-out experimental design and receiver operating characteristic curve analysis, the ability of NN and LDA classifiers to distinguish SCCA from muscle were compared (given equal weighting of false-negative and false-positive errors). These classifiers were also compared with an existing method that forms a diagnosis by using LDA of the Cho/Cr peak area ratio.
RESULTS: NN classifiers, which were identified using height data, achieved better sensitivity and specificity rates in distinguishing SCAA from muscle than did LDA using height or area data. Sensitivity/specificity for the NN analysis of the seven metabolite peak heights were 87.5% and 83.3%, respectively, for a one-hidden-node network and 81.2% and 91.7%, respectively, for a two-hidden-node network. Additional nodes did not improve accuracy. The sensitivity and specificity were 81.2% and 50%, respectively, for LDA of the seven peak heights, and 68% and 83%, respectively, for LDA of the Cho/Cr peak area ratio.
CONCLUSION: NN classifiers with peak height data were superior to LDA of the peak heights and LDA of the Cho/Cr peak area ratio for differentiating SCCA from normal muscle. These results show neural network analysis can improve the diagnostic accuracy of 1H-MRS in differentiating muscle from malignant tissue. Further studies are necessary to confirm our initial findings.
MR spectroscopy (MRS) has the unique ability to analyze tissue at the molecular level noninvasively. MRS has been used in the diagnosis of tumors of the brain (1–3), head and neck (4), lung (5), prostate (6), thyroid (7), and breast (8, 9), with good success.
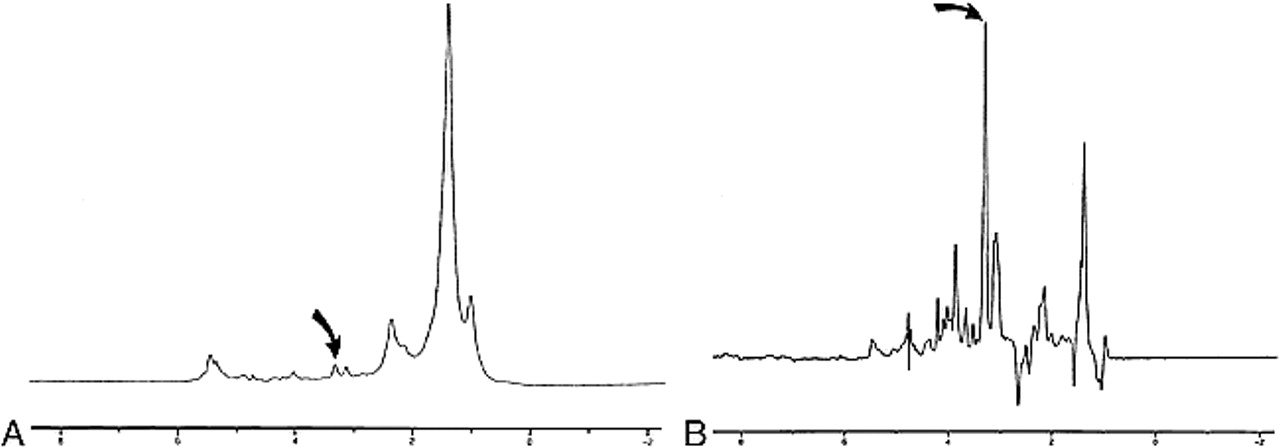
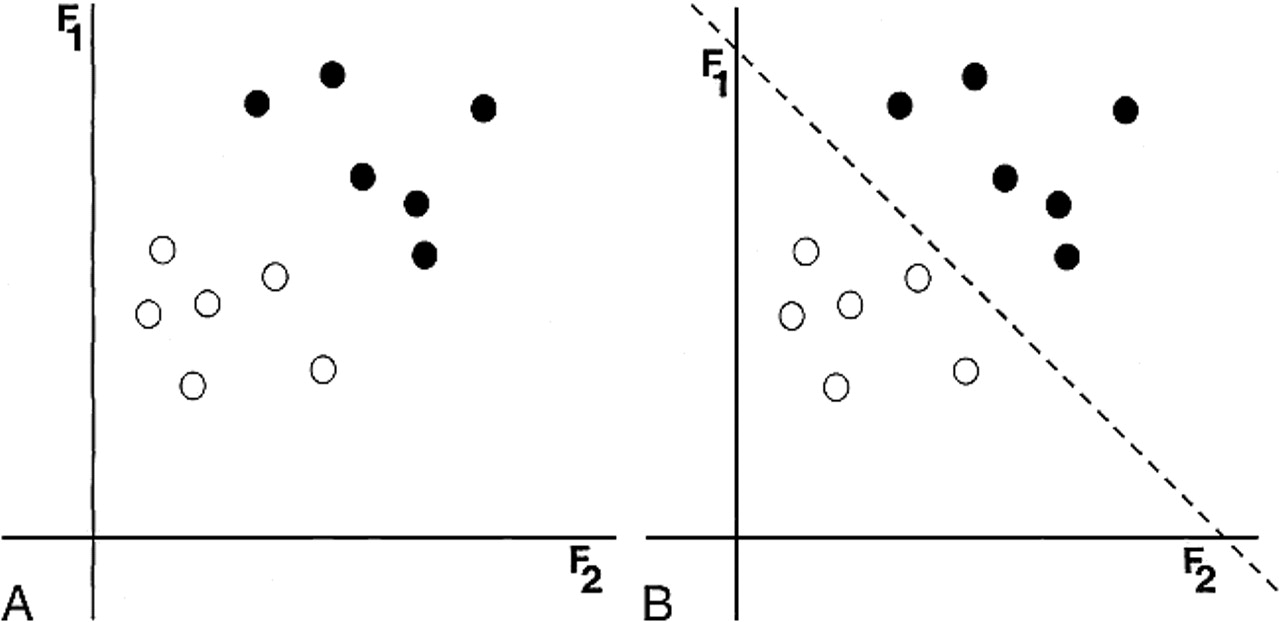
There are numerous metabolite peaks that can be identified on high-resolution in vitro proton (1H) MR spectra (Fig 1); however, most investigators who have used 1H-MRS to differentiate between different tissue types have compared relatively few peak height or peak area ratios. The classifier most commonly applied to 1H-MRS in differentiating benign from malignant tissue is linear discriminant analysis (LDA) (2, 4, 5, 8, 10). LDA, as conceived by Fisher (11), is a classifier that computes a linear boundary to separate two classes. This method commonly uses the assumption of a normal distribution to position that boundary (Fig 2).

Examples 1H-MR spectra of normal muscle (A) and SCCA (B). Peaks measured in this study were olefinic acids (5.3 ppm), inositol (3.5 ppm), taurine (3.4ppm), Cho (3.2 ppm), Cr (3.0 ppm), sialic acid (2.2 ppm), and methyl (0.9 ppm). The height of the methylene (1.3 ppm) peak was used as an internal standard. (curved arrow indicates Cho resonance) nodes. Through training, a collection of nodes can adjust their interconnections so as to make complex decisions in consideration of a large number of inputs. This capability makes this ideally suited for the analysis of spectral resonanaces.

A 2D example of LDA. A, Two features (F1 and F2 axes) describe two classes (black and white dots). B, Using the assumption of a normal distribution for each of the classes. LDA computes a linear boundary (dotted line) in the 2D space to separate the two classes completely
Originally conceived in the late 1950s, neural networks (NN) were initially viewed as a way to model the workings of the human central nervous system (12). As with the human central nervous system, NNs are collections of simple processing elements called “nodes.” Each node is capable only of the most basic decision making (eg, yes/no), but when interconnected, they are capable of complex decisions in consideration of a large number of inputs. In these experiments, we evaluated one type of NN classifier called the multilayered perceptron in which the nodes are arranged in layers (Fig 3). The input layer merely passes the input data to the second, “hidden” layer. Each node in the hidden layer sees every input value, independently weights the importance of each input, and thereby produces a single vote that is passed to every node in the output layer. Each node in the output layer independently weights the votes of the hidden layer nodes and then casts its own vote. The strength of NNs comes from their ability to be trained iteratively. During training, input/output pairs are repeatedly presented to the network and used to adjust how the output layer weights the hidden nodes' votes and how the hidden nodes weight the input values (training actually occurs in this output-to-input reverse flow and is therefore termed “backpropagation”). Because of their complex decision-making capabilities and their ability to be trained, NNs have been applied in fields ranging from handwriting (13) and human face recognition (14) to prediction of patient outcomes in colorectal carcinoma (15), and recently, MRS (3, 16).

Schematic of a node, the fundamental unit of an NN. A node weights its input to make a simple yes/no decision. An NN is trained by adjusting the weights used by its nodes. Through training, a collection of nodes can adjust their interconnections so as to make complex decisions in consideration of a large number of inputs. This capability makes this ideally suited for the analysis of spectral resonanaces
The purpose of this investigation was to determine if neural network analysis of multiple peak heights could improve, compared with LDA, the ability of 1H-MRS to distinguish normal muscle from SCCA in vitro. We believe that the use of peak heights at multiple resonances provides additional information that can improve the diagnostic accuracy of 1H-MRS and potentially create a tumor profile for SCCA.
Methods
Tissue Samples
This study was an in vitro prospective analysis of one-dimensional 1H-MRS of muscle and SCCA of the extracranial head and neck performed under controlled conditions. SCCA samples (n = 16) were obtained from patients undergoing excisional biopsy of clinically suspicious masses. Normal samples (n = 12) were obtained from incidentally excised normal muscle, typically laryngeal strap muscles. Faculty pathologists at our institution made the histologic diagnosis of SCCA or normal muscle, and this was considered the standard by which our classifiers were judged. The institutional review board at our institution approved this tissue procurement protocol.
Specimens were placed in plastic vials and frozen in liquid nitrogen; they were then stored in a −80° C freezer until 1H-MRS analysis was performed. Before performing 1H-MRS, samples were thawed to room temperature, minced, and washed with D2O phosphate buffered saline (3 ×) to remove as much residual water as possible. The samples were then placed on D2O-saturated glass wool plugs in 5-mm nuclear MR tubes. Mincing improved the uniformity of the sample and the homogeneity of the magnetic field across the sample. During spectral acquisition, we maintained the temperature of the sample at 37° C.
1HMRS Technique
One-dimensional 1H-MR spectra were obtained with a Carr-Purcell-Meiboon-Gill sequence with data acquired at 2000/136 (TR/TE) over a width of 7042.25 Hz (14.0806 ppm) using 8192 data points, 128 averages, and an acquisition time of 0.582 seconds. The TE of 136 msec was chosen because this is the TE most commonly used for localized clinical MRS at our institution. An exponential line broadening of 5.00 Hz was applied to a one-dimensional time domain data prior to Fourier transformation. The spectra obtained were phase corrected (zero-order phase correction) to obtain the final spectra for analysis.
Spectral Measurements
Peak height measurements were obtained for methyl (0.9 ppm), sialic acid (2.2 ppm), creatine (Cr) (3.0 ppm), choline (Cho) (3.2 ppm), taurine (3.4 ppm), inositol (3.5 ppm), and olefinic acid (5.3 ppm) for both tumor and muscle. The baseline of each spectrum was determined by visual inspection after phase correction. Because no external standard was available, the heights of all the peaks for a sample were scaled to the height of that sample's methylene peak and then peak heights underwent log transformation. Log transformation made the assumption of normal distributions more appropriate (4). The NN and the LDA classifications that we used operated directly on this scaled data: ie, no additional input scaling was performed.
Peak areas under the Cho and Cr resonances were estimated as the product of the peak height (PH) and the feature width at half-maximum height (FWHM), as described by Mukherji et al (4). The ratio of Cho to Cr peak areas can then be expressed as: R = (PHCho × FWHMCho)/(PHCr × FWHMCr). These calculations were performed for the one-dimensional 1H-MRS spectra of tumor and normal tissue samples. All measurements were made by a single observer who was aware of the origin of the spectra.
Peak areas could not be computed on the other metabolite resonances because of the relatively low levels of these metabolites within the tissue samples and the close proximity of many of these peaks to adjacent resonances. These factors prevented an accurate measurement of the FWHM.
Statistical Classifiers
Linear Discriminant Analysis
LDA with Fisher's linear discriminant (11) was applied to distinguish SCCA from muscle by using the combination of the peak heights from the 1H-MRS. Using the assumption of a normal distribution for SCCA and muscle, we computed decision boundaries to separate SCCA from muscle.
LDA was tested using leave-one-out (LOO) analysis (17). This testing method selects one sample (SCCA or normal muscle) as the test sample. The remaining samples are used as the training set. After the first analysis, the “training” is repeated with a different sample (SCCA or normal muscle) left out. This process is repeated until all samples have been left out once. The total number of correct and incorrect responses provides an unbiased estimate of the classifier's performance.
Because the 1H-MRS-derived Cho/Cr peak area ratio produces a single value, LDA reduces to choosing a single threshold; any value above that threshold is interpreted as positive. The method used to select that threshold and to measure sensitivity and specificity given that threshold is discussed in Mukherji et al's previously cited article (4).
Neural Networks
NNs were used to determine the ability of peak heights derived from 1H-MRS to distinguish between SCCA and muscle. NNs come in several varieties. We chose the multilayer perceptron; it is easy to implement and generally performs well as a classifier. The types of layers were: 1) an input layer, 2) an output layer, and 3) one or more intermediate (or “hidden”) layers. The size of the hidden layer determines the behavior of the network as a classifier (Fig 4).

A 2D example shows the effect of the configuration of the NN on the boundary. Two features (F1 and F2 axes) describe two classes (black and white dots) (A). In this example, the boundary is not linear. Boundaries (dotted lines) and schematics of NNs that would create them are shown for networks with one (B), two (C), and three (D) hidden nodes.
Our network had three layers: an input layer containing seven nodes (the number of metabolite peaks), an output layer with two nodes (tumor and nontumor), and one hidden layer (Fig 5). The number of nodes in the hidden layer was varied to attain the best performance.

A schematic of a two-hidden-node NN used for the analysis of multiple peak height data. Seven peak heights for a sample serve as input to the nodes of the input layer. The computations propagate through the network, and the classification as tumor or nontumor is read from the nodes of the output layer.fig 6. ROC curves, computed using the binormal method, for each classifier tested (NN-2=two-node NN, NN-1=one-node NN, LDA-Cho/Cr=LDA for Cho/Cr area ratio, LDA-Heights=LDA for Cho/Cr peak height ratio). TPR=true-positive rate (sensitivity); FPR=false-positive rate (1-specificity). ROC analysis demonstrates that NN analysis outperfoms linear discriminant analysis for measuring the diagnostic accuracy of 1H-MR in attempting to differentiate SCCA from muscle
NN analysis was performed using short stopping and LOO analysis. Short stopping reserves one fifth of the training data as an intermediate “test set” to prevent overfitting the training data. Training the network was done using the resilient backpropogation algorithm (18) (See Appendix).
For each of the classifiers listed above (Cho/Cr, peak height LDA, and NN classifiers), we computed receiver operating characteristic (ROC) curves. These were computed using the binormal method (19). For NNs and LDA, equal weighting of false-positive and false-negative errors was affected by using approximately equal numbers of samples from each class for training.
Results
The number of nodes in the hidden layer reported in our series was one (“one-hidden-node”) and two (“two-hidden-node”). We also evaluated NN paradigms that had more nodes within the hidden layer (three, four, eight, and 10); however, there was no improvement in the sensitivity or specificity through the use of these more complex architectures. Further increases in the number of hidden nodes increased training time without increasing accuracy.
The sensitivities and specificities of LDA, NNs, and Cho/Cr area ratios used to distinguish tumor from muscle are summarized in the Table. ROC curves for each of the classifiers are shown in Figure 6. These results demonstrate that NN analysis of the seven metabolite peak heights improved the ability of 1H-MRS to differentiate SCCA from muscle compared with LDA of Cho/Cr area ratios and LDA of the seven metabolic peak heights.
Discussion
NNs are especially adept at nonlinear pattern recognition (3), and the analysis of multiple spectral resonances for tissue characterization is a form of multivariate problem solving that is well suited for NN. Although LDA is a useful classifier, it is a parametric classifier and is able only to compute linear boundaries (Fig 2). The simultaneous analysis of multiple peaks produces a nonlinear multivariate problem that can be analyzed better by a classifier that is capable of making decisions based on iteratively computed, nonlinear boundaries (Fig 4). The findings of our investigation demonstrate that the diagnostic accuracy of 1H-MRS in distinguishing SCCA from muscle is improved by the use of NN compared with standard LDA.
We postulated that the heights of multiple metabolite resonances would provide further information about a sample's identity. The choice of the resonances evaluated in our investigation was based on prior studies that had suggested that certain metabolite levels could differentiate benign from malignant tissue (4, 20, 21).
In our investigation, NN analysis was performed on peak height measurements. Peak area is known to correspond to the quantity of metabolites present in a sample (22); however, both peak height and peak area ratios have been used to evaluate spectral differences between tumors and normal tissue (4, 20, 21, 23–26). We believe this was a valid methodology, as there was negligible spectral broadening because our study was an in vitro investigation performed at 11 T (Fig 1).
Other authors have investigated the role of NNs in the analysis of 1H-MRS (3, 7, 16). Somorjai et al included NNs in a suite of computerized diagnosis algorithms applied to diagnosis of thyroid neoplasms in vivo. Their methods had an overall sensitivity of 100% and a specificity of 98% (7). Usenius et al used NNs to predict characteristics of brain tumors in vivo, and attained a diagnostic accuracy of 82% (16).
The results of our initial investigation demonstrate that NNs were superior to LDA for tumor discrimination. Although the difference was not statistically significant, these results demonstrate a definite trend that is consistent with other investigators. (3, 16) Previous studies have shown that NNs can improve the diagnostic accuracy of 1H-MRS by permitting analysis of multiple metabolic resonances, which standard LDA lacks (3, 16). The lack of statistical significance was likely due to sample size. This study was part of a prospective investigation approved by the institutional review board at our university. This study has been completed and further samples cannot be obtained. A larger number of samples would likely confirm the ability of NNs to improve the ability of 1H-MRS to characterize tissue compared to LDA significantly. Additionally, improvements in diagnostic accuracy would arise from further training NNs, and this training is accomplished by providing the NN with more known tissue samples. We feel that confirmation of these findings is warranted by future investigations.
Our results suggest NNs may have a broader role in future 1H-MRS investigations performed for in vivo tissue characterization. Current in vivo investigations have been limited to metabolites detectable on 1.5-T clinical units. The majority of these studies have evaluated the relative levels of Cho, Cr, lactate, N-acetylaspartate, myo-inositol, glutamate, and glutamine. It is possible that a technique that allows simultaneous analysis of multiple peaks will enhance the diagnostic capabilities of 1H-MRS.
The emergence of higher-field clinical 1H-MRS units (3-T) permit identification of metabolites that were not previously detectable on images produced by 1.5-T units. The additional spectral information combined with the advanced capabilities of NNs has potential for substantially enhancing the tissue characterization properties of 1H-MRS.
In summary, our results demonstrate that the use of NNs increases the tissue characterization ability of 1H-MRS in the extracranial head and neck. We hope our results from our controlled in vitro investigations will help expand the role of these important classifiers in future investigations.
Appendix
The NN's operation is divided into testing and training phases. During a training phase, the training data are repeatedly presented as input to the network. The network's classification of a sample as tumor or nontumor is compared with the sample's known identity, the difference is the classification error, and the connection weights are updated based on this error. During a testing phase, the test samples are presented at the input layer; the classification error is calculated, but the connection weights are not changed.
The exact method to update the connection weights during training is the subject of much research. Many different methods have been proposed, and all of them involve small changes in the internodal connections to decrease the overall error seen at the output layer. The original method, known as backpropagation (27), remains one of the most efficient methods despite challenges from multiple algorithms. Recently, however, an algorithm known as “rprop” (for resilient backpropagation) has been shown to be more efficient than backpropagation (18). For this reason, we chose to use the rprop algorithm for updating the connection weights.
A major concern when training an NN is “overfitting” the training data. The network is, in effect, memorizing the training samples so that the error associated with the training set approaches zero. This occurs at the expense of generalizability, and the network begins losing its ability to classify samples not in the training set. This problem is particularly important given few samples and multiple inputs. This problem, however, is addressed through the technique of short stopping. Short stopping begins with reserving a fraction of the training data as an “intrinsic test” set. These samples are not included in the training of the network; ie, they are not used to modify connection weights. Instead, they are used to test the network repeatedly, and training is stopped when the error associated with this set begins to rise.
Acknowledgments
We gratefully acknowledge Dr. Keith E. Muller in the Department of Biostatistics at the University of North Carolina for his contributions to the design of this study.
Footnotes
↵1 Address reprint requests to Suresh K. Mukherji, MD, Department of Radiology, 3324 Old Infirmary CB# 7510, University of North Carolina School of Medicine, Chapel Hill, North Carolina 27599-7510.
References
- Received January 13, 1999.
- Accepted after revision January 7, 2000.
Sensitivity and specificity of the various statistical classifiers for differentiating head and neck squamous cell carcinoma from muscle
- Copyright © American Society of Neuroradiology
In this issue


Jump to section
Related Articles
Cited By...
- No citing articles found.