
Abstract
BACKGROUND AND PURPOSE: Conventional imaging techniques cannot be used to unambiguously and reliably differentiate malignant from benign vertebral compression fractures. Our hypothesis is that these malignant and benign vertebral lesions can be better distinguished on the basis of tissue apparent diffusion coefficients (ADCs). The purpose of this study was to test this hypothesis by using a quantitative diffusion imaging technique.
METHODS: Twenty-seven patients with known cancer and suspected metastatic vertebral lesions underwent 1.5-T conventional T1-weighted, T2-weighted, and contrast-enhanced T1-weighted imaging to identify the lesions. Diffusion-weighted images of the areas of interest were acquired by using a fast spin-echo diffusion pulse sequence with b values of 0–250 s/mm2. The abnormal regions on the diffusion-weighted images were outlined by using the conventional images as guides, and the ADC values were calculated. On the basis of pathologic results and clinical findings, the cases were divided into two categories: benign compression fractures and metastatic lesions. The ADC values for each category were combined and plotted as histograms; this procedure was followed by statistical analysis.
RESULTS: The patient group had 12 benign fractures and 15 metastases. The mean ADC values, as obtained from the histograms, were (1.9 ± 0.3) × 10−4 mm2/s and (3.2 ± 0.5) × 10−4 mm2/s for metastases and benign fractures, respectively.
CONCLUSION: Our results indicate that quantitative ADC mapping, instead of qualitative diffusion-weighted imaging, can provide valuable information in differentiating benign vertebral fractures from metastatic lesions.
Vertebral compression deformity is frequently observed in elderly patients (1). The cause of this abnormality can be either benign or malignant. Benign vertebral lesions occur in approximately one third of cancer patients (2), and metastatic vertebral lesions account for 39% of bony metastases in patients with primary neoplasms (3, 4). Conventional MR techniques cannot always be used to differentiate benign from malignant lesions because of their similar appearances (5). For example, osteopenic compression fracture can be confused with metastatic compression in the acute phase. Edema in a benign compression fracture in the acute phase replaces the normal marrow, resulting in hypointensity on T1-weighted images and hyperintensity on T2-weighted images. The vertebral body with benign fracture may have enhancement after the IV administration of contrast material. These MR signal intensity characteristics are similar to those of metastases and cause ambiguity, especially when only a single lesion is present.
Our hypothesis was that malignant and benign vertebral lesions can be better distinguished on the basis of tissue apparent diffusion coefficients (ADCs). In this study, we developed a quantitative diffusion imaging technique to test this hypothesis.
Methods
Twenty-seven patients with primary tumors and suspected metastatic vertebral lesions were enrolled in this study. The group consisted of 12 male and 15 female patients, with a mean age of 65 years (age range, 39–79 years).
All patients underwent imaging performed with 1.5-T MR imagers. The imaging protocol consisted of an unenhanced sagittal T1-weighted sequence, a T2-weighted fast spin-echo sequence with fat suppression, a sagittal diffusion-weighted sequence, and a contrast-enhanced sagittal and axial T1-weighted sequence with fat suppression. The TR/TE values used in T1- and T2-weighted imaging were approximately 450/10 and 4000/102, respectively. Other key imaging parameters used in the T1- and T2-weighted sequences were as follows: section thickness, 4–6 mm; intersection spacing, 1 or 2 mm; field of view (FOV), 28–36 cm for sagittal images and 18 cm for axial images; and matrix size, 512 × 512 (sagittal) and 256 × 256 (axial).
Because of the large magnetic susceptibility variations in the spine, the commercial echo-planar imaging pulse sequence does not produce good diffusion-weighted images. We thus developed and implemented a diffusion-weighted fast spin-echo pulse sequence based on a previously reported concept (6, 7). Single-shot acquisition was used to address the issue of motion sensitivity, and multiple signal acquisitions were used, with proper phase correction, to increase the signal-to-noise ratio (7). With this pulse sequence, approximately four to six sagittal diffusion-weighted images were acquired in each patient with the following parameters: 5000/96.4; bandwidth, 125 kHz; FOV, 28–36 cm; matrix size, 128 × 128; echo train length, 80; section thickness, 5–7.5 mm; intersection spacing, 1–4 mm; number of signal averages, eight; and b values, 0, 150, and 250 s/mm2. (The use of higher b values was attempted; however, they did not produce images with an adequate signal-to-noise ratio for ADC calculation.) At each section location, the diffusion-weighting gradient was applied along the section selection, readout, and phase-encoding directions, with a fixed gradient amplitude (ie, fixed b value) to minimize the effects of diffusion anisotropy. (The effects of diffusion anisotropy were observed on the individual diffusion-weighted images.) The resultant diffusion-weighted image was computed on a pixel-by-pixel basis according to the following equation (8):  where I̅ is the resultant diffusion-weighted image (ie, the diffusion trace–weighted image) and Ix, Iy, and Iz are the original diffusion-weighted images with the diffusion-weighting gradient along the readout, phase-encoding, and section-selection directions, respectively. To quantitatively obtain the ADC, an additional non-diffusion-weighted image I0 was also acquired by disabling the diffusion-weighting gradient while keeping the same TE.
Because the minimum TE of the pulse sequence was 96.4 ms, the diffusion-weighted images also contained substantial T2 contrast, especially when a relatively small b value (≤250 s/mm2) was used because of the signal-to-noise ratio limitation. To eliminate the T2 effect from the diffusion-weighted images, quantitative ADC values Da were calculated from I0 and I̅ by using the following equation: 
The ADC calculation was performed within a region of interest that contained the vertebral lesion. Selection of regions of interest was guided by using conventional T1-weighted, T2-weighted, and contrast-enhanced T1-weighted images by matching the coordinates of the lesions. The ADC values within the regions of interest were then plotted as histograms, and a statistical analysis was conducted to yield the mean ADC value and the SD. Pathology results (five patients) and follow-up MR examinations (all patients) were used to determine whether a lesion was benign or malignant.
Results
Benign Compression Fractures
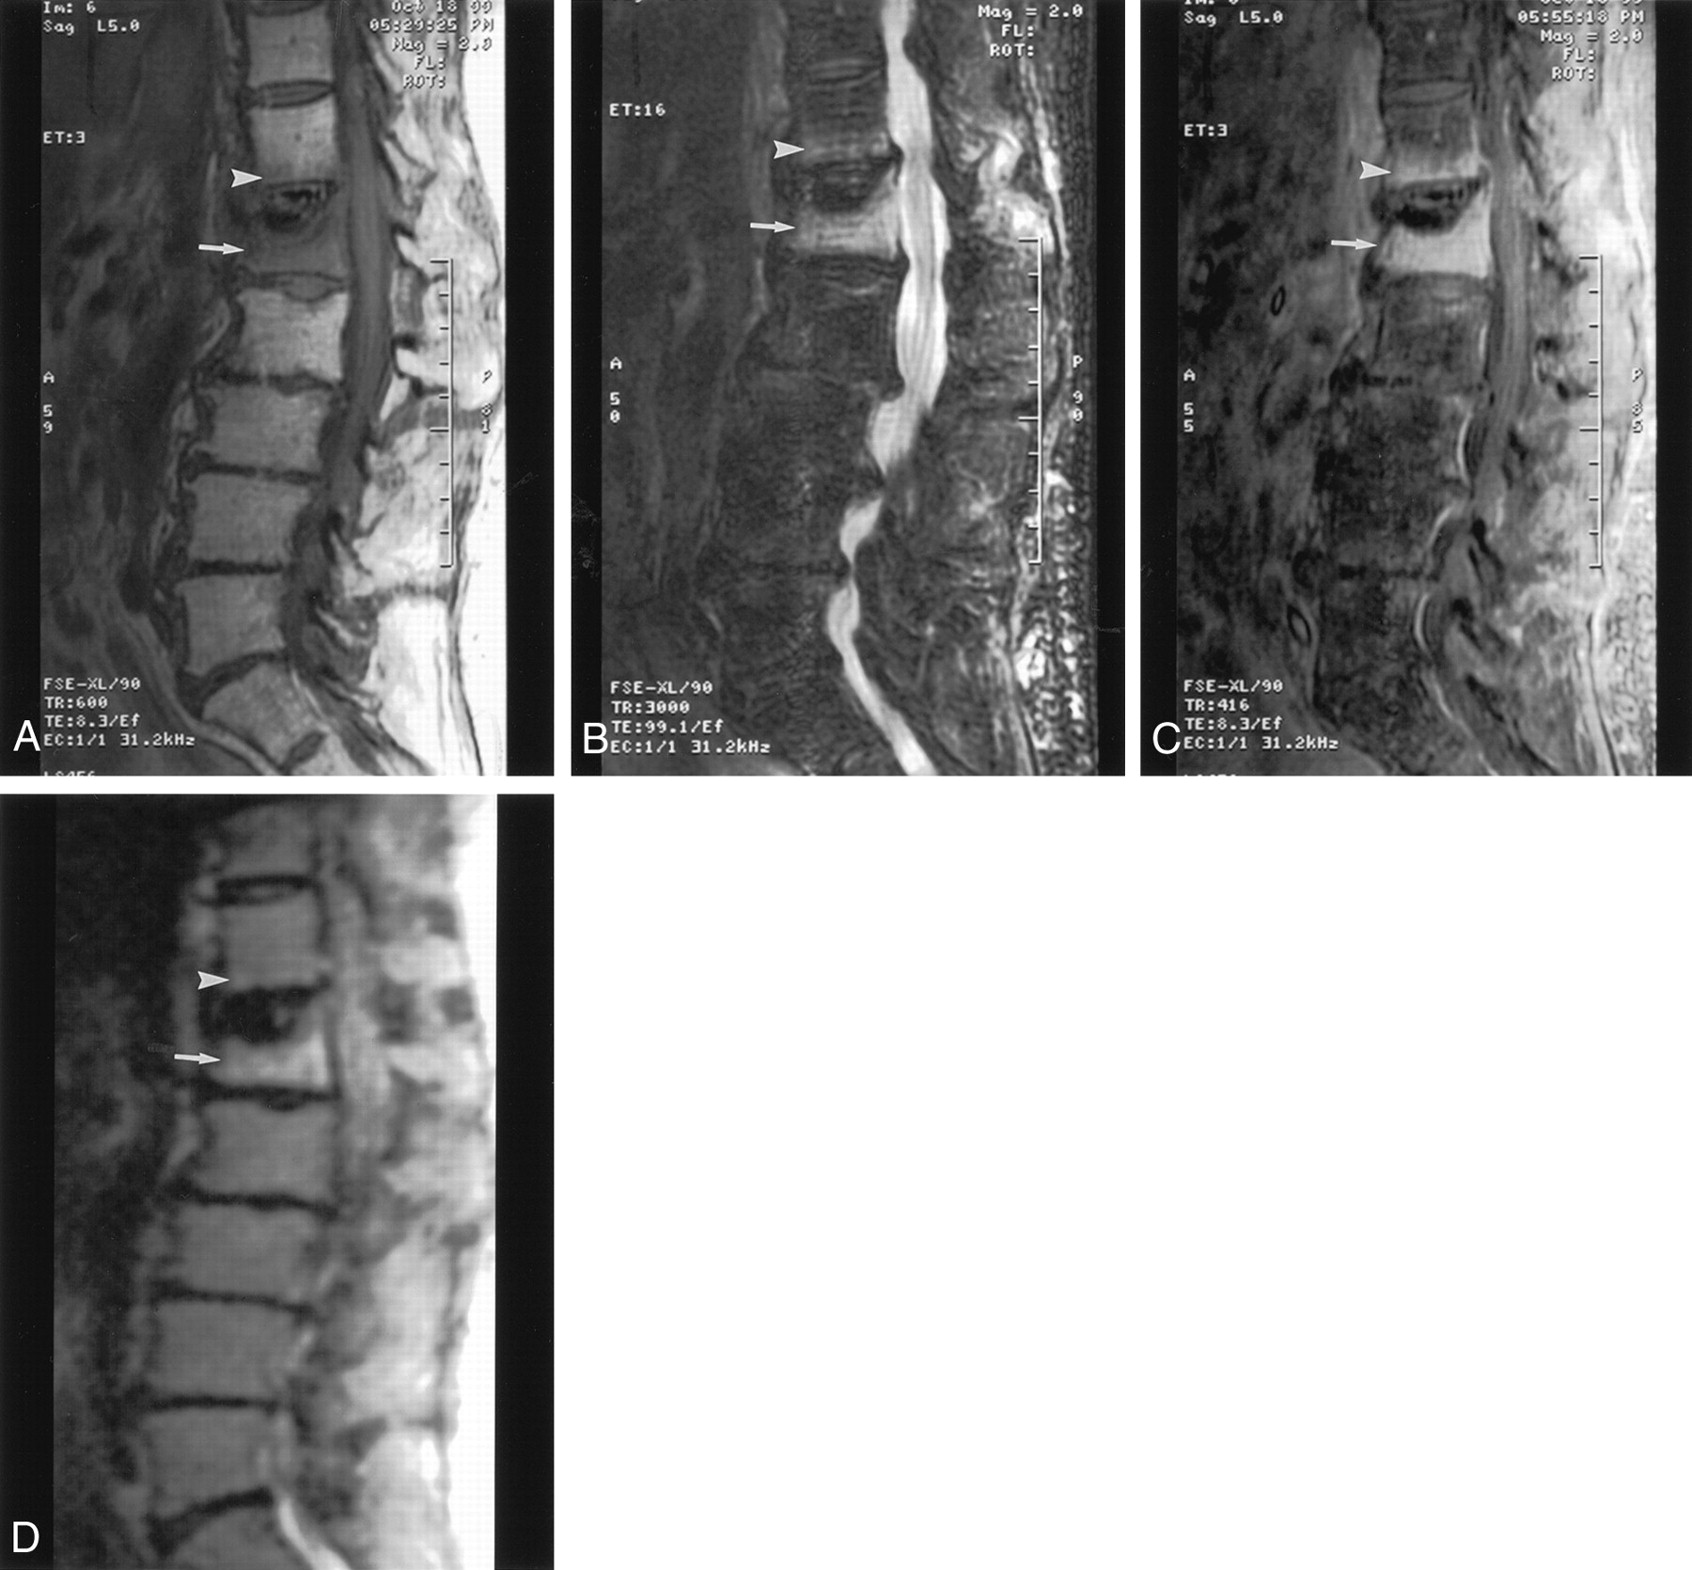
Twelve patients had benign compression fractures. Eleven of the 12 had lesions that were diffusely hypointense on T1-weighted images (Fig 1A) and hyperintense on fast spin-echo T2-weighted fat-suppressed images (Fig 1B). For eight of the patients, contrast enhancement occurred on the T1-weighted fat-suppressed images with fat suppression (Fig 1C); three patients did not receive contrast material. The 12th patient in this group had vertebral plana, the signal intensity of which was heterogeneous on the T1-weighted images, fast spin-echo T2-weighted fat-suppressed images, and contrast-enhanced T1-weighted fat-suppressed images.

Acute osteopenic compression fracture of the L1 vertebral body simulating metastasis. The mean ADC value of the lesion is 2.8 × 10⁻⁴ mm2/s.
A, Sagittal T1-weighted MR image (600/8; section thickness, 5 mm; intersection spacing, 1 mm; FOV, 32 cm; matrix, 512 × 512) shows the lesion as diffusely hypointense (arrow). Typical appearance of benign compression fracture involves the T12 vertebral body, with a bandlike area of abnormal signal intensity (arrowhead).
B, Sagittal T2-weighted fat-suppressed MR image (3000/99; section thickness, 5 mm; intersection spacing, 1 mm; FOV, 32 cm) shows the lesion as hyperintense (arrow). Typical appearance of benign compression fracture involves the T12 vertebral body, with a bandlike area of abnormal signal intensity (arrowhead).
C, Sagittal contrast-enhanced T1-weighted fat-suppressed MR image (416/8.3; section thickness, 5 mm; intersection spacing, 1 mm; FOV, 32 cm) shows the lesion as enhanced (arrow). Typical appearance of benign compression fracture involves the T12 vertebral body, with horizontal bandlike enhancement paralleling the endplate (arrowhead).
D, Sagittal diffusion-weighted MR image (5000/96.4; bandwidth, 125 kHz; FOV, 32 cm; matrix, 128 × 128; section thickness, 5 mm; intersection spacing, 1 mm) shows the lesion as hyperintense (arrow). Benign compression fracture is mildly hyperintense (arrowhead).
On the qualitative diffusion-weighted images, the signal of the lesion was hypointense in one patient, isointense in five patients, and hyperintense in the other six patients (Fig 1D). The patient with the vertebral plana was included in the isointense group. Thus, the benign lesions had variable signal intensity characteristics. In the quantitative diffusion study, the mean ADC values of the affected vertebral bodies varied from 2.4 × 10⁻⁴ mm2/s to 3.5 × 10⁻⁴ mm2/s. These values are slightly lower than the corresponding ADC values (3.0–3.7 × 10⁻⁴ mm2/s) calculated in the normal vertebral bodies in the same patients.
Metastatic Vertebral Lesions
Fifteen patients had metastatic lesions. Hypointensity was shown on the T1-weighted images in all patients (Fig 2A). In 13 patients, hyperintensity was shown on the fast spin-echo T2-weighted fat-suppressed images, whereas hypointensity was shown on the images in the remaining two patients (Fig 2B). Ten patients in this group received contrast material, and in all 10 patients, enhancement was seen on the contrast-enhanced T1-weighted fat-suppressed images (Fig 2C).

Typical MR images of the L2 vertebral body metastasis with pathologic fractures reveal a sharply defined lytic lesion. The lesion has a mean ADC value of 1.7 × 10⁻⁴ mm2/s.
A, Sagittal T1-weighted image (650/12; section thickness, 4 mm; intersection spacing, 1 mm; FOV, 32 cm; matrix, 512 × 512) shows low signal intensity (arrow).
B, Sagittal T2-weighted fat-suppressed image (3000/99; section thickness, 4 mm; intersection spacing, 1–2 mm; FOV, 28–36 cm) shows heterogeneous abnormal signal intensity (arrow).
C, Sagittal contrast-enhanced T1-weighted fat-suppressed image (416/12; section thickness, 4–6 mm; intersection spacing, 1 mm; FOV, 32 cm) shows enhancement (arrow).
D, Sagittal diffusion-weighted image (5000/96.4; bandwidth, 125 kHz; FOV, 36 cm; matrix, 128 × 128; section thickness, 7.5 mm; intersection spacing, 1 mm) shows the lesion as bright area (arrow).
On the diffusion-weighted images, the lesions were shown as hyperintense in nine patients (Fig 2D), hypointense for four, isointense for one, and heterogeneous for one. Although the signal intensity characteristics varied drastically among the diffusion-weighted images, the quantitative ADC values of the metastatic lesions were all 1.3–2.0 × 10⁻⁴ mm2/s. The patient who had metastatic adenocarcinoma had a relatively high ADC value (1.8 × 10⁻⁴ mm2/s). However, this value was still noticeably lower than the ADC values for the benign compression fractures. All metastatic lesions had lower ADC values than those of adjacent normal vertebral bodies, as measured in the same patients (ADC ≈ 2.7–3.3 × 10⁻⁴ mm2/s).
Statistical Analysis
A composite histogram was produced for all the patients in each disease group (Fig 3). The ADC histogram for the benign compression fractures of all 12 patients revealed a mean ADC value of 3.2 × 10⁻⁴ mm2/s with an SD of 0.5 × 10⁻⁴ mm2/s. The ADC histogram for the metastatic lesions of the 15 patients showed that the mean ADC value and its SD were 1.9 × 10⁻⁴ and 0.3 × 10⁻⁴ mm2/s, respectively. Although the signal intensity characteristics overlapped substantially on both the conventional and diffusion-weighted images, the two distinct disease groups were better separated on the basis of ADC values. The signal intensity characteristics of the conventional images, diffusion-weighted images, and ADC values are summarized in the Table.

Histograms of ADC values for benign fractures (circles) and metastases (diamonds) in the vertebral bodies.
Summary of the imaging characteristics of vertebral lesions
Discussion
Yuh et al (9) previously suggested a method to differentiate between benign and malignant vertebral lesions by detecting the presence or absence of marrow replacement on the basis of the relative signal intensity changes in T1-weighted, T2-weighted, and contrast-enhanced T1-weighted images with and without fat suppression. Despite success with the method in certain cases, benign compression fractures and malignant lesions still show a considerable overlap on the basis of the proposed criteria. Recently, several attempts have been made to improve differentiation between malignant and benign vertebral compressions by using diffusion-weighted imaging. Baur et al (10) reported that benign compression fractures are hypo- to isointense relative to adjacent normal vertebral bodies, whereas pathologic compression fractures are hyperintense relative to normal vertebral bodies on diffusion-weighted MR images obtained with a b value of 165 s/mm2. However, Castillo et al (11) recently reported that diffusion-weighted imaging offers no advantage over conventional unenhanced MR imaging for the detection of vertebral metastases.
The results in the Table show that benign compression fractures cannot be unambiguously distinguished from metastatic lesions on the basis of conventional T1-weighted, T2-weighted, and contrast-enhanced T1-weighted imaging characteristics. Both benign and malignant lesions can be hypointense on T1-weighted images, hyperintense on T2-weighted images, and enhancing on contrast-enhanced T1-weighted images. Diffusion-weighted imaging did not improve the diagnosis because the image signal intensity characteristics are highly nonspecific. Hyperintense, isointense, or hypointense signal was observed for both benign compression fractures and metastases. These observations qualitatively agree with the findings reported by Castillo et al (11).
Our initial results (Fig 3, Table) suggest that quantitative diffusion imaging with ADC mapping improved the distinction between benign and malignant lesions. The mean ADC value of benign lesions was 68% higher than that of the metastases. Although the histograms for benign and malignant lesions overlapped, a two-tailed t test revealed that t was 5.57 (P < .001) between the two disease groups; this finding clearly indicated that the histograms belong to two different distributions.
It is well known that ADC is sensitive to cell volume fraction and cellularity in biologic tissues (12−15). In metastatic lesions, the cellularity can be high, especially in actively growing tumors. This results in a higher intracellular volume fraction relative to the interstitial space. Because the water diffusion coefficient is approximately 10 times lower in the intracellular space than that in the extracellular space (12), the lower ADC values in the metastases with high cellularity are readily seen, as we observed in this study. On the other hand, the cellularity in benign fractures can be lower than that of metastatic lesions because of the increased interstitial space associated with edema in the acute phase. This leads to a higher ADC value.
To improve clinical diagnosis by taking advantage of the relationship between ADC and cellularity, quantitative diffusion imaging should be used instead of diffusion-weighted imaging. In our diffusion-weighted fast spin-echo pulse sequence, the diffusion gradients that straddle the initial refocusing RF pulse substantially prolonged the minimum TE (96.4 ms), resulting in a considerable T2 weighting on the diffusion-weighted image. Therefore, the final image contrast is determined by the two competing contrast mechanisms governed by the TE and b value, respectively. When a relatively long TE is used (eg, 96.4 ms), T2 contrast can dominate the diffusion image, especially when a relatively small b value (≤250 s/mm2) is used to maintain an adequate signal-to-noise ratio. For tissues with low cellularity and a high water content, T2 weighting produces hyperintense signal, whereas diffusion weighting produces hypointense signal. With these two conflicting mechanisms, it is difficult to consistently and reliably distinguish benign fractures from metastases on diffusion-weighted images. This mixed contrast behavior was clearly observed in this study. For example, four of the metastatic lesions were hypointense on diffusion-weighted images (Table), whereas their ADC values (1.6–1.9 × 10⁻⁴ mm2/s) were lower than normal (2.7–3.0 × 10⁻⁴ mm2/s). Conversely, six of the 12 benign fractures had hyperintensity, compared with normal vertebral bodies, on diffusion-weighted images, although their ADC values (2.8–3.3 × 10⁻⁴ mm2/s) were similar to those of normal vertebral bodies (3.0–3.5 × 10⁻⁴ mm2/s).
The effect of T2 shine-through on diffusion-weighted images may also explain the discrepancy between recently published findings by Baur et al (10) and Castillo et al (11). In both studies, diffusion-weighted imaging, instead of regional ADC mapping, was used to distinguish malignant from benign vertebral fractures. Because of the varying degree of T2 shine-through, conflicting imaging characteristics can be observed on diffusion-weighted images in patients with the same disease. Our initial results indicate that quantitative ADC mapping is required to remove the effect of T2 weighting from the diffusion-weighted images to improve differentiation between benign and malignant lesions.
The accuracy of ADC values depends on many factors, such as the signal-to-noise ratio, spatial resolution, the number and amplitude of the b values used in the data acquisition, and exponential fitting algorithms. At the present time, the low signal-to-noise ratio in the diffusion-weighted fast spin-echo pulse sequence seems to be the primary source of error. This problem might be solved by using multishot diffusion-weighted fast spin-echo techniques (16, 17) with a longer acquisition time.
Conclusion
Quantitative ADC mapping, instead of qualitative diffusion-weighted imaging, is a useful tool to distinguish benign from malignant vertebral compression deformities. Signal intensity characteristics on diffusion-weighted images can be substantially influenced by the T2 shine-through effect. For improved diagnosis, this T2 effect should be eliminated from the diffusion-weighted images by using quantitative ADC mapping.
Acknowledgments
We thank Dr Christof Karmonik for assistance in developing the diffusion histogram analysis software.
Footnotes
Supported in part by funds from the Physician Referral Service at the University of Texas M. D. Anderson Cancer Center.
References
- Received December 27, 2000.
- Accepted after revision July 30, 2001.
- American Society of Neuroradiology
In this issue


Jump to section
Related Articles
Cited By...
- Review of the Imaging Features of Benign Osteoporotic and Malignant Vertebral Compression Fractures
- Predictive Models in Differentiating Vertebral Lesions Using Multiparametric MRI
- Clinical Evaluation of Reduced Field-of-View Diffusion-Weighted Imaging of the Cervical and Thoracic Spine and Spinal Cord
- MR Imaging of Orbital Inflammatory Syndrome, Orbital Cellulitis, and Orbital Lymphoid Lesions: The Role of Diffusion-Weighted Imaging
- Occurrence of malignant vertebral fractures in an emergency room setting
- Diffusion-Weighted Imaging of the Spine: Is It Reliable?