
Abstract
BACKGROUND AND PURPOSE: The magnetization transfer ratio (MTR) is a sensitive and quantitative identifier of underlying structural changes in the brain. We quantitatively evaluated age- and sex-related MTR changes in global gray matter (GM) and global white matter (WM) in healthy adults.
METHODS: Fifty-two healthy volunteers (21 men, 31 women) aged 20–86 years underwent dual-echo fast spin-echo and magnetization transfer imaging performed with and then without a saturation pulse. GM and WM were distinguished by using a computer-assisted semiautomated segmentation technique. MTR histograms were generated for each segmented tissue in each subject and compared among age and sex groups.
RESULTS: The mean, median, first quartile, and peak height of the MTR histogram were significantly lower in the older group (≥50 years) than those in the younger group (<50 years) for both GM and WM. The age dependency of these values can be expressed in a quadratic fashion over the entire span of adulthood. The MTRs started to decline only after the age of approximately 40 years in both tissues. No statistically significant differences in MTR histogram measurements between the sexes were observed.
CONCLUSION: The different MTR values for both GM and WM in the two age groups suggest that notable microscopic changes occur in GM and WM with advancing age, yet no significant sex-related variations in MTR measurements were found in these neurologically healthy adults. Such normative data based on the inherent contrast in MTRs are essential in studies of specific disorders of aging, and they may have implications for our understanding of the gross structural changes in both GM and WM in the aging brain.
MR imaging has been increasingly used to study normal brain development in children (1, 2) and age-related degeneration in adults (3–7) to expand upon postmortem findings related to the aging process of the human brain. Relative to the neuropathologic postmortem measures, MR imaging provides a noninvasive in vivo approach that avoids the issues of selection difficulty and bias, artifacts due to brain fixation, and potential influences of premorbid brain disorders or other causes of death inherent with postmortem techniques. MR imaging investigations of aging effects have typically involved the use of T2-weighted signal-intensity abnormalities (7) and morphologic measures (3–6), and investigators have observed a range of normal variation in neurologically healthy men and women. These macroscopic measures provide a window for monitoring changes in the intact brain in healthy adults, and they have been proved useful for assessing abnormal aging in neurologic illnesses (8, 9).
Although conventional MR imaging provides excellent tissue contrast, it is not sensitive enough to provide clues to the underlying microscopic mechanics of tissue changes in the aging brain. Recently, investigators have established the utility of magnetization transfer (MT) imaging in detecting subtle pathologic changes caused by various brain diseases (10–13), including neurodegenerative diseases (14). MT imaging contrast is generated on the basis of the exchange of proton magnetization between water molecules and macromolecules in tissues. More recently, the MT ratio (MTR) histogram (15, 16) has been increasingly implemented to define a normalized and quantitative measure by using two identical sequences: one with a saturation pulse and one without a saturation pulse. Although MTR values change as numerous neurologic diseases progress (10–16), few reports on the changes of normative MTR values in underlying separate brain tissues caused by normal aging have been published.
In a previous article (17), we reported on the morphologic changes that occur in global gray matter (GM) and white matter (WM) with normal aging. On the basis of most of the same adult subjects, in this study we attempted to detect the microscopic changes in GM and WM due to aging by using MTR histograms. Quantitative MT imaging may offer the clinician another information window to characterize the time course of underlying tissue changes in the adult brain.
Methods
Fifty-two of the 54 healthy adult volunteers included in the previous study (17) underwent MT imaging for this study. Two subjects (45-year-old man and 80-year-old woman) were excluded from the previous population because of unqualified MT images with motion artifacts. We therefore examined 21 men and 31 women aged 20–86 years (mean ± SD, 46.1 years ± 19.2). The distribution of subjects in each decade was as follows: 13 in the 3rd decade, 10 in the 4th decade, eight in the 5th decade, six in the 6th decade, seven in the 7th decade, five in the 8th decade, and three in the 9th decade. The enrollment criteria, age, and demographic data were previously described in part I of this study (17). In general, each subject underwent a structured clinical interview and physical examination to exclude any present or past neuropsychiatric illness or substances abuse disorders. The volunteers had no evidence of a chronic medical condition, central nervous system impairment, or psychiatric disease in first-degree relatives. All subjects provided written informed consent before their enrollment in the study. Whole-brain GM and WM were segmented on the basis of axial dual-echo fast spin-echo (FSE) images. The proton density–and T2-weighted FSE imaging parameters and the image segmenting process were also described in the previous article (17).
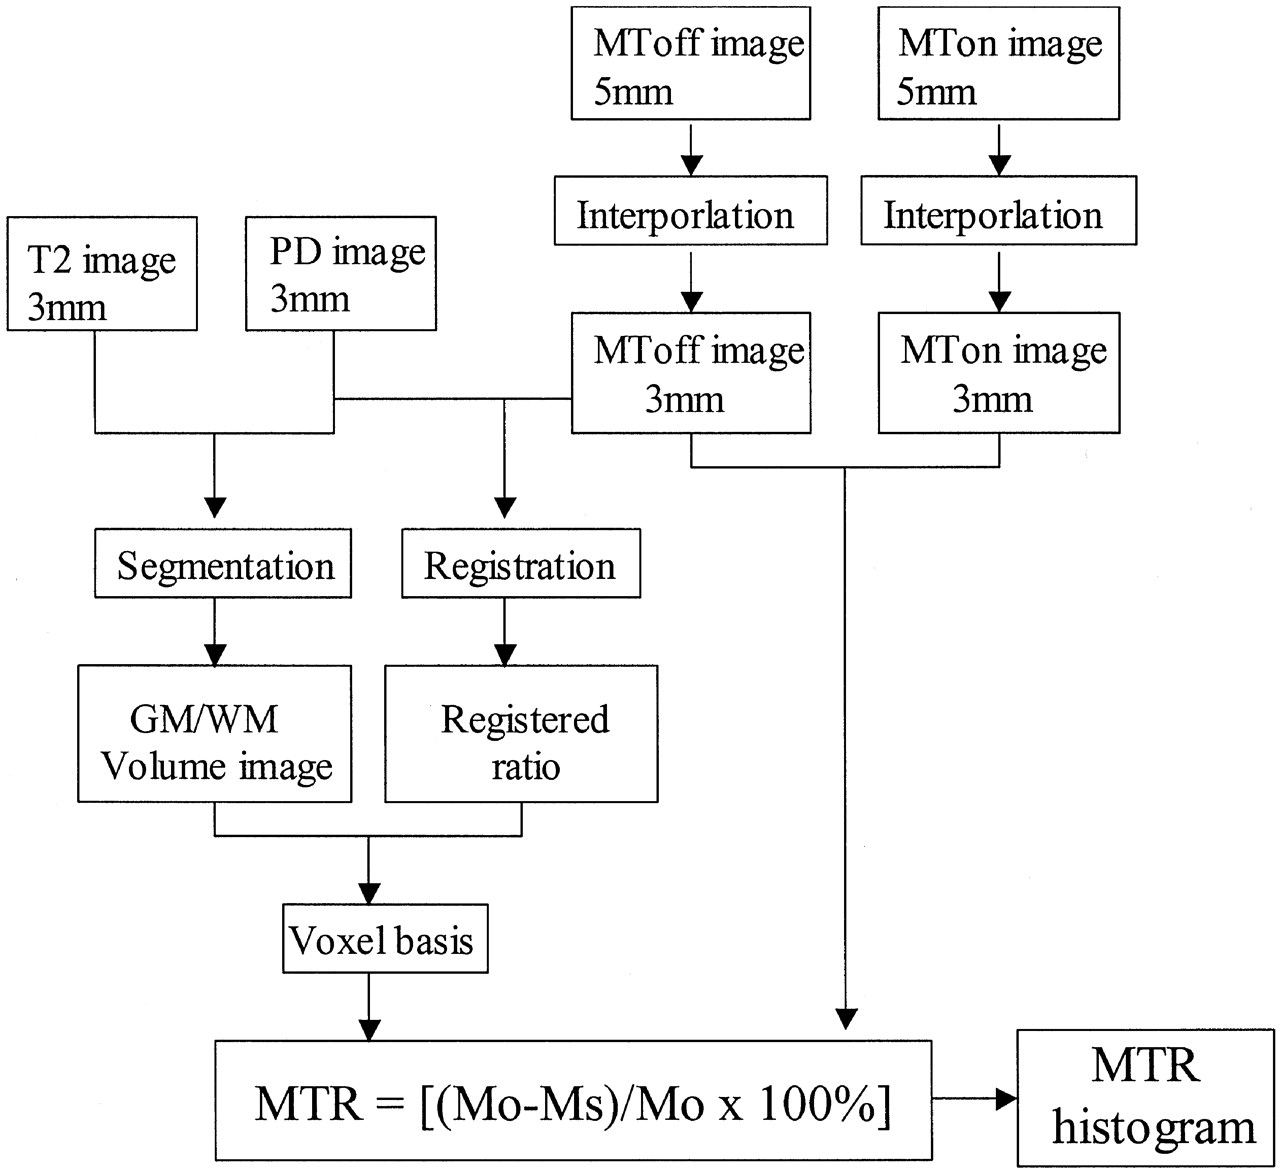
MT images were acquired by using a 3D gradient-echo sequence modified by an additional MT pulse (TR/TE, 106/5; flip angle, 12°) with a 22-cm field of view, 5-mm section thickness, and 128 × 256-mm matrix. MT contrast was achieved by the application of a 19-ms sinc-shaped radio-frequency saturation pulse during the TR period, with an equivalent flip angle of 700° applied at a frequency of 1.2 kHz below the water resonance. Two identical sets of axial images with different contrasts (one acquired with and one acquired without MT saturation pulses) were then obtained. The total acquisition time for MT imaging was 15 minutes 4 seconds (ie, 7 minutes 32 seconds for each). The computation of MTR required both volume images (segmented GM and WM) and MT images (Fig 1). Because FSE images have higher spatial resolution than that of MT images, we registered the proton density–weighted images with the MT images rather than vice versa. Once registered, the MTR was calculated in each voxel in the GM and WM by using the following expression: MTR = (Mo–Ms)/Mo × 100%, where Mo and Ms represent the signal intensity of the voxel with the saturation pulse off and on, respectively (Fig 2).

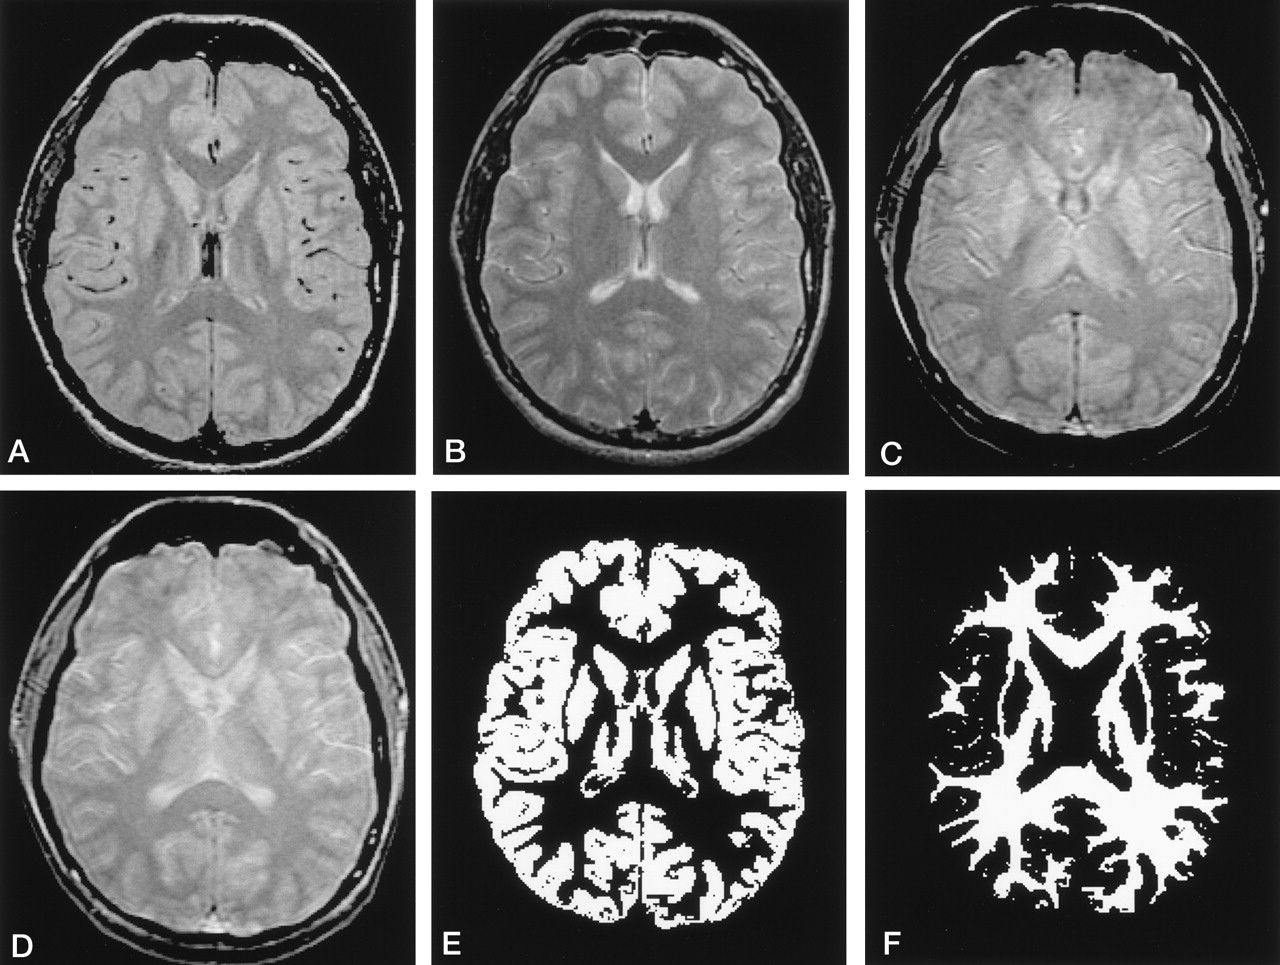
Image data sets for calculating GM and WM MTRs by using the image-processing program.
A and B, Dual-echo FSE proton density–weighted (A) and T2-weighted (B) images.
C and D, Images obtained with the MT saturation sequence off (C) and on (D).
E and F, Segmented volume image of GM (E) and WM (F) were generated from original proton density–and T2-weighted images.

Simplified image analysis schematic for the MTR histogram construction.
The MTR histograms for GM and WM were then generated, and the peak height was normalized by using the number of voxels with a certain MTR value divided by the total number of voxels in the entire tissue. Thus, the peak height of the histogram represents the largest normalized frequency in terms of one MTR value. More than 50 sections were obtained in each subject to cover the whole brain. To minimize variation in the whole-brain parenchyma volume calculations among subjects, we included only those sections from the MR image sets that started from the section just before that on which the cerebellum appeared at the bottom and ended with the last section on which brain was depicted at the top.
An independent-sample t test with a Satterthwaite correction for unequal variances was used to test differences in the MTR histogram measurements across age groups (younger than 50 years versus 60 years or older) and sexes. A Bonferroni correction was applied so that the family-wise type I error rate for the age-group or sex comparisons was less than or equal to 5%. Thus, a comparison of any one MTR histogram measurement between either age or sex was statistically significant at a family-wise significance level of 5% only if the P value of the relevant t test was less than .05/7, or .0071, where 7 is the number of histogram measures considered for GM or WM. The linear association between each MTR histogram measure and age was assessed by using Pearson product moment correlation coefficients. An association was significant only if the P value for the correlation was less than the Bonferroni corrected level of .0071. The relationship between age and each MTR histogram measure was further evaluated by using polynomial least-squares regression. The regression models under consideration were either linear or quadratic for age. The quadratic model was fit to permit an assessment of whether the rate of change in a given MTR histogram measure increases or decreases with age.
Results
Tables 1 and 2 show the mean and SD for each MTR histogram measurement and volume of each age and sex group’s GM and WM, respectively.
Comparisons of Gray Matter Magnetization Transfer Ratio and Volume Measurements in Different Age and Sex Groups
Comparisons of White Matter Magnetization Transfer Ratio and Volume Measurements in Different Age and Sex Groups
Age Effects on MTA Histogram Parameters
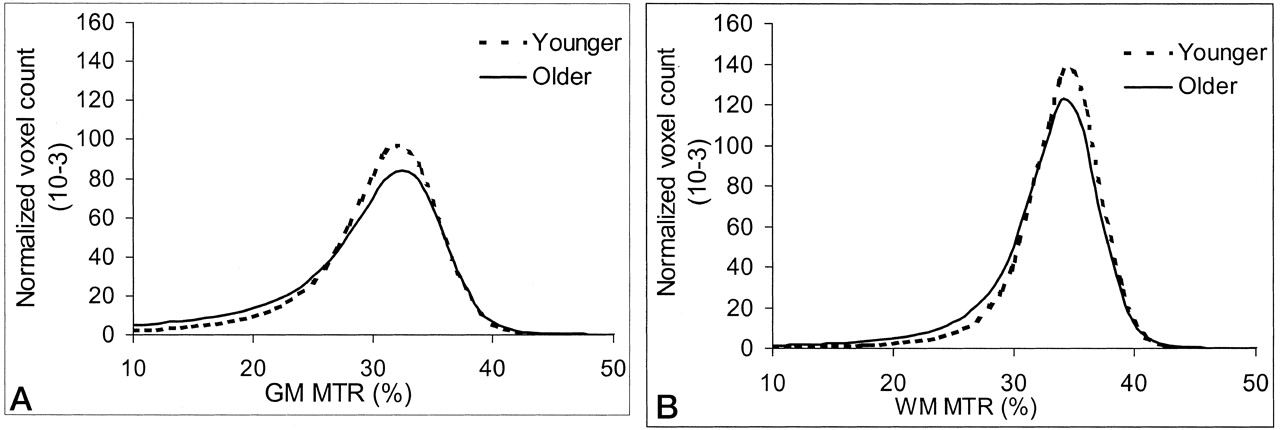
To assess age-related MTR histogram changes, we assigned the subjects to one of two age groups: 20–49 years (n = 31; mean ± SD, 32.4 years ± 8.6) and 50–86 years (n = 21; mean ± SD, 66.3 ± 10.3 years). These two age groups were significantly different with respect to the GM MTR histogram (Table 1, Fig 3A) mean (P < .0001), median (P = .006), first quartile (P < .0001), and peak height (P = .0003). The WM MTR histogram (Table 2, Fig 3B) mean (P = .0003), median (P = .0058), first quartile (P = .0002), and peak height (P = .001) were also significantly different between the two age groups. This finding indicated that age-related microscopic tissue structural changes were present in both GM and WM. Also, differences in absolute GM and WM volumes between these two groups were significantly different (P = .002).

MTR histograms in younger (< 50 years) and older (≥ 50 years) groups in healthy adults. The normalized peak height was significantly lower in the older group in both tissues. Compared with WM, GM has smaller MTR values.
A, Global GM.
B, Global WM.
The Pearson product-moment correlation was used to identify age-predictive effects on the MTR histogram measurements in GM and WM, as shown in Table 3. Regardless of sex, age was significantly and negatively associated with the MTR histogram mean, median, first quartile, and peak height in both GM and WM (P ≤ .0004). The results of the regression analyses summarized in Table 4 show the least-squares regression to predict the MTR measures, mean, median, first quartile, and peak height as a function of age and the R2 value associated with the prediction model. R2 represents the percentage of the total variance of the MTR measure that is explained by its association (either linear or quadratic) with age. The pattern of changes in the MTR histogram mean, median, and first quartile were similar for the two tissues; each demonstrated a quadratic pattern with age (Fig 4) that was statistically significant (P < .012) and negative. This finding implies that the MTR mean, median, and first quartile for both global GM and global WM exhibited a significant change toward accelerated decline over time among subjects, but only beyond a certain age (approximately age 40 years). However, the MTR histogram peak height for both GM and WM did not demonstrate a significant quadratic pattern with age (P > .21). Instead, the peak height exhibited a significant linear decline (P < .002) with no difference in the rates of change with time.

Regression analysis of MTR means in all subjects with age. Note that both GM and WM MTR means show a quadratic pattern with age during human adult life.
A, GM.
B, WM.
Pearson’s Product-Moment Correlations Between Age and Magnetization Transfer Ratio Measurements for Gray Matter and White Matter
Predictive Value of Age in MTR Measurements of GM and WM
Sex Effects on MTR Histogram Parameters
Tables 1 and 2 also show sex-related differences in MTR histogram measurements in GM and WM, respectively. No significant differences between the sexes were observed in any GM or WM MTR histogram measure at each age. Also, no significant differences were observed between sexes in terms of the rates of change in the measures as a function of their age. However, total absolute GM volumes in male subjects were significantly larger than those in female subjects (P = .004).
Discussion
MT theory is based on the interactions between protons in a free spin environment and protons in an immobile spin environment. By saturating the immobile spin population (18, 19) (ie, protons bonded to macromolecular structures such as proteins and membranes) and then decreasing and transferring the magnetization to the free spin population (ie, water pool), a unique MT image contrast is obtained. This process results in signal intensity loss due to transfer phenomenon, with a greater loss in regions where higher concentration of macromolecules (ie, myelin) occurs. Recently, this loss became quantifiable by calculating the MTR of saturated and nonsaturated images and by overlaying the MT images with segmented tissue images. Our results demonstrated significant correlations of the MTR histogram measures for both segmented GM and WM with advancing age but not with sex. These correlations included both the quadratic (mean, median, first quartile) and linear (peak height) patterns of change. They add to our prior volumetric data of global GM and WM (17) to suggest that, in addition to morphologic change, a microscopic alteration occurs in the neurologically healthy adult brain with advancing age. These results also build on information from a previous MT study of brain development (20) by measuring the MTR in the adult brain. Moreover, the technological advancements in computer-assisted techniques have permitted achievable tissue segmentation, thereby greatly improving the utility of the MTR histogram of underlying tissues in the brain in clinical settings.
Past studies have revealed that brain undergoes many structural and biochemical WM changes early in life. Engelbrecht et al (20) showed a significant increase in MT contrast from a range of 13–19% to a range of 34–37% in WM in children aged 1–80 months. This finding is thought to reflect the progress of myelination, as the total water content of brain decreases (21) and the amount of cholesterol and phospholipids increases (22). Although some MT studies resulted in the generation of global MTR values in healthy adults, these individuals were used only as control subjects in studies of WM diseases (10, 12, 15, 16). Few studies have been performed to carefully examine the MTR values in healthy adults, and few groups have detected the microscopic changes in WM due to normal aging (23). We found significantly different WM MTR histogram measurements in younger (<50 years) and older (≥50 years) adults, on the basis of the total segmented tissue. The data presented indicate that clear age-related WM chemical and structural changes are present in adult brains; these changes seem to be invisible on conventional MR images. This observation is consistent with the findings of Hofman et al (23) in which a decreased mean WM MTR was found with increasing age, and it is consistent with findings of lower MTR parameters in periventricular hyperintensities in the elderly (14, 24). This finding also agrees with the results from a diffusion-weighted imaging study in which fractional anisotropy (a measure for integrity of microstructure) in WM significantly decreased with age (25). These changes are thought to reflect the process of neurodegeneration (ie, cell death, axon loss, and myelin pallor with gliosis) (17). However, Mehta et al (26) found no age dependency of the MTR parameters in deep WM of healthy adults. Two reasons for this discrepancy are possible. First, Mehta et al measured MTRs in discrete areas of deep WM rather than global WM, as in our study, and the areas chosen can heavily influence the MTR results. For example, in the study by Mehta et al, the mean MTR ranged from 31% to 38%. Because MTR histograms are generated on the basis of each pixel, the statistical power may be decreased if the subcortical and other areas of WM are not included. Furthermore, because most neurodegenerative diseases generally affect the entire brain, the global measure is thought to be a better quantitative marker for estimating the net effects of all kinds of pathologic conditions. Second, the imaging sequence with which the MT pulses combine can influence the MT effect (27). Mehta et al (26) used the T1-weighted sequence, which showed a 50% relative reduction in the measured MT effect of WM, compared with proton density–weighted sequence (28). The addition of an MT pulse to a 3D gradient-echo protocol in our study could have improved endogenous contrast (29) and resulted in higher MT effects. However, in the current study, the lower global WM MTR measurements in healthy older adults may correspond to long-term tissue loss, which was suggested in our previous study (17). These global MTR measures may have potential as tool for monitoring the disease burden to assess the effects of drugs and therapy in the state of disease processes, as shown in some multiple sclerosis studies (30, 31).
The results based on the global GM also indicate that significant age-related changes affect the MTR histogram mean, median, first quartile, and peak height. The MTR measures are sensitive enough to help detect even subtle differences in GM between younger and older adults. The decreases in MTR measures in GM with age may have resulted from the degenerative changes in myelin and axons in the gyral cores and subarcuate fibers in the GM (32). The demyelination and axonal degeneration that appears in GM may be explained by a neuronal cell body disorder (ie, reduced size), which could result from a decrease in the global cortical metabolic rate in aging people (33). At the same time, more free-water content in the enlarged extracellular space would result in decreased MTR values. However, MT effects for GM were small compared with those for WM (Fig 3), perhaps because of the smaller amount of myelin and axons in the GM; these results are in agreement with findings from other studies (26, 34).
However, in the current study, we did not find a significant difference in the MTR histogram peak location and third quartile for either GM or WM in the younger and older groups. The MTR histogram in this study was based on the results of volumetric analysis. As shown in Figure 3, the mean MTR represents the average value of all voxels from the total segmented GM or WM. The peak height (y axis) represents the largest number of voxels that have the same MT ratio (peak location) on the x axis. The lowering of the normalized peak height in older group compared with that of the younger group in this study suggests that a greater variation may be present in tissues of older persons so that the voxels are less likely to have the modal value in older people. Furthermore, in this and previous studies (15, 16) the decrease in the peak height was coincident with an increase in the first quartile, as indicated in Figure 3. Therefore, the peak height was frequently used as a marker to reflect the amount of remaining normal brain tissue in patients compared with healthy control subjects (12–15), and normalized to adjust for head size or volume loss. However, significant changes in the peak location and the 75th percentile of the histogram may suggest that the MTRs in a larger number of voxels in certain segmented tissue have changed, as shown in the study of normal-appearing brain tissue in multiple sclerosis (35). This was not the case in the current study.
As shown in Figure 4, the means of both GM and WM MTR histograms demonstrated a quadratic relationship with age. The MTR mean, median, and first quartile of these two tissue types each showed a slight increase with age until middle adulthood. One possible implication of this interesting pattern is that WM maturation or myelination may slowly continue until around age 40 years, when the MTR measures (mean, median, first quartile) first begin to decrease. This finding further confirmed the suggestions of our volumetric study (17) and other studies (36, 37) in which the WM volume slowly increases until middle adulthood, suggesting continued myelination, and degenerative changes of WM begin only from the middle of adulthood. However, some inconsistencies existed regarding the GM change with age between the volumetric data (17) and the current MTR data. GM volume was found to decrease linearly with age, beginning in early adulthood (17), whereas GM MTR changes in a quadratic way and starts decreasing only after midlife. We found that both GM and WM MTR had a similar pattern of change with age, which indicated that GM MTR changes are primarily due to the changes in the small amount of WM within the GM. The myelinated process of extended fibers of subarcuate and gyral cores might be involved in the aging process. This finding can also be explained by the much lower MTR values in GM relative to those in the WM, because the MTR was considered to be a sensitive marker for myelin structure changes. However, in this study, the pattern of change in the MTR histogram peak height that linearly decreased in both tissues may suggest constant changes occur with increased variation of MTRs in the brain, either because of maturation (MTR increase) and an aging (MTR decrease) process.
However, the MTR measured in the current study is based on the whole-brain GM and WM. Thus, the results indicate changes in each brain tissue type as a whole. In the current study, we did not find significant sex-related MTR differences for either GM or WM. The results of our study differ slightly from those reported by Hofman et al (23) in which the mean MTR of WM in men was higher than that in women. The reason for the difference in sex-related effects between their study and ours is uncertain, but it may be related to the differences in the WM segmentation technique. While we used global WM and segmented it on the basis of 3-mm dual-echo FSE axial images without gap, Hofman et al (23) used only the part of brain anterior to the splenium of the corpus callosum and segmented the WM on the basis of coronal 6-mm MT images with a 0.6-mm gap. Furthermore, the mean age of subjects in their study was 10 years older than the mean age of our subjects. These findings must be clarified or replicated in further studies, because previous studies did not reveal significant sex differences in either T1 and T2 relaxation times (36) or in diffusion tensor measurements (39) in WM.
Conclusion
Quantitative MT imaging may offer the clinician sufficient sensitivity and accuracy to characterize the time course of subtle changes in the adult brain due to age. The MTR histogram data shown in this study compare favorably with the data of volumetric measurements from the previous study and further imply the mechanism of delayed WM volume growing until the middle of adult life (17). We found significant decreases in MTR in both GM and WM with advancing age, but only starting at middle age. The identification of such differences would have implications in understanding and interpreting MTR data in the diseased states.
Footnotes
Supported in part by grant NS29029 from the National Institutes of Health.
References
- Received October 2, 2001.
- Accepted after revision April 18, 2002.
- Copyright © American Society of Neuroradiology
In this issue


Jump to section
Related Articles
Cited By...
- Anatomical characterization of the inferior petrosal sinus and adjacent cerebellopontine angle cistern for development of an endovascular transdural cerebrospinal fluid shunt
- Proximal nerve magnetization transfer MRI relates to disability in Charcot-Marie-Tooth diseases
- Magnetization Transfer Imaging in Premanifest and Manifest Huntington Disease: A 2-Year Follow-Up
- Aortic Pulse Wave Velocity Predicts Focal White Matter Hyperintensities in a Biracial Cohort of Older Adults
- Mapping Infant Brain Myelination with Magnetic Resonance Imaging
- The Impact of Sex and Vascular Risk Factors on Brain Tissue Changes with Aging: Magnetization Transfer Imaging Results of the Austrian Stroke Prevention Study
- Magnetization Transfer Imaging Shows Tissue Abnormalities in the Reversible Penumbra
- Diffusion tensor magnetic resonance imaging at 3.0 tesla shows subtle cerebral grey matter abnormalities in patients with migraine
- Influence of aging on brain gray and white matter changes assessed by conventional, MT, and DT MRI
- Fatigue and primary biliary cirrhosis: association of globus pallidus magnetisation transfer ratio measurements with fatigue severity and blood manganese levels
- Magnetization transfer and diffusion tensor MRI show gray matter damage in neuromyelitis optica