
Article Figures & Data
Figures
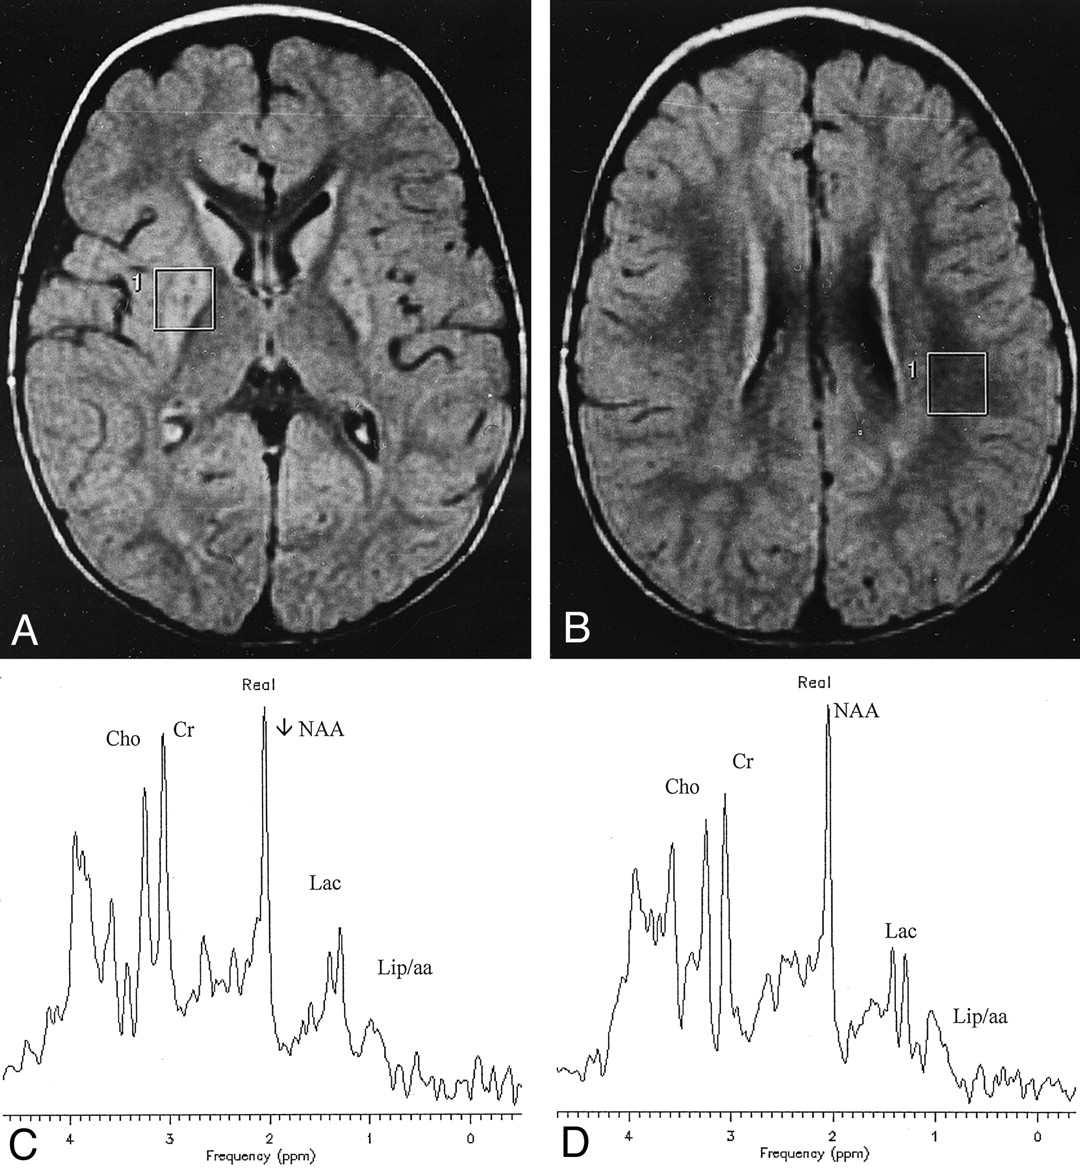
- Fig 1.
Patient 14 with Leigh syndrome.
A and B, Axial FLAIR images show bilateral and symmetrical hyperintensity of corpora striata. The VOIs used for spectroscopy are also shown.
C, Spectrum from the VOI containing the right affected putamen demonstrates resonances at 1.33 and 0.9 ppm coming respectively from lactate (Lac) and lipids or branched amino-acids (Lip/aa).
D, Abnormally high brain lactate (Lac) is also revealed in the spectrum from the VOI located in paraventricular white matter that appeared normal on the MR image.
Cho indicates choline; Cr, creatine.
- Fig 2.
Patient 15 with MELAS.
A and B, Axial FLAIR images demonstrate multiple cortical strokelike lesions, the largest of which was located along the parieto-occipital cortex (not shown). Tiny frontal and parietal cortical hyperintensities and the VOIs used for spectroscopy are visible.
C and D, Spectra reveal high lactate (Lac) and the 0.9 ppm signal (Lip/aa) not only into the damaged cortex (C) but also into the normal-appearing parietal cortex (D). A significant decrease of NAA may also be appreciated in the spectrum in C. Cho indicates choline; Cr, creatine.
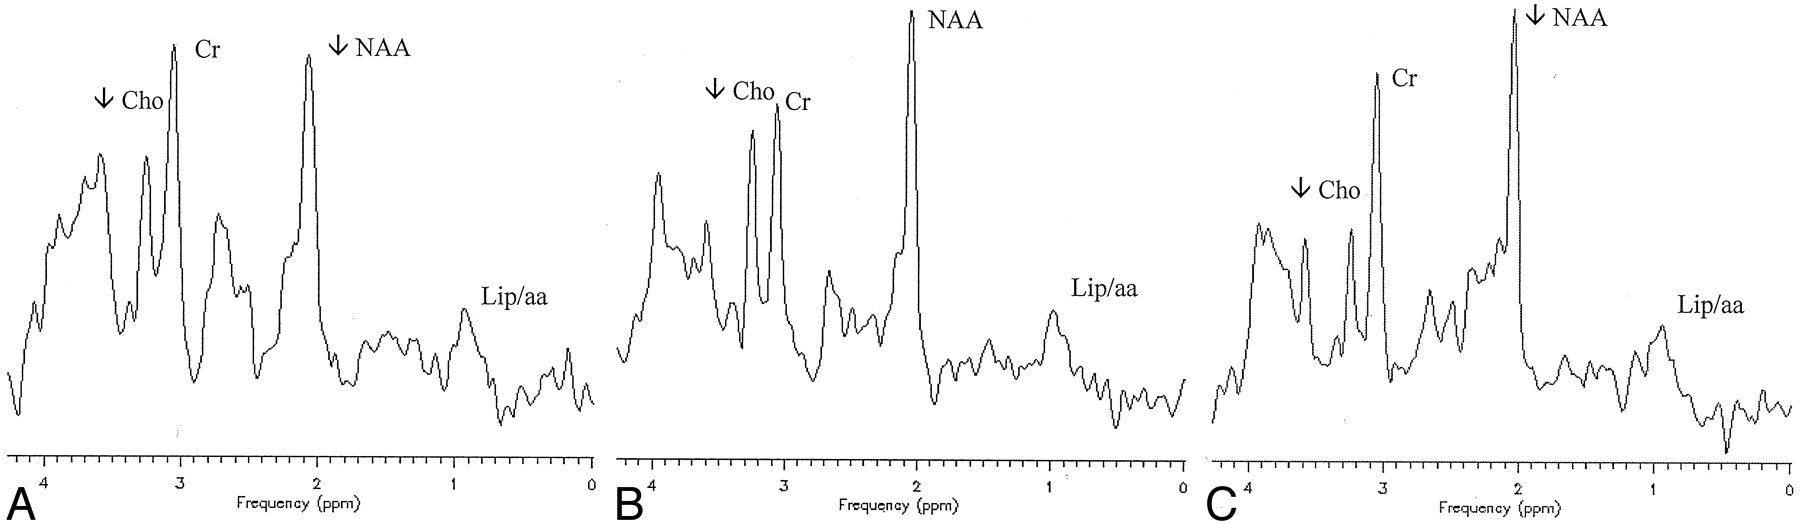
- Fig 3.
A–C, Single-voxel proton spectra from a normal-appearing cerebellar volume (A, patient 12), a normal-appearing parieto-occipital white matter volume (B, patient 3), and a normal-appearing parieto-occipital cortex (C, patient 1). Spectra reveal a significant decrease of choline (Cho) and the presence of a low amplitude signal at 0.9 ppm (Lip/aa) in each anatomic location. NAA is decreased in cerebellar (A) and parieto-occipital cortex (C) locations. Cr indicates creatine.
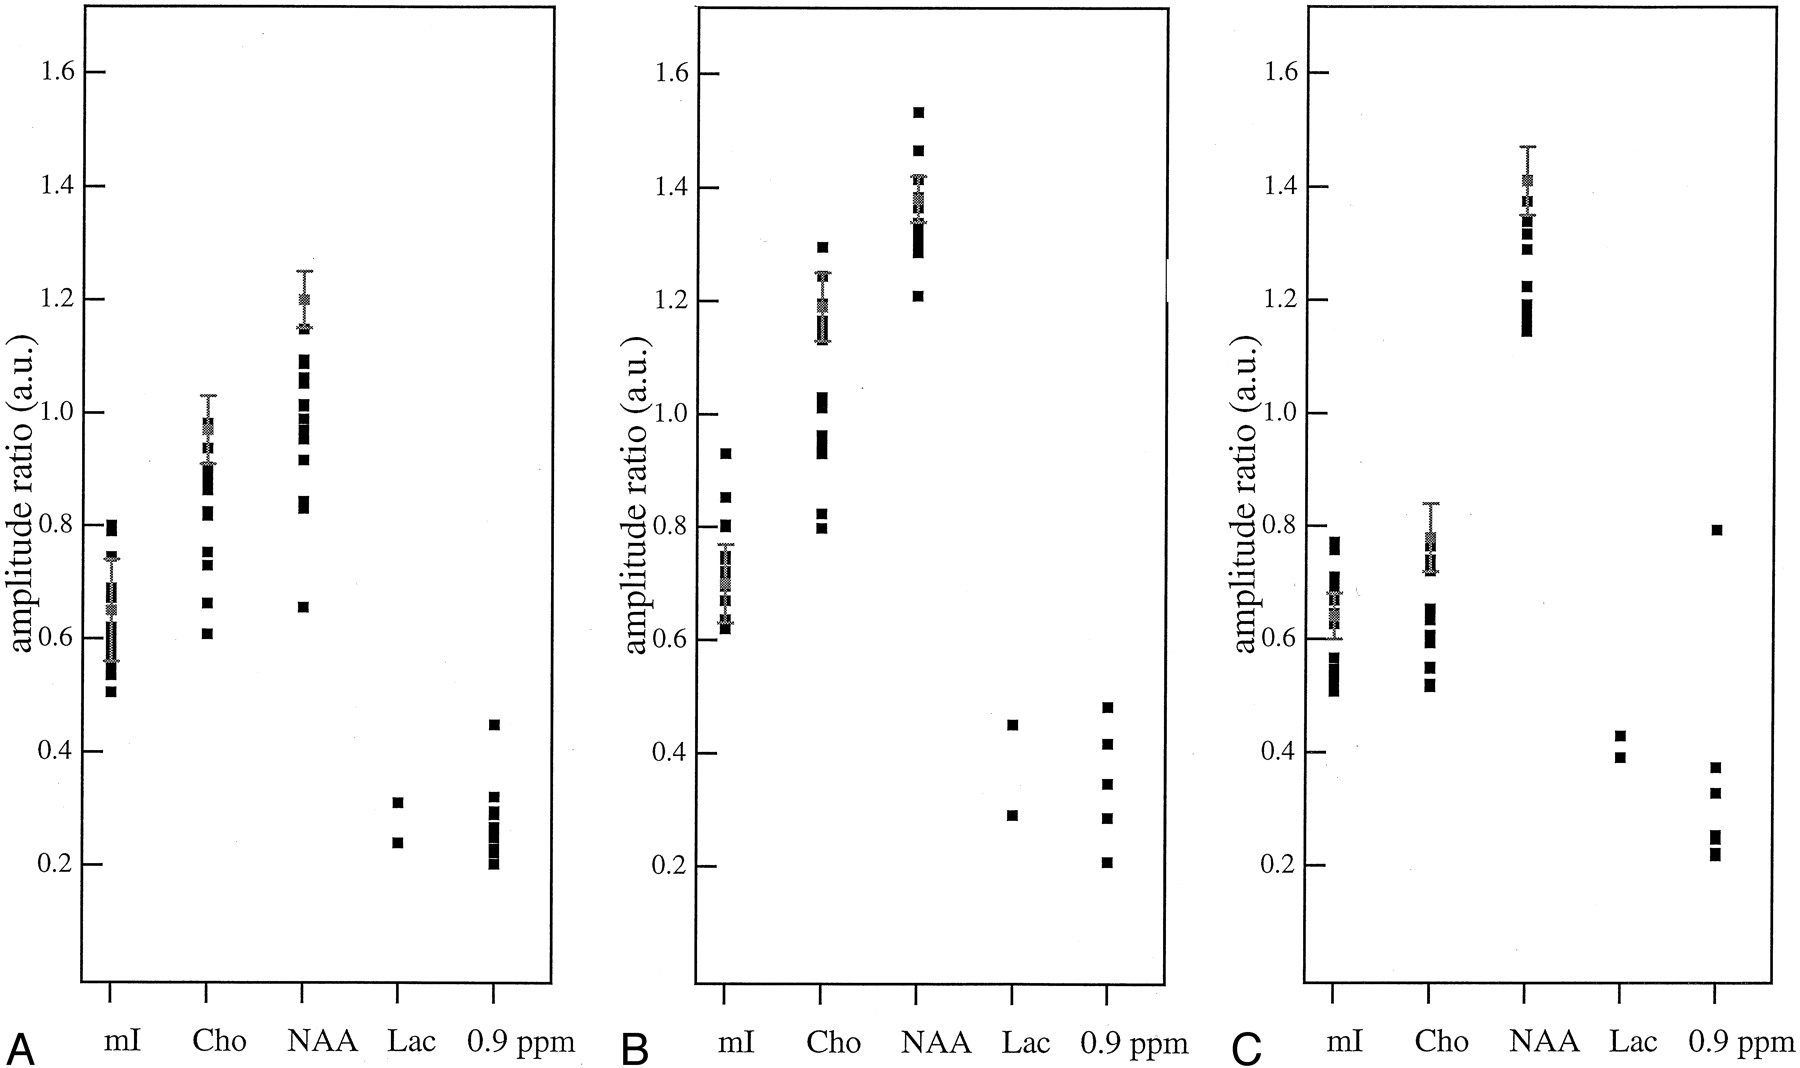
- Fig 4.
A–C, Plots of the metabolite ratios reported in Table 3 for cerebellum (A), white matter (B), and parieto-occipital cortex (C). Vertical bars are the range of each ratio in 15 control subjects. mI indicates myo-inositol; Cho, choline; Lac, lactate


Tables
- TABLE 1:
Clinical features and laboratory characterization of patients with mitochondrial diseases
Patient No. Sex/Age (y) Clinical Features Muscle Biopsy mtDNA Diagnosis Disease Duration (y) 1 M/26 EO, Pt, T, D No RRF, COX- sd (7700bp) PEO+ 12 2 F/56 EO, Pt RRF, COX- md* AD-PEO 4 3 F/37 EO, Pt, Ps n.p. n.p. AD-PEO 7 4 F/47 W, EO, Pt RRF, COX- No mutation detected PEO 12 5 F/71 W, EO, Hy RRF, COX- sd (3500 bp) PEO+ 21 6 F/58 EO, A, Hy RRF, COX- md EM 3 7 M/57 A, S, Lip RRF, COX- md EM 14 8 M/43 W, Pt, D, P RRF, COX- md EM 13 9 F/49 EO, Pt, A RRF, COX- md EM 10 10 F/22 Pt, Se RRF, COX- pm 3243 MELAS 18 11 M/29 EO, Pt, W, A, Hy RRF, COX- sd (5500 bp) KSS 15 12 F/11 EO n.p. pm 5814 (lymphocytes) PEO+ 6 13 M/2 A, MR n.p. pm 8993 NARP 2 14 M/18 mo Hp, W Co II-IIId† n.p. Leigh 1 15 M/6 Se n.p. pm 3243 (lymphocytes) MELAS 10 mo Note.—A indicates ataxia; AD-PEO, autosomal dominant progressive external ophthalmoplegia; Co II-IIId, complex II-III deficiency; Cox-, citochrome oxidase negative fibers; D, diabetes; Dy, diplopia; EM, encephalomyopathy; EO, external ophthalmoplegia; Hp, hypotonia; Hy, hypoacusia; KSS, Kearns-Sayre syndrome; Lip, lipomatosis; md, multiple deletion; MELAS, mitochondrial myopathy, encephalopathy, lactic acidosis, and strokelike episodes; MR, mental retardation; n.p., not performed; NARP, neuropathy, ataxia, retinitis pigmentosa; P, parkinsonism; pd, point deletion; PEO, progressive external ophthalmoplegia; Ps, psychosis; Pt, eyelid ptosis; RRF, ragged red fibers; S, spasticity; sd, single deletion; Se, seizures; T, tremor; W, muscle weakness.
* Detected in family members.
† Assessed biochemically.
Patient No. MR Findings 1 Normal 2 Mild cerebral atrophy 3 Normal 4 Mild cerebral atrophy 5 Mild cerebral atrophy, PVWM T2 hyperintensity 6 PVWM T2 hyperintensity 7 Cerebral and cerebellar atrophy 8 Mild cerebral atrophy 9 Mild cerebral atrophy 10 Left parieto-occipital and right occipital cortical strokelike lesions 11 Cerebral and cerebellar atrophy, diffuse T2 hyperintensity of cerebral white matter, globi pallidi, and midbrain dorsal aspect 12 Normal 13 Symmetrical T2 hyperintensity in putamina 14 T2 hyperintensity in corpora striata and lamina quadrigemina 15 Multiple and small cerebral cortical strokelike T2 hyperintensities Note.—PVWM indicates paraventricular white matter.
- TABLE 3:
Brain single-voxel 1H MR spectroscopy of the patients presented in Table 1 (STEAM sequence at echo-time of 30 ms)
Patient No. Cerebellum White Matter Parieto-occipital Cortex ml Cho NAA Lac 0.9 ppm mI Cho NAA Lac 0.9 ppm mI Cho NAA Lac 0.9 ppm 1 0.5 0.87 1.09 – 0.23 0.63 0.80 1.33 – – 0.52 0.55 1.19 – 0.25 2 0.62 0.98 1.06 – 0.27 0.71 1.17 1.34 – – 0.62 0.76 1.32 – – 3 0.75 0.73 1.01 – 0.25 0.62 0.82 1.33 – 0.32 0.53 0.72 1.34 – – 4 0.78 0.61 0.92 – – 0.80 1.15 1.32 – – 0.53 0.55 1.16 – – 5 0.87 0.94 1.15 – 0.32 0.72 1.01 1.36 – – 0.69 0.61 1.18 – 0.33 6 0.58 0.90 1.02 – 0.45 0.69 1.19 1.21 – 0.48 0.67 0.52 1.37 – – 7 0.59 0.89 0.95 – – 0.71 0.96 1.37 – – 0.56 0.52 1.14 – – 8 0.57 0.90 1.09 – 0.29 0.64 1.03 1.29 – – 0.64 0.77 1.32 – 0.25 9 0.69 0.82 0.84 – 0.30 0.75 1.13 1.37 – – 0.71 0.59 1.18 – 0.37 10 0.55 0.87 1.05 – – 0.64 0.93 1.47 – 0.42 0.55 0.63 1.41 – – 11 0.61 0.86 1.09 – – 0.7 1.1 1.3 – 0.35 0.51 0.65 1.16 – 0.51 12 0.67 0.66 0.97 – 0.21 0.67 0.83 1.38 – – 0.52 0.72 1.29 – – 13 0.64 0.94 0.83 – – 0.75 1.14 1.53 – – 0.64 0.74 1.19 – 0.22 14 0.67 0.82 0.99 0.24 0.26 0.74 1.29 1.31 0.45 0.29 0.76 0.64 1.22 0.39 0.25 15 0.60 0.75 0.66 0.31 0.21 0.63 0.94 1.31 0.29 0.21 0.77 0.77 1.22 0.42 0.22 Normals Mean ± SD 0.65 ± 0.09 0.96 ± 0.06 1.19 ± 0.05 0.67 ± 0.07 1.19 ± 0.06 1.36 ± 0.04 0.64 ± 0.04 0.76 ± 0.06 1.41 ± 0.06 Note.—Metabolites’ resonance intensities are expressed as ratios to the Creatine/Phosphocreatine (Cr, at 3.05 ppm) signal intensities.
mI = myoinositol, at 3.56 ppm; Cho = choline, at 3.05 ppm; NAA = N-acetyl aspartate, at 2.01 ppm; Lac = lactate, at 1.33 ppm. The signal at 0.9 ppm could be either related to lipids or to branched chain amino acids.
In this issue


Jump to section
Related Articles
Cited By...
- Neuroimaging in mitochondrial disorders
- Cerebral metabolic abnormalities in A3243G mitochondrial DNA mutation carriers
- Metabolite measurements in the caudate nucleus, anterior cingulate cortex and hippocampus among patients with mitochondrial disorders: a case-control study using proton magnetic resonance spectroscopy
- Early MR imaging and spectroscopy appearance of eIF2B-related leukoencephalopathy