
Abstract
BACKGROUND AND PURPOSE: Fabry disease is a multisystem X-linked disorder characterized clinically by angiokeratoma, corneal and lenticular abnormalities, acroparesthesia, and renal and cardiac dysfunction and stroke. We sought to describe novel neuroimaging characteristics of Fabry disease.
METHODS: Neuroradiologic records of 104 hemizygous patients with Fabry disease evaluated between 1994 and 2002 were reviewed. In total, 94 MR studies consisting of T1- and T2-weighted images were examined for the presence of hyperintensity on the T1-weighted images. Additional CT, gradient-echo (T2*-weighted), and fat-suppression MR studies were reviewed to characterize further the T1 abnormality in selected patients. In some patients, cerebral blood flow (CBF) was quantified by using arterial spin tagging (AST).
RESULTS: Overall, 22 patients (∼23%) demonstrated pulvinar hyperintensity on T1-weighted images; the frequency increased with age to over 30% by age 50 years. Susceptibility-weighted T2* studies demonstrated a low-signal-intensity abnormality in the pulvinar in the more severe cases, whereas CT demonstrated the pulvinar to be mineralized. CT attenuation corresponded with an increasing signal intensity on T1-weighted images. Posterior circulation CBF was found to be elevated on individual AST studies, especially in the thalamus.
CONCLUSION: Hyperintensity in the pulvinar on T1-weighted images is a common finding in Fabry disease, likely reflecting the presence of calcification. Although other minreralizing abnormalities may result in calcification of deep gray nuclei, exclusive involvement of the pulvinar may be distinctively characteristic to Fabry disease. Increased CBF in the posterior circulation, particularly the thalamus, suggests that the dystrophic calcification is secondary to cerebral hyperperfusion and selective vulnerability of the pulvinar and adjacent thalamic nuclei. The finding of isolated pulvinar hyperintensity on T1-weighted images should suggest Fabry disease, particularly when seen in conjunction with other nonspecific neuroradiologic manifestations of the disease.
Fabry-Andersen disease was originally described independently by Anderson in England and Fabry in Germany in 1898 following observation of cutaneous aspects of the disease termed angiokeratoma and purpura papulosa hemorrhagica by each author, respectively (1, 2). Subsequently, Fabry disease was determined to be an X-linked lysosomal storage disorder secondary to deficiency of the enzyme α-galactosidase A (3). Clinical features typically consist of acroparesthesias, neuropathic pain, hypohidrosis, corneal inclusions, cataracts, and cutaneous angiokeratoma, followed by progressive renal, cerebrovascular, and cardiac disease (4). The diagnosis of Fabry disease is usually made by recognition of the typical clinical symptoms with or without a family history or by recognition of the ocular or cutaneous manifestations of the disease.
Neuroradiologic findings in the condition may evolve with time and can consist of dolichoectasia, extensive periventricular white matter signal intensity abnormalities (leukoaraiosis), and commensurate cerebral volume loss. Often the MR imaging appearances in heterozygote patients are normal. Other cerebrovascular findings are large- and small-vessel strokes with deep small-vessel infarcts or lacunae occurring in the basal ganglia (5). These were found in 10 of 53 patients in one series; however, known risk factors for small-vessel disease such as hypertension and diabetes mellitus could not be excluded as confounding causes (6). Periventricular white matter lesions in Fabry disease may be found on T2-weighted or on fluid-attenuated inversion recovery, or FLAIR, MR images, with progressive radiologic evidence of leukoaraiosis after age 25 years. Dolichoectasia of the cerebral vasculature was noted by Mitsias and Levine (6) in a descriptive meta-analysis of 53 cases of Fabry disease. The vertebrobasilar system was particularly affected, but the carotid circulation was also involved. These MR finding are, however, nonspecific (7). Physiologically, positron emission tomographic (PET) studies demonstrated a statistically significant increased cerebral blood flow (CBF) in the posterior circulation, without clear evidence of end-organ damage (8).
In this study, we sought to describe and characterize a possibly unique abnormal hyperintensity in the thalamus on T1-weighted images in patients with Fabry disease.
Methods
Patients
We performed a retrospective review of all brain MR imaging studies of hemizygous male patients with Fabry disease who were registered between 1994 and 2002. A total of 104 patients were identified, 94 of whom had MR studies including T1- and T2-weighted techniques. The mean age was 35 ± 12 years, with a range of 9–64 years. All patients were studied under protocol approved by the institutional review board and gave written informed consent. Included in the patient population were two patients with a history of end-stage renal disease. Both were treated, one with renal transplantation and the other with peritoneal dialysis. At the time of neuroradiologic evaluation, none of the patients had evidence of hypo- or hypercalcemia or other metabolic disorders except Fabry disease. Confounding abnormalities known to give rise to abnormal hyperintensity on T1-weighted images in the basal ganglia include human immunodeficiecy virus (HIV) seropositivity, whole-brain radiation, liver failure, and total parenteral nutrition (9). None of these features was present in our patient population. Further, no patient had neurologic symptoms or signs consistent with posterior thalamic dysfunction such as aphasia, visual hallucinations, sensory abnormalities, burning paresthesia, or abnormal limb movements or posture.
MR Technique
Spin-echo T1-weighted (n = 82) or 3D spoiled gradient-recalled acquisition in the steady state (SPGR) T1-weighted (n = 12) images were evaluated for hyperintensity. SPGR images were evaluated only if no spin-echo images were available. Spin-echo T1-weighted sequence parameters were 300–450/8–17 (TR/TE), section thickness 3.75–5 mm, field of view 22–24 cm. SPGR T1-weighted sequence parameters were 18.4, flip angle 20°, field of view 24 cm, section thickness 1.5 mm reformatted to 5 mm. Additional studies, CT (5-mm section thickness) and gradient-echo T2*-weighted MR images (600/50, 5-mm section thickness), were available in four patients. These four patients were selected after demonstration of the T1 abnormality and chosen randomly as representative of the degree of T1 signal intensity abnormality. Fat suppression and in-phase and out-of-phase imaging were applied in one case. Regional CBF was derived by using arterial spin tagging (attenuating static signal in arterial spin tagging [ASSIST] sequence, section thickness 5 mm out of plane and 3.3 mm in plane) in three cases (one with normal head MR images). These patients were also chosen as representative of the T1 signal intensity abnormality (10). In brief, a flow-induced adiabatic inversion inverted the arterial water spins in the tagging plane ∼3 .0 cm below the volume acquisition block (8.8 cm thick) position from about the midpons to the cortical gray matter. The arterial spin tagging (AST) data were collected during a 10-minute period with the ratio change of the MR imaging signal intensity amplitude from brain intraparenchymal water when the spins are perturbed to the steady brain intraparenchymal water signal intensity. Appropriate ‘crusher gradients’ reduced the amplitude of the MR signal from moving arterial protons. These together with correction for longitudinal relaxation occurring during arterial spin transit time allowed a single-compartment delayed-acquisition approach to CBF calculation.
Results
The prevalence of the abnormal posterior thalamic T1 hyperintensity in this cohort was ∼23% (22 patients), with increasing age-dependent frequency. This abnormality was not seen until about the third decade of age, with a progressive increase in prevalence over the age of 30 years (Fig 1). Of the 94 studies examined, 72 had normal signal intensity on T1-weighted images.

A, Age distribution of patients with (black bars) and those without (gray bars) hyperintensity on T1-weighted images. B, Percentage of patients with hyperintensity on T1-weighted images by decade of age (n = 94 patients)
The signal intensity abnormality on T1-weighted MR images was well circumscribed and was in the expected location of the pulvinar in all cases (Fig 2). No T2 hyperintensity suggesting gliosis or edema was identified in the posterior thalamus. Further, there was no evidence to suggest volume loss, and no enhancement was seen after intravenous administration of a gadolinium-based contrast agent.

Serial, axial T1-weighted MR images (5-mm sections) demonstrate the range of pulvinar hyperintensities observed.
A and B, Mild to moderate abnormality.
C, Marked abnormality.
CT scans demonstrated increased attenuation in the pulvinar region corresponding to the sites of hyperintensity on T1-weighted MR images. Attenuation levels were consistent with calcification. Increasing attenuation corresponded to the severity of the T1 signal intensity abnormality (Fig 3). Although the T1 hyperintensity was confined to the pulvinar, CT demonstrated that mineralization was not necessarily confined to the pulvinar, demonstrating extrathalamic sites of involvement. In one patient (Fig 4), the calcification was found in the juxtacortical arcuate fibers, the cerebellar corticomedullary junction, and the globus pallidus, in addition to the posterior thalamus. Despite this, the T1 hyperintensity was only identified in the pulvinar. There were no clinical abnormalities that we could relate to posterior thalamic dysfunction.

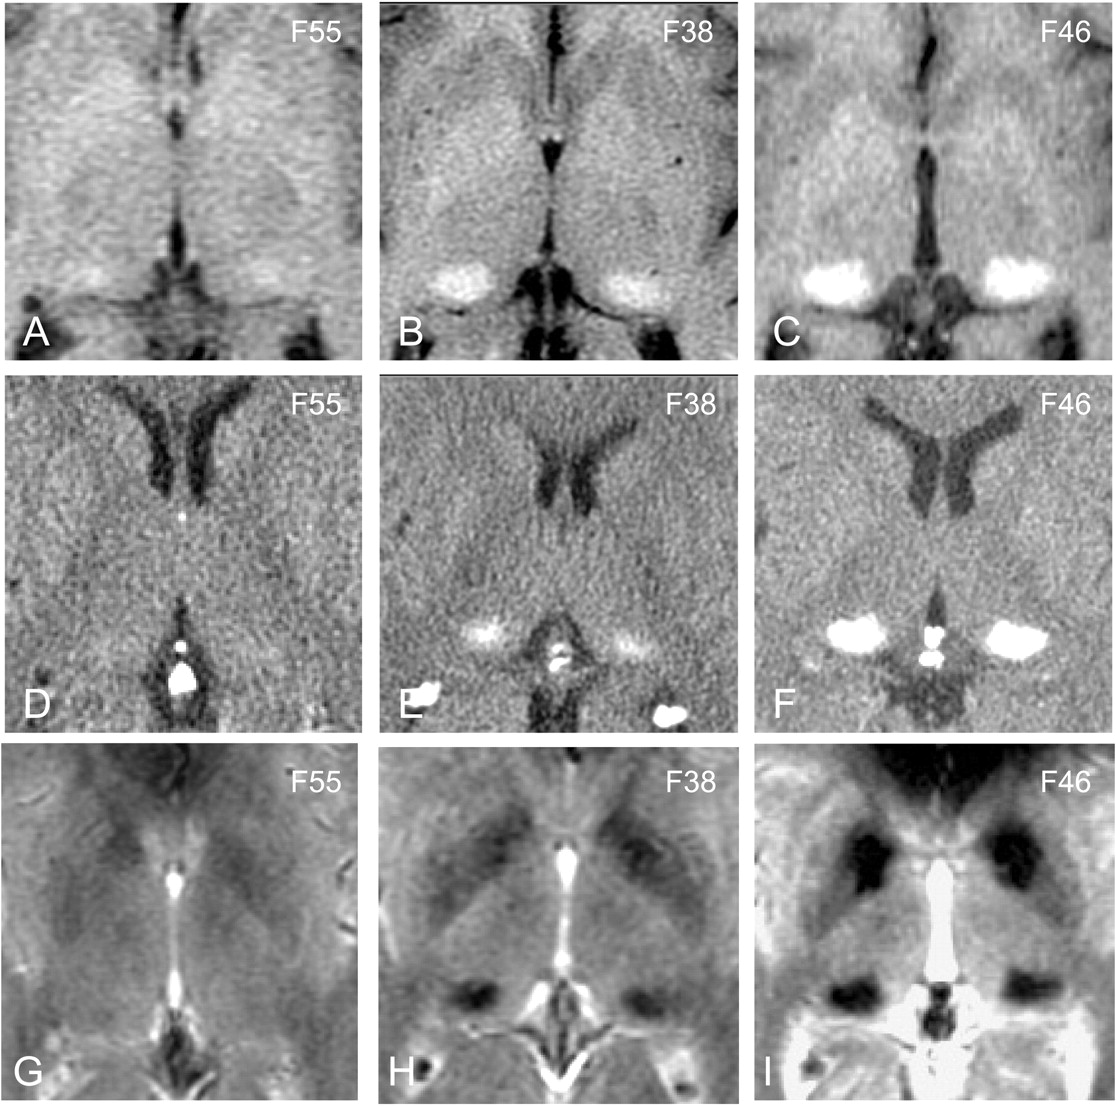
Comparison of CT and MR findings in the posterior thalamus.
A–C, T1-weighted images through the thalamus in three patients with mild (A), moderate (B), and marked (C) hyperintensity, respectively.
D–F, Corresponding CT scans demonstrate increased attenuation indicating calcification is present only in the moderate and marked cases.
G–I, Corresponding gradient-echo T2*-weighted images demonstrate that susceptibility-induced signal intensity loss is seen in the pulvinar in only the moderate and marked cases. Numbers in upper right are patient identifiers.

A–C, Selected axial CT scans demonstrate dystrophic calcification of the subcortical arcuate fibers, globus pallidus, pulvinar, and cerebellar corticomedullary junction in a more severely affected patient with Fabry disease. Number in upper right is the patient identifier.
Susceptibility-weighted gradient-echo T2*-weighted studies demonstrated signal intensity loss in the cases of more marked increased signal intensity on T1-weighted images (Fig 3). In the cases with milder T1 signal intensity abnormality, there was no associated T2* signal intensity loss. No change in signal intensity of the pulvinar was observed with the application of fat suppression or with in-phase and out-of-phase imaging.
Increased CBF was noted in the vertebrobasilar system on AST images, especially in the posterior thalamus and pulvinar region. Representative CBF (range 1–163 mL/min/100 g of tissue) maps are shown in Fig 5, indicating elevated CBF in the posterior circulation and particularly in the thalamus.

Direct axial AST images demonstrate increased relative CBF in the thalamus and posterior circulation at the anterior and posterior commissure plane in a patient without (A) and one with (B) the T1-weighted MR imaging abnormality. The dark thalamic regions in the pulvinar in B correspond to the damaged mineralized areas in the midst of the still hyperperfused pulvinar region.
Discussion
The hyperintensity in the pulvinar region on T1-weighted images in the present retrospective study of 94 hemizygous patients with Fabry disease suggests a distinctively characteristic MR finding related to this disease. A number of endogenous and exogenous substances can cause T1 shortening, resulting in hyperintensity on T1-weighted MR images. Endogenous substances that commonly cause hyperintensity on T1-weighted clinical MR images include fat, calcium (11, 12), manganese (9), iron (ferric form as found in methemoglobin) (13), melanin (14), free radicals, and elevated protein concentrations (15). Since Fabry disease is a disorder of glycolipid metabolism, we had considered the possibility that fat deposition could account for the T1 hyperintensity. The lack of signal intensity change when using MR fat suppression excluded fat as a possible agent. CT is particularly sensitive to calcification, and increased CT attenuation is most commonly the result of calcium deposition. Tissue mineralization tends not to be a homogeneous process, and other elements such as iron that can be found within the mineralized tissue may contribute to CT attenuation. The correspondence of the CT and MR findings indicates that the MR findings are due to tissue mineralization. Although CT was performed in only a few cases, there is a striking correspondence of the extent of signal intensity abnormality on MR images and the presence of calcification on CT scans, suggesting that a CT abnormality would be seen in all cases with MR signal intensity abnormality.
Although calcification on CT scans is most typically associated with signal intensity loss on MR images, the T1 shortening effect resulting in hyperintensity on T1-weighted images is well described. This has been attributed to surface interaction of protons with calcified tissue (11). At lower concentrations of calcium, T1 shortening effects dominate, resulting in hyperintensity, whereas at higher concentrations (above 30–40%) susceptibility effects and decreases in proton density dominate, leading to signal intensity loss (11). In fact, both effects were seen in a single patient (eg, Fig 2C), in whom the posterior thalamus had high signal intensity and the globus pallidus had low signal intensity with a thin rim of increased signal intensity. Although little qualitative difference between the calcification in these two regions was identified on CT scans (eg, Fig 4), the MR appearance suggested some differences in the mineralization process. We believe that the prominence of the T1 signal intensity in the pulvinar reflects deposition of calcium because of the changes identified on CT scans. However, other paramagnetic substances (eg, zinc, manganese, chromium, etc) may be deposited together with calcium in mineralized tissue (16). It is interesting to add that we never saw signal intensity loss in the posterior thalamus on T1-weighted images, as can be seen in the globus pallidus, again indicating a difference in calcium deposition and the mineralization process in these two regions.
Iron and calcium both have susceptibility effects resulting in signal intensity loss on nonrefocused MR images. Iron has a much stronger susceptibility effect than calcium and would therefore increase signal intensity loss on gradient-echo T2*-weighted images more than on T1-weighted images if iron deposition was the dominant tissue abnormality. This was not the case in our study, suggesting that calcium is the dominant component of the tissue mineralization abnormality. The stability of signal intensity with and without fat-suppression MR studies indicates the nonlipid nature of the lesion. The lack of contrast material enhancement indicates no selective alteration in the blood-brain barrier.
The differential diagnosis of such calcific lesions includes hypercalcemia; hypocalcemia; postirradiation, postinfarct, and postinflammatory calcification; Fahr syndrome; and HIV-associated mineralizing calcific microangiopathy. The lack of any serum calcium abnormality, HIV, exposure to ionizing radiation, or CNS inflammation suggests a distinctly characteristic MR finding associated with Fabry disease. Further, the calcifications in these other disease process tend to favor the basal ganglia, which receives blood supply from the carotid or anterior circulation. In Fahr disease in particular, there may be a familial component with development of striopallidal calcinosis together with involvement of the dentate nuclei. The calcification in Fahr disease is described as ‘punctate’ and dense, with low signal intensity on T1-weighted images. The observed findings in Fabry disease in the pulvinar show a granularity, suggesting that a lot of surface effects may be responsible for the T1 shortening, whereas in the striatopallidal area, if present, the calcification is more dense, restricting T1 shortening to the periphery. The combination of the T1 signal intensity abnormality and the high CT number suggest calcium salts as the dominant element of lesion composition. The elevated vertebrobasilar CBF previously demonstrated by PET and more recently in selected patients by AST suggest that cerebral hyperperfusion induces dystrophic posterior thalamic calcification. Since the calcification is not uniformly distributed in the posterior circulation, selective vulnerability of the pulvinar is possible. These finding also demonstrate an association between end-organ damage and the elevated posterior cerebral hyperperfusion. The exact mechanism of posterior cerebral hyperperfusion in Fabry disease is unclear; however, there may be dysregulation at a pericyte and endothelial level, which may be dominant in the posterior circulation owing to the differing embryologic origin of the vascular tissue between the anterior and posterior circulation (17, 18). Vasoreactivity and autoregulation of the posterior circulation is well known to differ from that in the anterior circulation, perhaps best demonstrated by the phenomenon of reversible posterior cerebral edema seen with hypertensive encephalopathy and other causes (19).
We previously described evidence of nitric oxide pathway dysregulation associated with increased oxidative stress in dermal and cerebral vasculature. These findings imply increased production of reactive oxygen species, such as the superoxide ion that has been shown in animal models to be a vasodilator (9). Again, the possible relationship of cerebral hyperperfusion to posterior mineralization can only be speculated upon; however, it is possible that hyperperfusion results in increased capillary leakage increasing the macromolecular content of the extracellular space, which is less well cleared from the pulvinar and posterior thalamic region, resulting in the formation of nidi, allowing dystrophic mineralization.
It is unclear at present why only about a third of the patients with Fabry disease eventually develop this MR abnormality. The correlation of this finding with elevated posterior circulation CBF needs to be explored in a larger series of patients, as does the coincidental occurrence of Fabry leukoencephalopathy and dolichoectasia. The age-dependence noted, on the other hand, may be attributed to chronic low-grade insult with an accumulation of damage over time. The relatively common use of MR imaging as an isolated imaging technique without the concomitant use of CT merits drawing attention to these T1-weighted imaging findings. The finding of increased signal intensity in the pulvinar on T1-weighted images should strongly suggest a diagnosis of Fabry disease, particularly if it can be associated with other less specific manifestations of Fabry disease.
Footnotes
Supported by the Intramural Program of the National Institute of Neurological Disorders and Stroke.
References
- Received October 28, 2002.
- Accepted after revision January 7, 2003.
- Accepted after revision January 7, 2003.
- Copyright © American Society of Neuroradiology
In this issue


Jump to section
Related Articles
Cited By...
- Increased resting cerebral blood flow in adult Fabry disease: MRI arterial spin labeling study
- Redefining the Pulvinar Sign in Fabry Disease
- Brain MR Imaging Findings of Cardiac-Type Fabry Disease with an IVS4+919G>A Mutation
- Hyperintense Dentate Nuclei on T1-Weighted MRI: Relation to Repeat Gadolinium Administration
- Brain Magnetic Resonance Imaging Findings Fail to Suspect Fabry Disease in Young Patients With an Acute Cerebrovascular Event
- Pulvinar: Associative role in cortical function and clinical correlations
- Cerebrovascular Involvement in Fabry Disease: Current Status of Knowledge
- Is CT Still Useful in the Study Protocol of Retinoblastoma?
- Invited Article: An MRI-based approach to the diagnosis of white matter disorders
- Diagnostic utility of different MRI and MR angiography measures in Fabry disease
- Central nervous system involvement in Anderson-Fabry disease: a clinical and MRI retrospective study
- Voxel based analyses of diffusion tensor imaging in Fabry disease
- Genomic abnormalities of the murine model of Fabry disease after disease-related perturbation, a systems biology approach
- Proteomics of specific treatment-related alterations in Fabry disease: A strategy to identify biological abnormalities