
Abstract
Summary: In this study, we compared 8-T gradient-echo MR images of the microvasculature in the live human brain with images of the unembalmed and embalmed postmortem brain. Small vessels were well visualized in the live brain and even better seen in the unembalmed postmortem brain, but they could not be visualized in the embalmed postmortem brain. These findings are important for direct comparisons of the microvasculature on 8-T MR images and on histologic sections.
Studies conducted with a whole-body 8-T MR imaging system have clearly demonstrated signal voids (<500 μm in diameter). These voids likely represent the leptomeningeal vasculature, the perforating cortical and medullary vessels, and other deep vessels of the in vivo brain (1–3). However, these observed signal voids have not yet been positively identified as arteries or veins, although some tentative identifications have been made on the basis of anatomic locations alone (1–3).
In this study, we generated images of the unembalmed and embalmed postmortem human brain in situ by using an 8-T MR unit and compared these images to others acquired in vivo. The purpose of this research was to evaluate the quality of the images obtainable from the cadaveric brain. We sought to determine if unembalmed or embalmed postmortem brain tissue is suitable for future correlative histologic studies designed to confirm that observed signal voids represent microscopic vessels and to positively distinguish the microscopic arteries and veins in the brain.
Technique
All images of the live and postmortem human brain were generated by using a console (Avance; Bruker, Billerica, MA) interfaced to an 8-T MR imaging unit with an 80-cm bore (Magnex; General Electric, Abingdon, UK). A 16-strut, modified, two-port, quadrature, transverse electromagnetic resonator radio-frequency (RF) coil was specifically tuned for each subject’s head before imaging was performed. Imaging of the live brain was conducted under institutional review board oversight and under a U.S. Food and Drug Administration investigational device exemption. Written informed consent was obtained from each subject before the imaging study. Imaging of the postmortem brain was performed on a cadaver donated for scientific research.
The unembalmed brain of an 83-year-old male cadaver with no known neurologic disease was imaged in situ within 48 hours of death. A licensed embalmer subsequently embalmed this cadaver, and it was imaged again. High-resolution multisection gradient-echo (GE) images of the unembalmed and embalmed brain were acquired in situ. Pulse-sequence parameters for these images were as follows: TR/TE/NEX, 500–1000/6–17/1; approximate flip angle, 20°; FOV, 20 cm; matrix, 512 × 512 or 1024 × 1024 pixels; section thickness, 2–4 mm; receiver bandwidth, 50 kHz; and acquisition time, 5–17 minutes.
Closely matched GE images of the live brain were acquired from a 52-year-old male volunteer. These images were generated with the following pulse-sequence parameters: 500–1000/10–16/1, approximate flip angle, 20°; FOV, 20 cm; matrix, 512 × 512 or 1024 × 1024 pixels; section thickness, 2 mm; receiver bandwidth, 50 kHz; and acquisition time, 5–17 minutes.
Images of the live brain and the unembalmed and embalmed postmortem brain were compared for their general appearance and depiction of the microvasculature. In addition, images of the unembalmed cadaveric brain acquired by using short and longer TEs were compared.
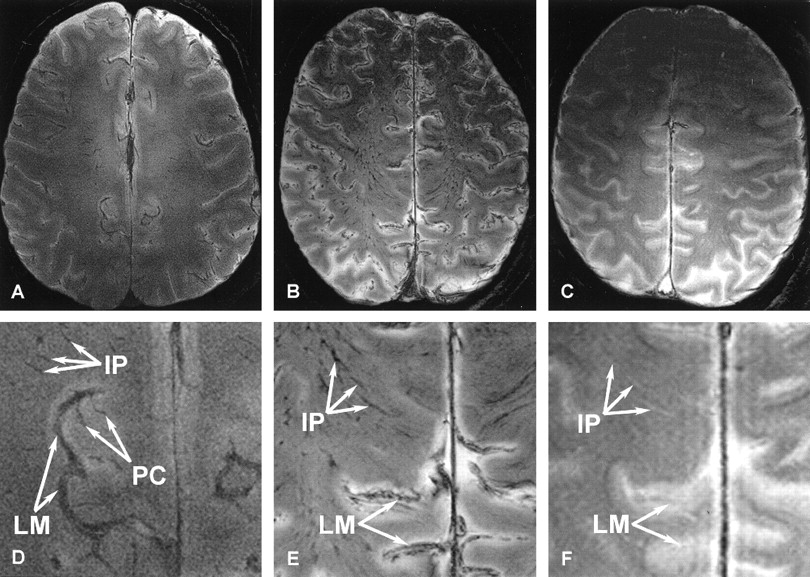
Figure 1 shows the 8-T GE images of the brain obtained in vivo, along with the images of the unembalmed and embalmed postmortem brain obtained in situ. The relative signal-intensity characteristics of the gray matter and white matter of the live brain (Fig 1A) were similar to those of the unembalmed postmortem brain (Fig 1B) and the embalmed postmortem brain (Fig 1C). In each set of images, structures with higher water content produced higher signal intensity, such that CSF or formalin demonstrated the highest signal intensity, cerebral gray matter had intermediate intensity, and white matter exhibited lower signal intensity. The lowest signal intensity was observed in the iron-bearing nuclei of the brain.

Axial 8-T GE images of the corona radiata obtained above the lateral ventricles. Parameters used to image the live and postmortem brain were TR/TE, 1000/16; FOV, 20 cm; matrix, 1024 × 1024 pixels; and section thickness, 2 mm.
A, The live brain.
B, The unembalmed postmortem brain.
C, The embalmed postmortem brain.
D–F, The enlarged regions of the images shown in A (D), B (E), and C (F). Note that the leptomeningeal (LM) and intraparenchymal (IP) vessels are present on both sets of images obtained in live and unembalmed postmortem brain, whereas the perforating cortical (PC) vessels are seen only on images of the live brain. None of these vessels are easily differentiated on images of embalmed postmortem brain. Most leptomeningeal and intraparenchymal vessels appear hyperintense and are difficult to visualize when filled and surrounded by formalin.
The blood vessels on the images of the living and unembalmed postmortem brain were resolved as low-signal-intensity structures, and they appeared enlarged because of magnetic susceptibility effects. The larger leptomeningeal vessels, running on the surface of the cerebral cortex, were well depicted in both the live brain and the cadaveric brain. Relatively few intraparenchymal (medullary) vessels were detected in the corona radiata of the live brain (Fig 1D), whereas a large number of these vessels were visualized in the unembalmed postmortem brain (Fig 1E). In contrast, perforating cortical vessels were better seen in live brain. The leptomeningeal and intraparenchymal vessels were barely visible after embalming (Fig 1F). Several superficial vessels of the scalp with intermediate signal intensities were visible in the live individual, whereas none of these vessels could be seen in the postmortem subject.
On images of the live and unembalmed postmortem brain, the dural sinuses were filled with blood and exhibited low signal intensity, whereas in the embalmed postmortem brain, these sinuses were filled with formalin and demonstrated high signal intensity. Overall, contrast between the gray matter and white matter decreased after embalming, and the images lacked the sharpness demonstrated on the images of the live and unembalmed postmortem brain.
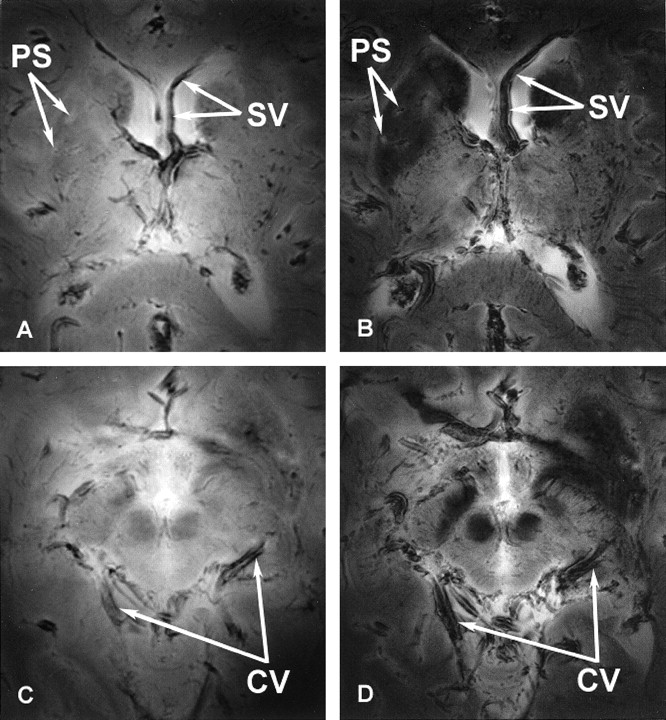
Figure 2 shows GE images of the unembalmed postmortem brain acquired by using short (6 msec) and longer (17 msec) TEs. Images generated by using a shorter TE displayed lower contrast between structures in the gray matter and white matter (Fig 2A and C). Lengthening the TE enhanced the T2* contrast, which improved the overall contrast of the images (Fig 2B and D) and also allowed better visualization of the vasculature and perivascular spaces surrounding the blood vessels. Larger magnetic susceptibility effects were apparent on the images acquired with a longer TE, which enhanced the visibility of the blood vessels. The contrast between the iron-bearing regions of the basal ganglia and midbrain (caudate nuclei, putamen, globus pallidus, substantia nigra, red nuclei) and the remaining brain (thalamus, internal capsule, corpus callosum) increased with increasing TE. Near the air-tissue interfaces, susceptibility-based artifacts due to signal intensity loss were more severe on the images generated with a longer TE.

Axial 8-T images of the basal ganglia (A and B) and midbrain (C and D) acquired from the same unembalmed postmortem brain by using GE pulse sequences with shorter (A and C) and longer (B and D) TEs. Parameters for A and C were 750/6; FOV, 20 cm; matrix, 512 × 512 pixels; and section thickness, 4 mm. Parameters for B and D were 750/17; FOV, 20 cm; matrix, 512 × 512 pixels; and section thickness, 4 mm. Note improvements in the gray matter–white matter contrast and the visibility of the perivascular spaces (PS) with the longer TE. The vasculature is better seen on the GE images acquired with a longer TE because of the increased susceptibility effects surrounding vessels, such as the septal vein (SV) and the cerebral vessels (CV).
Discussion
The 8-T GE images of the unembalmed postmortem brain in situ demonstrated signal intensities similar, although not identical, to those of the brain in vivo (Fig 1). Previous imaging studies conducted at lower field strengths have also demonstrated similarities in signal-intensity characteristics between the unembalmed postmortem brain in situ and the live brain (4, 5). Because signal intensities are largely related to differences in the water concentration within the brain and because water concentrations are assumed to be similar in the living and recently deceased brain, these findings could be anticipated.
Quantitative comparisons of the signal-to-noise ratio (SNR) and the contrast-to-noise ratio (CNR) are not trivial on high-field-strength images. The difficulty in reporting SNR and CNR data for 8-T MR imaging is that these values substantially vary across an image and between sections. This variation occurs because RF magnetic-field inhomogeneity leads to spatially variable flip angles and receiver sensitivity (6); therefore, the SNR and the CNR have to be described as a function of local flip angles and receiver sensitivity. For these reasons, we did not attempt to make direct quantitative comparisons of the SNR and the CNR on images of the live and postmortem brain.
With GE imaging of the living brain, visualization of blood vessels is largely dependent on blood oxygenation level dependent (BOLD) contrast and the sensitivity of GE imaging to local field inhomogeneities (7, 8). This susceptibility-based BOLD contrast is observed when diamagnetic oxyhemoglobin loses its oxygen and becomes paramagnetic deoxyhemoglobin. This deoxyhemoglobin acts as an endogenous contrast agent in the red blood cells and causes T2* shortening and inhomogeneous field gradients inside and around blood vessels (9). The actual observed effect, due to the presence of deoxyhemoglobin, is a dramatic loss in signal intensity (T2* shortening), which increases with increasing magnetic field strength (10, 11). Geometric distortions surrounding vessel lumina, due to the presence of paramagnetic deoxyhemoglobin, have been observed in previous studies (1, 3, 10), as well as our own.
We found that vessels in the brain were remarkably well resolved at 8 T. The number of microscopic leptomeningeal and intraparenchymal vessels visible on images of the unembalmed postmortem brain was much higher than on images of the live brain. Furthermore, these vessels were more clearly seen on the images of the cadaveric brain than on images of the living subject (Fig 1). Increases in deoxyhemoglobin concentration in postmortem vessels may be assumed to further shorten T2* relaxation times, improving vessel contrast in cadaveric studies. In addition, a lack of blood flow after death may be another reason for the improved vascular contrast.
In vivo, the signal intensity of vessels is the result of a complex interplay between time-of-flight (TOF) inflow effects, which increase the signal intensity, and BOLD effects, which decrease the signal intensity. In addition, spin motion in the susceptibility field produced by deoxyhemoglobin may lead to additional dephasing and loss of signal intensity. Intracranial veins always have low signal intensity, suggesting that the BOLD effect dominates the appearance of these vessels. However at 8 T, intracranial arteries generally do not show the high signal intensity TOF effect usually observed at lower field strengths. Presumably, a combination of TOF enhancement, a decrease in the BOLD signal intensity, and dephasing effects render these vessels nearly isointense to the surrounding brain tissue. Even with a TE as short as 3 ms, TOF enhancements are limited, and only a few arteries are seen (12). The fact that superficial scalp vessels have intermediate signal intensity may suggest a different oxygenation level or different dephasing effects due to the flow velocity.
As the TE increased, the conspicuity of the vessels in the brain increased as well (Fig 2). This observation supports earlier research demonstrating an improvement in vascular contrast with the application of a longer TE (7). This increase in TE led to larger magnetic susceptibly effects, which formed parallel bands of high and low signal intensity around the vessels.
After embalming, nearly all of the small blood vessels in the brain that were visible as hypointense voids on the GE images of the unembalmed brain disappeared. This disappearance was due to the replacement of blood in the vessel lumina with formalin (Fig 1). Because of the presence of the formalin within and also surrounding their lumina, these vessels demonstrated high signal intensity that was barely distinguishable within the parenchyma and subarachnoid space of the brain. This observation further confirms the finding that the signal voids on GE images of the unembalmed postmortem brain were related to the paramagnetic properties of the blood constituents and that they were not due to some other property of the vessels themselves.
Conclusion
The results of this study demonstrate that 8-T MR imaging of the unembalmed postmortem human brain in situ can produce images similar to those acquired from the brain of a living subject at the same field strength. Much of the vasculature is better visualized on GE images of the unembalmed postmortem brain in situ than on GE images of the brain in vivo because of the universal presence of deoxyhemoglobin in the blood vessels of the recently deceased brain. Vessels are poorly visualized on images of the embalmed postmortem brain. This observation indicated that embalmed specimens are unsuitable for use in evaluating the microvasculature. Imaging the unembalmed postmortem brain by using GE pulse sequences may be suitable for future correlative studies aimed at distinguishing microscopic arteries from veins.
Acknowledgments
We thank Donald P. Kincaid, BS, LE, LFD, for preparing and embalming the cadaver used in this study. We also acknowledge Ryan D. Gilbert, BS, EET, for providing technical assistance in our experiments. In addition, we thank Chastity D. S. Whitaker, BS, for assisting in acquiring and processing the data used in this study.
References
- Received December 6, 2002.
- Accepted after revision March 31, 2003.
- Copyright © American Society of Neuroradiology
In this issue


Jump to section
Related Articles
Cited By...
- No citing articles found.