
Article Figures & Data
Figures
- Fig 1.
Example of the selection of postprocessing parameters (15). Dynamic CTP data are derived from 89 sequential contrast-enhanced CT images. A and B are magnified images selected from a series of sequential enhanced CT images performed during a dynamic CTP examination. An AIF is selected by placing a small circular region of interest (1–4 mm2) within the earliest appearing and most densely enhancing artery (usually one of the anterior or middle cerebral arteries). A depicts a small circular region of interest (circle, labeled “1”) placed within the A2 branch of the right anterior cerebral artery. A venous function is selected by placing a circular region of interest (2–8 mm2) within one of the dural venous sinuses. B depicts a small circular region of interest (circle labeled “2”) placed within the posterior third of the superior sagittal sinus/torcula region. The AIF and VF regions of interest define time (image number)–attenuation curves, which depict the time course of the dynamic enhancement of the artery and vein, respectively (C; ordinate: Hounsfield units; abscissa: image number). The AIF curve (labeled “1”) is of smaller amplitude and appears earlier than the VF curve (labeled “2”). The PrEI is defined as the interval from the first image to the image just preceding the upslope of the AIF curve. The vertical dashed line depicts the demarcation for the last image of the PrEI—images 1–13. The PoEI is defined as the first image after the AIF returns to baseline. The vertical dot-dashed line depicts the demarcation for the PoEI—image 58. The selection of the AIF, VF, PrEI, and PoEI represent the four decisions made by the analyst during the postprocessing of CTP data.
- Fig 2.
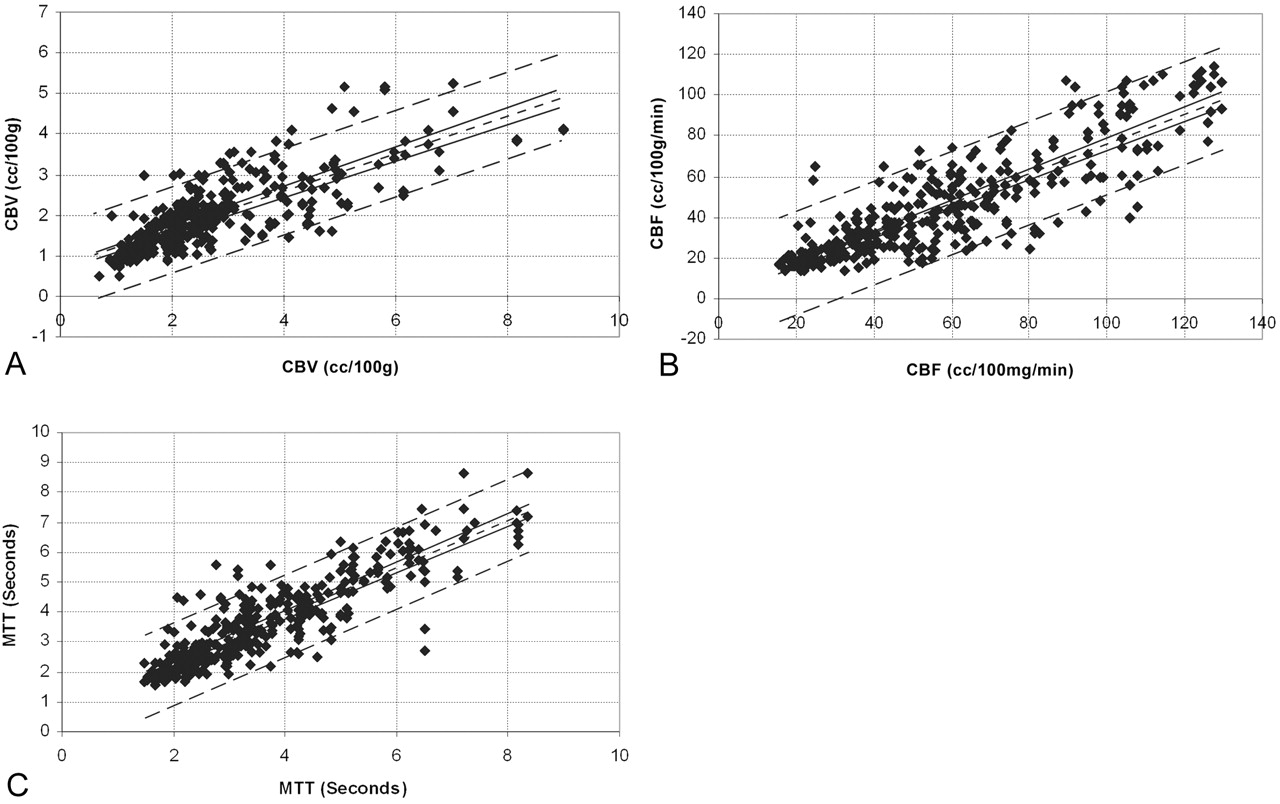
Intraobserver variability. Points composing the region of interest data sets generated by the same observers during different postprocessing trials were paired as ordinate and abscissa values (region of interest data sets 1 versus 4, 4 versus 7, 1 versus 7, 2 versus 5, and 3 versus 6) and graphed as a scatter plot. A simple regression analysis was then performed to fit the data points for (A) CBV (r = 0.77), (B) CBF (r = 0.89), and (C) MTT (r = 0.91). The best fit linear regression line (single short-dash line), 95% confidence intervals for the regression line (paired solid lines), and 95% confidence intervals for the data points (paired long-dash lines) are superimposed on the scatter plot.
- Fig 3.
Interobserver variability. Points composing the region of interest data sets generated by the different observers during the same trials were paired as ordinate and abscissa values (region of interest data sets 1 versus 2, 1 versus 3, 2 versus 3, 4 versus 5, 4 versus 6, 5 versus 6) and graphed as a scatter plot. A simple regression analysis was then performed to fit the data points for (A) CBV (r = 0.78), (B) CBF (r = 0.86), and (C) MTT (r = 0.88). The best fit linear regression line (single short-dash line), 95% confidence intervals for the regression line (solid lines), and 95% confidence intervals for the data points (paired long-dash lines) are superimposed on the scatter plot.
- Fig 4.
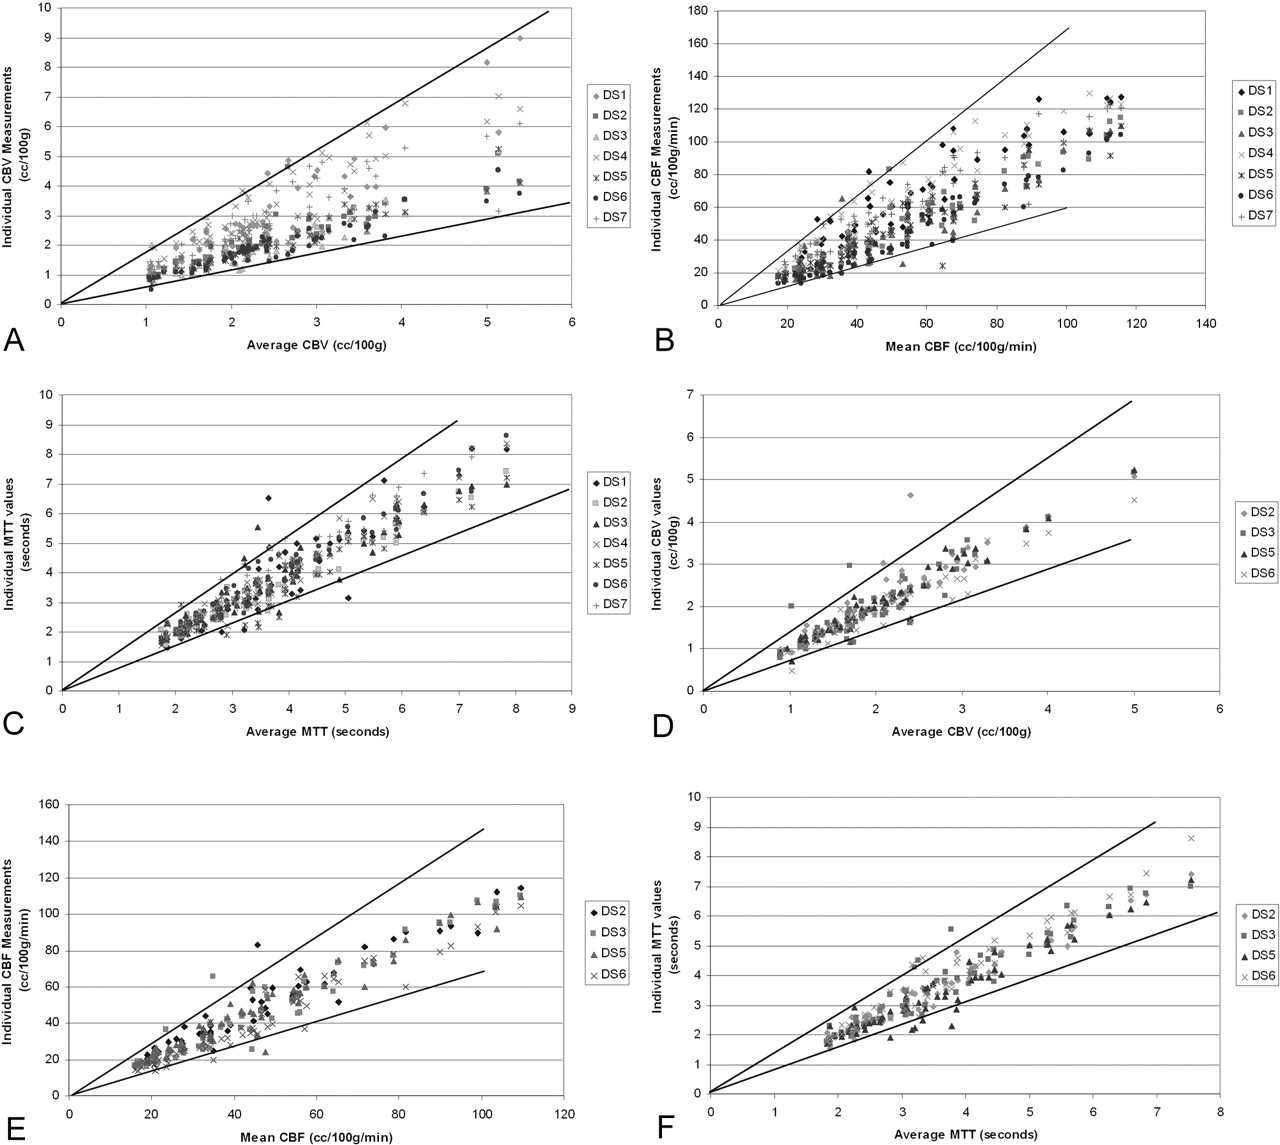
Distribution of the individual parenchymal region of interest values derived from (A) CBV, (B) CBF, and (C) MTT maps as a function of the average value for each corresponding parenchymal region of interest. Ninety-five percent confidence intervals (solid lines) are defined by the squares of the geometric standard deviations for the data sets. The confidence intervals define the range of measurements that would be expected for a given “true value.” If the data generated by CTT 1 are excluded from the analysis (see Results), the 95% confidence intervals are improved substantially for the (D) CBV and (E) CBF data, with little change in the variability of (F) MTT.
- Fig 5.
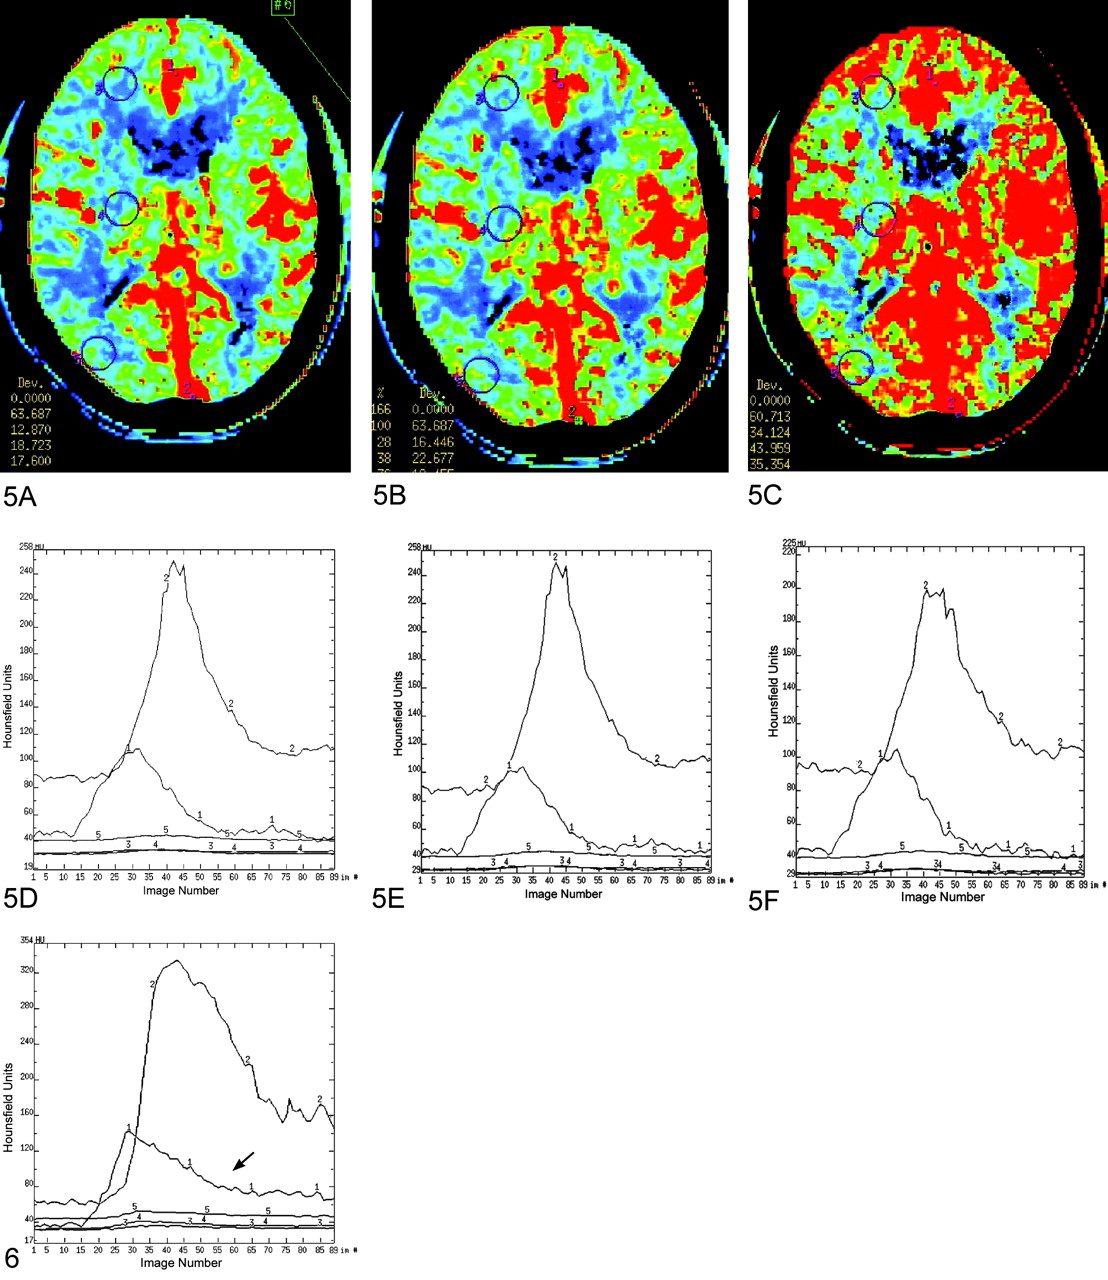
CBF maps generated from a single dynamic CTP data set by three different CTTs (A–C). Dynamic enhancement curves for the AIF (arrowheads) and VF generated by each technologist are depicted (D–F) below the corresponding CBF maps. The three larger circular regions of interest placed in identical locations on each map (frontal lobe white matter, deep gray matter, and temporal lobe mixed cortical-subcortical white matter) represent the prospectively designated parenchymal CBF region of interest measurements made by each technologist. Although these CBF maps were all generated from the same dynamic CTP data set, the results are qualitatively very different. All three maps demonstrate asymmetric CBF within the cerebral hemispheres, left greater than right. A, Map depicts focal regions of decreased CBF within the right posterior temporal lobe and right frontal lobe. B, Map demonstrates a similar region of decreased flow within the right frontal lobe, while the posterior temporal lobe CBF appears more normal (green > blue with some scattered foci or yellow-red). C, Map demonstrates normal (right hemisphere) and supranormal (left hemisphere) CBF without any foci of decreased CBF. The AIF and VF regions of interest were placed within the ACA and posterior third of the superior sagittal sinuses, respectively, by each of the technologists. The corresponding AIF curves (labeled “1”) generated by each technologist are essentially identical. The VF curve (labeled “2”) generated by the third observer (F) does not reach the amplitude of those of the other two observers (D, E). The PrEI chosen by the three technologists were 12, 14, and 11 for A, B, and C, respectively. The PoEI selections chosen by the three technologists were 57, 51, and 42, respectively for A, B, and C, respectively. Thus, while the selections of AIF region of interest, VIF region of interest, and PrEI were very homogeneous between technologists, the selection of the PoEI differed markedly. These data indicate that ambiguity with respect to the selection of the most appropriate PoEI represents a significant source of variability in the calculation of CBF maps.
Fig 6.
Ambiguity of postenhancement image selection. This dynamic enhancement curve (ordinate: Hounsfield units; abscissa: image number (1–89) provides an example of the ambiguity that is frequently involved in the selection of the most appropriate postenhancement image. The downslope of the AIF curve (arrow) is gradual and never completely returns to a baseline over the sequential 89 images. A large range of PoEI selections would be expected if this curve were submitted to multiple different technologists for postprocessing. It is also evident that different selections of the PoEI would result in the exclusion of a variable segment of the downslope of the VF time-attenuation curve from the analysis. The exclusion of segments of the VF time-attenuation curve will result in significant variation in the measured values of CBV and CBF, with larger values calculated when larger segments of the VF curve are excluded from the analysis.


Tables
CT Technologist 1 CT Technologist 2 CT Technologist 3 Trial 1 ROI Data Set 1 ROI Data Set 2 ROI Data Set 3 Trial 2 ROI Data Set 4 ROI Data Set 5 ROI Data Set 6 Trial 3 ROI Data Set 7 N/A N/A Note—The experiment was composed of three trials of postprocessing. All three technologists participated in the first two trials. Each technologist generated a data set derived from the placement of three predetermined identical circular ROIs on the CBV, CBF, and MTT maps generated by postprocessing the raw dynamic CTP data from the examinations of the same 20 patients (60 points per ROI data set). During the third trial, CT technologist 1 postprocessed the 20 patient data set a third time.
A: Cerebral Blood Volume ROIs ROI Data Set 1 ROI Data Set 2 ROI Data Set 3 ROI Data Set 4 ROI Data Set 5 ROI Data Set 6 ROI Data Set 7 ROI Data Set 1 1 – – – – – – ROI Data Set 2 0.80 1 – – – – – ROI Data Set 3 0.77 0.80 1 – – – – ROI Data Set 4 0.68 0.79 0.78 1 – – – ROI Data Set 5 0.78 0.87 0.88 0.88 1 – – ROI Data Set 6 0.76 0.85 0.86 0.87 0.96 1 – ROI Data Set 7 0.68 0.71 0.67 0.84 0.76 0.79 1 B: Cerebral Blood Flow ROIs ROI Data Set 1 ROI Data Set 2 ROI Data Set 3 ROI Data Set 4 ROI Data Set 5 ROI Data Set 6 ROI Data Set 7 ROI Data Set 1 1 – – – – – – ROI Data Set 2 0.89 1 – – – – – ROI Data Set 3 0.85 0.88 1 – – – – ROI Data Set 4 0.83 0.86 0.86 1 – – – ROI Data Set 5 0.83 0.92 0.92 0.91 1 – – ROI Data Set 6 0.91 0.93 0.92 0.89 0.91 1 – ROI Data Set 7 0.91 0.87 0.84 0.89 0.86 0.93 1 C: Mean Transit Time ROIs ROI Data Set 1 ROI Data Set 2 ROI Data Set 3 ROI Data Set 4 ROI Data Set 5 ROI Data Set 6 ROI Data Set 7 ROI Data Set 1 1 – – – – – – ROI Data Set 2 0.86 1 – – – – – ROI Data Set 3 0.82 0.92 1 – – – – ROI Data Set 4 0.90 0.93 0.90 1 – – – ROI Data Set 5 0.85 0.92 0.89 0.93 1 – – ROI Data Set 6 0.90 0.97 0.89 0.95 0.92 1 – ROI Data Set 7 0.88 0.95 0.91 0.97 0.93 0.95 1 - TABLE 3:
A. GEOSTD2 from Interobserver, Intraobserver, and Pooled Data Sets. CBV CBF MTT Interobserver Trial 1 (DS1 v 2 v 3) 1.66 1.68 1.35 Trial 2 (DS4 v 5 v 6) 1.84 1.80 1.31 Average 1.75 1.75 1.34 Intraobserver CTT1 (DS1 v 4 v 7) 1.56 1.46 1.30 CTT2 (DS2 v 5) 1.29 1.34 1.30 CTT3 (DS3 v 6) 1.47 1.48 1.30 Average 1.58 1.43 1.30 Pooled (DS1–7) 1.72 1.68 1.31 B. GEOSTD2 derived from inter-observer, intra-observer and pooled data sets for CTT2 and CTT3. CBV CBF MTT Interobserver Trial 1 (DS2 v 3) 1.46 1.52 1.26 Trial 2 (DS5 v 6) 1.22 1.48 1.36 Average 1.35 1.50 1.31 Intraobserver Average 1.39 1.41 1.30 Pooled (DS2,3,5,6) 1.38 1.46 1.30 Note.—The “average” GEOSTD2 values for inter- and intra-observer data sets were calculated from the mean of the variances of the transformed data. The squares of the geometric standard deviations can be used to calculate the range of measurements which may be expected about any given “true value”. This range can be calculated by dividing and multiplying any given “true value” by the GEOSTD2 (see Results section for example).
In this issue


Jump to section
Related Articles
Cited By...
- Can Iterative Reconstruction Improve Imaging Quality for Lower Radiation CT Perfusion? Initial Experience
- Future directions in IAT: better studies, better selection, better timing and better techniques
- Imaging-based selection for intra-arterial stroke therapies
- The Massachusetts General Hospital acute stroke imaging algorithm: an experience and evidence based approach
- Differences in CT Perfusion Summary Maps for Patients with Acute Ischemic Stroke Generated by 2 Software Packages
- Malignant CTA Collateral Profile Is Highly Specific for Large Admission DWI Infarct Core and Poor Outcome in Acute Stroke
- Short- and Long-Term Hemodynamic and Clinical Effects of Carotid Artery Stenting
- Stroke and CT Perfusion
- Recommendations for Imaging of Acute Ischemic Stroke: A Scientific Statement From the American Heart Association
- C-Arm CT Measurement of Cerebral Blood Volume: An Experimental Study in Canines
- Theoretic Basis and Technical Implementations of CT Perfusion in Acute Ischemic Stroke, Part 2: Technical Implementations
- Reproducibility of Quantitative CT Brain Perfusion Measurements in Patients with Symptomatic Unilateral Carotid Artery Stenosis