
Abstract
BACKGROUND AND PURPOSE: Different TE can be used for obtaining MR spectra of brain tumors. The purpose of this study was to determine the influence of the TE used in brain tumor classification by comparing the performance of spectra obtained at two different TE (30 ms and 136 ms).
METHODS: One hundred fifty-one studies of patients with brain tumors (37 meningiomas, 12 low grade astrocytomas, 16 anaplastic astrocytomas, 54 glioblastomas, and 32 metastases) were retrospectively selected from a series of 378 consecutive examinations of brain masses. Single voxel proton MR spectroscopy at TE 30 ms and 136 ms was performed with point-resolved spectroscopy in all cases. Fitted areas of nine resonances of interest were normalized to water. Tumors were classified into four groups (meningioma, low grade astrocytoma, anaplastic astrocytoma, and glioblastoma-metastases) by means of linear discriminant analysis. The performance of linear discriminant analysis at each TE was assessed by using the leave-one-out method.
RESULTS: Tumor classification was slightly better at short TE (123 [81%] of 151 cases correctly classified) than at long TE (118 [78%] of 151 cases correctly classified). Meningioma was the only group that showed higher sensitivity and specificity at long TE. Improved results were obtained when both TE were considered simultaneously: the suggested diagnosis was correct in 105 (94%) of 112 cases when both TE agreed, whereas the correct diagnosis was suggested by at least one TE in 136 (90%) of 151 cases.
CONCLUSION: Short TE provides slightly better tumor classification, and results improve when both TE are considered simultaneously. Meningioma was the only tumor group in which long TE performed better than short TE.
Proton MR Spectroscopy (1H MR spectroscopy) is a noninvasive technique that is acquiring an important role in the diagnosis of brain tumors before surgery (1–11). This technique provides metabolic information regarding the tissue being studied that complements the anatomic information obtained with MR imaging. Different parameters may be varied to optimize 1H MR spectroscopy data acquisition. These parameters determine not only the appearance of the spectrum but also the information that can be extracted from it. One of the most relevant is TE. At present, TE used in in vivo 1H MR spectroscopy by most groups range between 18 and 288. In this respect, spectra are divided into short and long TE, ranging most short TE between 18 and 45 and long TE between 120 and 288. Different criteria have been argued in favor and against every option. A compromise solution used by some groups has been to acquire both short and long TE spectra from the same patient (12–15). However, this is not always possible, and a decision for one of the two options may be necessary. For example, the patient’s condition may not be stable enough in some cases to undergo both acquisitions. In this case, the sequence providing the most relevant information should be acquired first. Multi-voxel sequences are more time-consuming, and two TE cannot routinely be used. We have not found any study that compares short and long TE spectra in terms of accuracy in clinical classification of brain tumors. Therefore, our purpose was to assess which TE, short or long, could provide better classification of brain tumors in a relatively large sample of the most common brain tumors found in clinical practice.
Methods
Patients
We retrospectively reviewed 378 consecutive spectroscopic examinations performed between February 1998 and February 2003 in 378 patients with brain masses suggesting brain tumors. Inclusion criteria for this study were definitive diagnosis confidently established, diagnosis of one of five tumor types included in the study (meningioma, low grade astrocytoma, anaplastic astrocytoma, glioblastoma, and metastases), four available required spectra (short and long TE for both water and metabolites), and spectra of quality at visual inspection. The diagnosis was considered to be confidently established when a sample of the tumor could be histologically evaluated after the MR spectroscopy study and the pathologist could establish a single diagnosis. In 16 cases, metastases were present in patients with known primary cancer in which other brain masses were revealed by MR imaging. The diagnosis was considered to be confident enough, and these cases were admitted into the study. Seventy-four cases were excluded from the study because a definitive diagnosis could not be confidently established. Seventy-three additional cases were excluded because the diagnosis was other than the five tumor groups included in the study. Because of the preprocessing method used in the study, it was considered necessary to have available spectra in both short and long TE for water and metabolites. Twenty five cases were excluded from the study because the four spectra were not available. Fifty-five spectra were considered to be of “bad” quality, and the cases were accordingly excluded from the study (37 spectra because it was not possible to confidently define resonances in the spectrum and 18 spectra because artifact precluded precise quantification of some of the resonances of interest). One hundred fifty-one cases fulfilled the inclusion criteria and were included in the study (76 male and 75 female patients; age range, 14–81 years; mean age, 57 years). The types of tumors included were 37 meningiomas, 12 low grade astrocytomas, 16 anaplastic astrocytomas, 54 glioblastomas, and 32 metastases. This retrospective study was included in a research project approved by our institutional review board, and informed consent was obtained from all patients.
1H MR Spectroscopy
Single voxel point-resolved 1H MR spectroscopy was performed on a 1.5-T MR imaging unit (ACS-NT, Philips Medical Systems, Best, The Netherlands) after the conventional MR imaging examination by using a standard receiver head coil in all cases. The volume of interest for acquiring 1H MR spectroscopy was chosen by one of three authors (C.M., M.S., or C.Ag.) based on criteria previously approved for performing 1H MR spectroscopy of brain tumors at our institution. These criteria were to include the largest possible voxel within the solid tumoral area, as judged by inspection of the full unenhanced and contrast-enhanced MR imaging examination, avoiding areas of cysts or necrosis and with minimum contamination from the surrounding non-tumoral tissue. Volume of interest size ranged between 1.5 × 1.5 × 1.5 cm3 (3.4 mL) and 2 × 2 × 2 cm3 (8 mL), depending on tumor dimensions. The aim was to obtain an average spectroscopic representation of the largest possible part of the tumor while avoiding contamination of the sample by extra-tumoral tissue. Four proton MR spectra were acquired from the same volume of interest for every case: 1) water-suppressed spin-echo short TE (2000/30/92–184) (TR/TE/averages); 2) water-suppressed spin-echo long TE (2000/136/126–252); 3) unsuppressed water spin-echo long TE (2000/136/16); and 4) unsuppressed water spin-echo short TE (2000/30/16). A total of 512 data points were collected over a spectral width of 1000 Hz. Spectrum analysis was performed off-line with the use of MRUI software (available through the MRUI Project, www.carbon.uab.es/mrui) (16). Fitted areas of the resonances of interest were calculated in the water-suppressed spectrum with the AMARES quantitation algorithm (17). Resonance areas were normalized by dividing each value by the fitted water area value in the corresponding unsuppressed water spectrum.
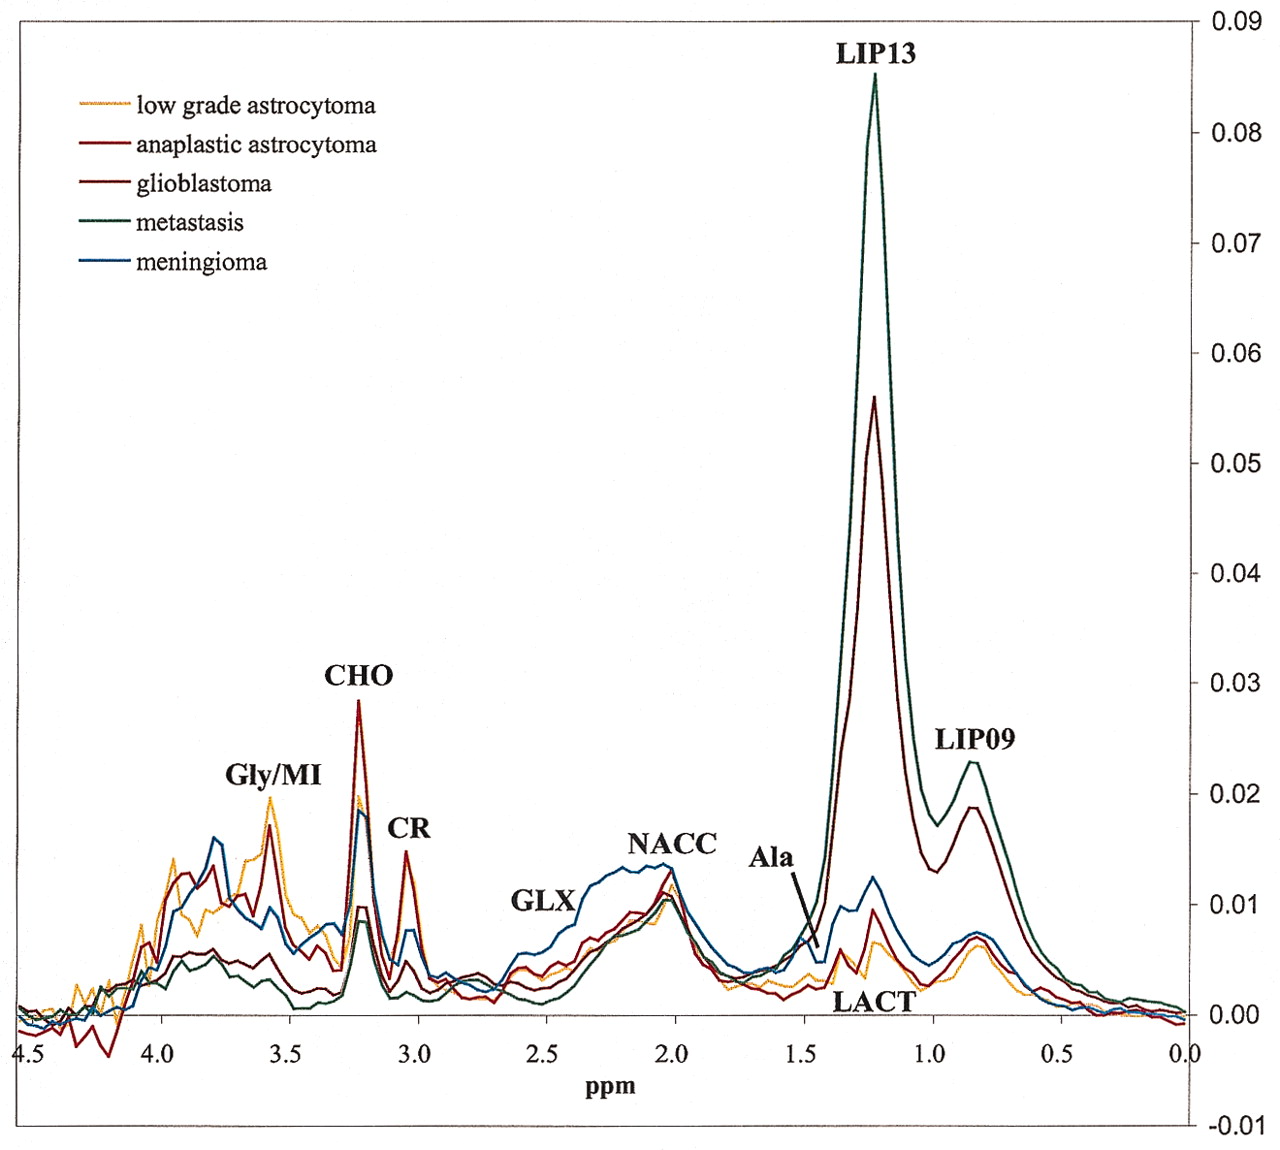
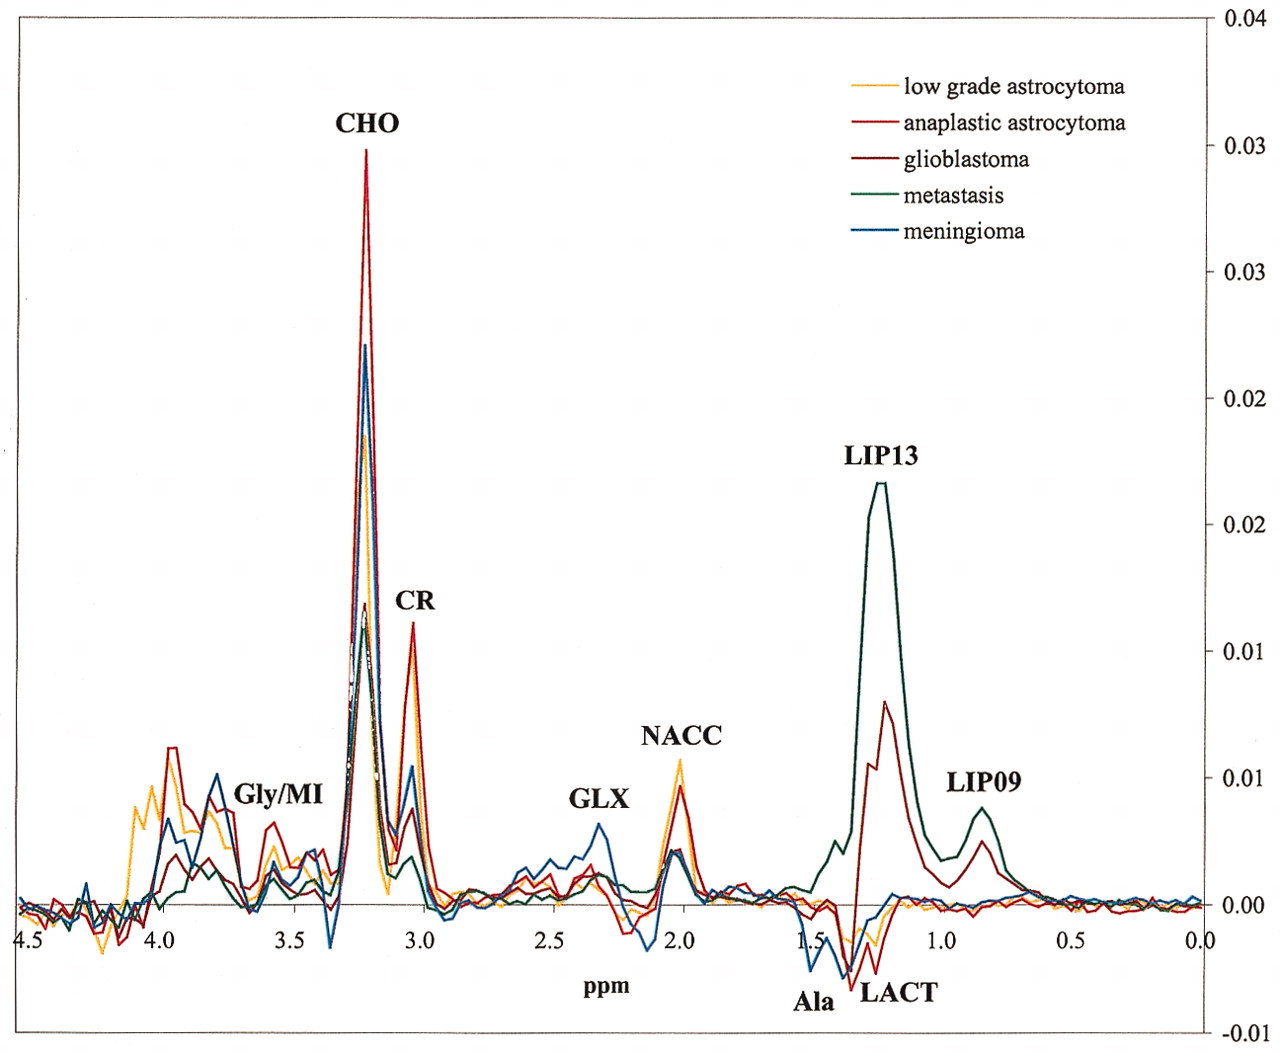
Assignment of the resonances of interest included lipids (LIP09) at 0.90 ppm, lipids (LIP13) at 1.30 ppm, lactate (LACT) as a doublet centered at 1.35 ppm, alanine (Ala) as a doublet centered at 1.47 ppm, N-acetylaspartate and other N-acetyl-containing compounds (NACC) at 2.02 ppm, glutamate and glutamine (GLX) at 2.35 ppm, creatine plus phosphocreatine (CR) at 3.03 ppm, choline and other trimethylamine-containing compounds (CHO) at 3.20 ppm, and glycine or myo-inositol (Gly/MI) at 3.55 ppm. The assignment of resonances was based on previous documented studies of brain tumors (1–4, 18–20) and phantom studies (12, 18). Resonance peaks were defined for MRUI fitting even when there could be doubts about their differentiation from noise. We hope that further quantification and analysis will find differences between noise and metabolite signal intensity free of operator influence. This procedure has been previously used to try to avoid operator bias (19).
Statistics
The goal of the current study was to determine which TE (short or long) produced better results in brain tumor classification. Four tumor groups were considered: meningiomas, low grade astrocytomas, anaplastic astrocytomas, and glioblastomas-metastases. Glioblastomas and metastases were combined into a single group because results from previous studies (1, 5, 21) have shown that a reliable separation between them cannot be confidently achieved with single voxel 1H MR spectroscopy alone. However, differences between glioblastomas and metastases in this study, both at long and short TE, were tested with the Mann-Whitney U nonparametric test.
All procedures for analysis of tumor characteristics and tumor classification were performed twice, once for each TE. Differences between tumor groups were assessed by means of nonparametric statistical tests. First, the Kruskal-Wallis test for multiple samples was used to assess the differences among the four tumor groups in the nine selected resonances. Comparisons among pairs of groups were done by means of the Mann-Whitney U test for two independent samples. Because multiple procedures were performed in every statistical test, we corrected the obtained P values for multiple comparisons by using the Bonferroni method. Significant differences were defined by using the corrected P values (P*) instead of the original P values. Differences of P* < .05 were considered to be statistically significant for all statistic tests.
Tumor classification on the basis of the spectroscopic findings was conducted by using linear discriminant analysis. Only resonances showing differences in the Kruskal-Wallis test were used as inputs for linear discriminant analysis. We assessed the capability of linear discriminant analysis at both TE (short and long), to separate the whole tumor data set into four groups by using the leave-one-out method. With the leave-one-out method, linear discriminant analysis is conducted as many times as there are cases in the data set, each time including all cases except one. The case that is left out is used for testing the classifier elaborated (22). Classification accuracy was defined as the ratio between the number of cases correctly classified and the total number of cases in the set. The McNemar test was used to assess differences in the performance of the two TE. Performance of the combination of two TE was evaluated with the χ2 test by comparing the accuracy obtained at each TE individually with the accuracy obtained in the predictions when both TE agreed. All the statistical computations were performed by using SPSS 10.0 software (SPSS Inc., Chicago, IL).
Results
Mean spectra for each tumor type and TE are shown in Figures 1 and 2. No statistical differences were found between glioblastomas and metastases in any of the resonances evaluated in the study for either of the two TE under consideration. Accordingly, we proceeded with the decision of combining glioblastomas and metastases into a single glioblastomas-metastases group for classification purposes.

Mean spectra at short TE (TE = 30) of the five tumor types included in the study.

Mean spectra at long TE (TE = 136) of the five tumor types included in the study.
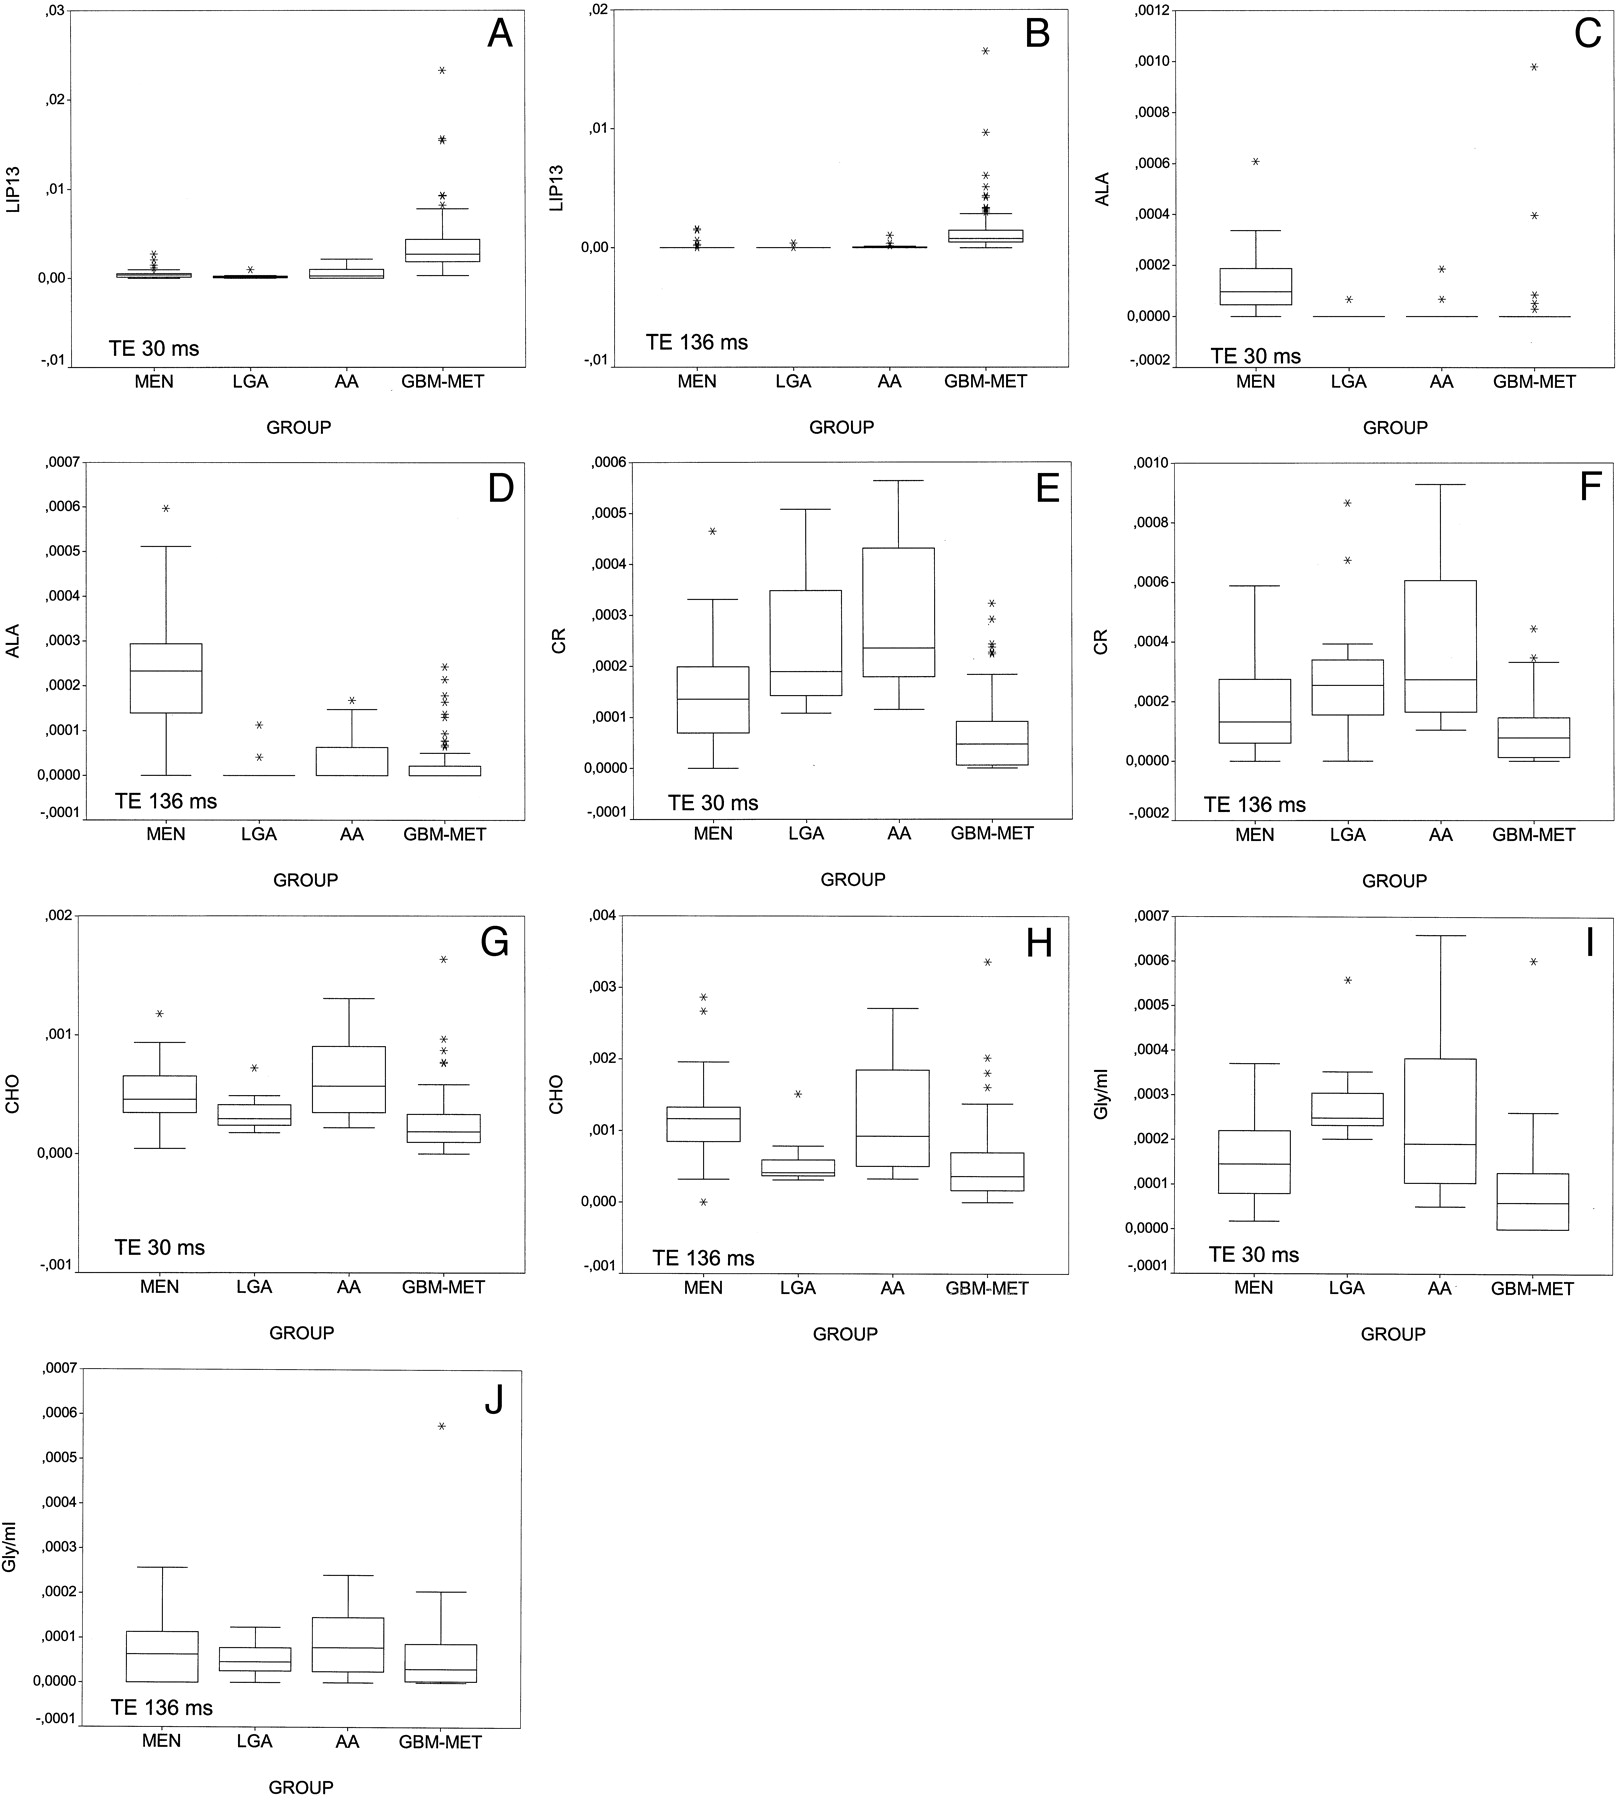
Box plots for each fitted area resonance and TE were created. Some relevant aspects derived from the analysis of the box plots were as follows: 1) LIP13 separated glioblastomas-metastases from the remainder of the groups (Fig 3A and B); 2) Ala separated meningiomas from the remainder of the groups (Fig 3C and D); 3) CR separated glioblastomas-metastases from other groups, with some overlap with meningiomas (Fig 3E and F); 4) CHO provided some differentiation between low grade astrocytomas and anaplastic astrocytomas and between meningiomas and glioblastomas-metastases (Fig 3G and H); and 5) large differences between short and long TE were shown with respect to Gly/MI (Fig 3I and J). This resonance separated low grade astrocytomas from meningiomas and low grade astrocytomas from glioblastomas-metastases at short TE, but no separation was found at long TE.

Box plots show the distribution of some relevant resonances. The horizontal line is the median, the ends of the boxes are the upper and lower quartiles, and the vertical lines show the full range of values in the data. The extreme points (*) are outliers.
A, LIP13 at short TE.
B, LIP13 at long TE.
C, Ala at short TE.
D, Ala at long TE.
E, CR at short TE.
F, CR at long TE.
G, CHO at short TE.
H, CHO at long TE.
I, Gly/MI at short TE.
J, Gly/MI at long TE.
The assessment of the differences among the four tumor groups by the Kruskal-Wallis test showed significant differences in seven resonances at short TE (LIP09, LIP13, Ala, GLX, CR, CHO, and Gly/MI) and eight at long TE (LIP09, LIP13, LACT, Ala, NACC, GLX, CR, and CHO). The analysis of the differences between pairs of tumor groups (Tables 1 and 2) showed slightly higher differences at short TE than at long TE. None of the resonances showed significant differences between low grade astrocytomas and anaplastic astrocytomas, neither at long nor at short TE. All the remaining bilateral comparisons showed significant differences in at least two resonances.
Analysis of significant differences between tumor groups at TE 30
Analysis of significant differences between tumor groups at TE 136
Tumor classification by means of linear discriminant analysis is shown in Table 3 and Figure 4. Results were better at short TE (accuracy, 123 [81%] of 151 cases) than at long TE (accuracy, 118 [78%] of 151 cases). No statistical significance was found by using the McNemar test for the following comparisons: 1) number of correct predictions with short TE versus long TE; and 2) number of correct predictions at short TE versus long TE for each specific tumor type (e.g., meningiomas, low grade astrocytomas, anaplastic astrocytomas, and glioblastomas-metastases). Meningiomas was the only group in which sensitivity and specificity of diagnosis was better at long TE (sensitivity, 32 [86%] of 37 cases; specificity, 111 [97%] of 114 cases) than at short TE (sensitivity, 31 [84%] of 37 cases; specificity, 108 [95%] of 114 cases). The remainder of the groups showed better results at short TE. The analysis of the cross table (Table 3) showed the following: 1) that a correct diagnosis was suggested in 105 (94%) of 112 cases when both TE agreed in the classification (this accuracy value proved to be significantly higher than the accuracy at either short or long TE in the χ2 test [P < .01 for both]); 2) that no misclassification occurred when both TE agreed in meningioma; 3) that in 136 (90%) of 151 cases, the correct diagnosis was suggested by at least one TE; and 4) that the groups showing a larger relative misclassification were low grade astrocytomas and anaplastic astrocytomas. At long TE, five anaplastic astrocytomas were classified as low grade astrocytomas and one low grade astrocytoma was classified as anaplastic astrocytomas. At short TE, five anaplastic astrocytomas were classified as low grade astrocytomas and three low grade astrocytomas were classified as anaplastic astrocytomas.

Scatter plots show the distribution of the complete set of cases at short TE (A) and long TE (B) by using the two first discriminant functions obtained for linear discriminant analysis (x axis, value obtained with the first discriminant function; y axis, value obtained with the second discriminant function). Open circle indicates meningiomas; open square, low-grade astrocytomas; open diamond, anaplastic astrocytomas; open triangle, glioblastomas-metastases. The large black symbols show the centroid for every tumor group. With this method, new cases with unknown diagnosis are classified according to their distance to the centroids.
Results of brain tumor classification by two TE (30 and 136) into four groups with linear discriminant analysis, evaluated with the leave-one-out method (in parenthesis are shown the tumors of each group according to the definitive diagnosis)
Discussion
At present, the optimal pulse sequence parameters when using 1H MR spectroscopy for characterizing tumors are controversial. One of the parameters that can largely influence the spectrum is TE. A long TE allows the observation of a reduced number of metabolites and has less baseline distortion, yielding a spectrum that is easy to process, analyze, and interpret. At approximately 136 TE, Ala and LACT doublets are inverted because of J-coupling, making it easier to differentiate these resonances from lipids and other macromolecules. On the other hand, more resonances are visible at short TE because the signal intensity from compounds with strong J-modulation may be lost at long TE. Accordingly, a short TE is required for better evaluation of some particular compounds (e.g., lipids, myo-inositol, glutamine, and glutamate). Moreover, TE affects not only the appearance of the peaks but also their intensity, depending on the differing T2 relaxation of metabolites (23–26). In this study, we tested the influence of TE in the classification of the most common tumor types found in the human brain.
Various methods have been suggested for classification of spectra into groups. We used linear discriminant analysis, a technique that has been widely used in spectroscopy for pattern recognition (1, 6, 7, 21). Once the classification strategy has been devised, two main methods can be used to validate the results: 1) to produce the classifiers with a set of cases called the training set and to reserve a sample of tumors (called the test set) not used for classifier development to test the system, and 2) to use the leave-one-out method, using all cases in the set (22). When only a limited number of cases are available, the leave-one-out method could be preferable (1, 6, 7). With the leave-one-out method, no previous splitting of cases into training and test sets is involved. The main advantage of this is that it avoids the negative impact that an outlier could have over a small sized test set. We chose to use the leave-one-out method because the size of the low grade astrocytomas and anaplastic astrocytomas groups was small. In so doing, we accepted a lower capability to extrapolate our results to yet unknown data sets to obtain more consistent comparative values in our present data set.
We found a small advantage in using short TE over long TE spectra in classifying tumors into four groups (classification accuracy at short TE, 123 [81%] of 151 cases; classification accuracy at long TE, 118 [78%] of 151 cases). The advantage was reproduced when the performance of the individual groups in terms of sensitivity and specificity was assessed. These results suggest that the signal intensity loss effect due to T2 relaxation or J-modulation may be of greater effect in the classification of brain tumors than the advantages argued in favor of long TE. The only exception was the meningiomas group, for which long TE spectra produced slightly better results, probably partly because of better identification of Ala. A rationale for our results might be found in the somewhat larger discrimination between groups with lipids, CR and CHO, at short TE. The Gly/MI resonance at 3.55 ppm could also explain part of the superiority in using short TE 1H MR spectroscopy. The differences found in the box plots as well as in the statistical analysis probably indicate a more significant role of myo-inositol (better evaluated at short TE) (12, 27) than glycine in brain tumor discrimination. In agreement with previous studies (28), we found that Gly/MI at short TE provided some separation between low grade astrocytomas and anaplastic astrocytomas and showed significant differences between tumor groups, which are difficult to differentiate (low grade astrocytomas versus glioblastomas-metastases; anaplastic astrocytomas versus glioblastomas-metastases). The tumor groups showing the worst results were low grade astrocytomas and anaplastic astrocytomas, with a large ratio of misclassification between them. Several reasons may account for this: 1) no differences were found between these two groups at both TE; 2) these were the groups represented by the lowest number of cases; 3) some misclassifications could be due to the inherent inaccuracies in the criterion standard used for establishing the final diagnostic, as histopathologic results have shown some overlap between the diagnosis of low grade astrocytomas, anaplastic astrocytomas, and glioblastomas (29); and 4) a further limitation of the technique could be that MR spectroscopy evaluates the whole sample of tissue included in the volume of interest, providing the mean spectrum for it. A small focus of high grade could be hidden by a major contribution from a low grade tumor. This could explain why misclassifications assigning anaplastic astrocytomas into the low grade astrocytomas group were more common than the reverse.
Significant differences between both TE in the classification procedures were not found in the McNemar test, partly because of the low number of some subgroups (12 low grade astrocytomas, 16 anaplastic astrocytomas). A definitive conclusion regarding the TE to be used cannot be suggested because of the lack of statistical significance. Accordingly, we consider that there is still a role for aspects such as previous expertise of the user, particular technical aspects of the MR imaging unit, and diagnosis envisaged by MR imaging evaluation, in the choice of the TE to be used. Results significantly improved when both TE were considered simultaneously. Short and long TE agreed in a single group in 112 cases, and in 105 of such cases, the diagnosis suggested was correct (accuracy, 105 [94%] of 112 cases, which is significantly higher than the accuracy obtained with either short or long TE [P < .01]). On the other hand, the correct diagnosis was suggested by at least one of the two TE in 136 (90%) of 151 cases. Therefore, the evaluation of both TE will improve the level of certainty in some particular situations, either to accept a diagnosis (if both TE agree) or to exclude it (when neither of them suggest the excluded diagnosis).
Our study has several potential limitations. One possible concern is that in 16 metastases, the diagnosis was made without histologic examination. However, we consider that the influence that this limitation could have in the diagnostic accuracy, if any, should be similar at both TE and would not invalidate the results obtained in this study. A second potential limitation is that we have evaluated only the influence of two TE, under very specific feature extraction and classification methods. The results may vary at different TE, with other feature extraction methods or classifying the tumors with other methods, and accordingly, their reproducibility can be taken for granted only under these experimental conditions. A third potential problem could be caused by the use of relatively large volume of interest because of the single voxel technique chosen. Smaller volume of interest can be properly assessed with multi-voxel techniques, providing better evaluation of tumor heterogeneity (30). In any case, the experience acquired with the analysis of single voxel 1H MR spectroscopy in this study can also be exploited for multi-voxel examinations. A further limitation is that the differences were slight, and no statistical significance was found with the test used. Accordingly, our results cannot support a suggestion of excluding long TE 1H MR spectroscopy in the study of brain tumors, mainly taking into account the superiority of long TE over short TE in meningiomas and that considering both TE provides improved results.
Conclusion
Our results suggest that short TE 1H MR spectroscopy (TE = 30 in this study) produces a slightly more accurate diagnostic outcome in general, whereas long TE (TE = 136) is preferable when meningioma is suspected. From a clinical point of view, our advice based on the results obtained would be to use short TE 1H MR spectroscopy when only one spectroscopic sequence can be acquired or as the first sequence when two TE are planned. Long TE would be of choice when conventional imaging suggests meningioma. However, acquiring spectra at two different TE would be advisable whenever possible.
Acknowledgments
We thank the Statistic Support Facility of Universitat Autònoma de Barcelona for technical advice on statistical data processing.
Footnotes
Supported in part by the Generalitat de Catalunya (grants CIRIT XT2002–48 and SGR2001–194), the Ministry of Science and Technology (grant MCYT SAF2002–0440), and the European Union (EC IST1999–10310, INTERPRET project, http://carbon.uab.es/INTERPRET).
References
- Received October 30, 2003.
- Accepted after revision February 29, 2004.
- Copyright © American Society of Neuroradiology
In this issue


Jump to section
Related Articles
Cited By...
- CT-2A neurospheres-derived high-grade glioma in mice: a new model to address tumor stem cells and immunosuppression
- Accuracy of magnetic resonance imaging texture analysis in differentiating low-grade from high-grade gliomas: systematic review and meta-analysis
- MR Studies of Glioblastoma Models Treated with Dual PI3K/mTOR Inhibitor and Temozolomide:Metabolic Changes Are Associated with Enhanced Survival