
We review the normal anatomy of the white matter (WM) tracts as they appear on directional diffusion tensor imaging (DTI) color maps, which will almost certainly be available to the general radiologist as part of a commercial DTI software package in the near future. Anatomic drawings and gross dissection photographs are correlated with the directional DTI color maps to review the anatomy of those tracts readily seen in most cases. We also include several correlative examples of so-called tractograms in which specific tracts are traced and displayed by using computer-graphical techniques (1). Since several excellent reviews focusing on tractography and other sophisticated DTI postprocessing techniques are already published (2–4), we focus on the directional eigenvector color maps. A brief review of the basic principles underlying DTI is also included; several more comprehensive reviews are available for the reader who wishes to delve deeper into the technical aspects of DTI (5, 6). Finally, we briefly review the DTI patterns that result when a cerebral neoplasm involves WM tracts; knowledge of these patterns becomes critically important when neurosurgeons use DTI in planning tumor resections, as they frequently do at our institution (7, 8).
The Physics of DTI
By applying the appropriate magnetic field gradients, MR imaging may be sensitized to the random, thermally driven motion (diffusion) of water molecules in the direction of the field gradient. Diffusion is anisotropic (directionally dependent) in WM fiber tracts, as axonal membranes and myelin sheaths present barriers to the motion of water molecules in directions not parallel to their own orientation. The direction of maximum diffusivity has been shown to coincide with the WM fiber tract orientation (9). This information is contained in the diffusion tensor, a mathematic model of diffusion in three-dimensional space. In general, a tensor is a rather abstract mathematic entity having specific properties that enable complex physical phenomena to be quantified. In the present context, the tensor is simply a matrix of numbers derived from diffusion measurements in several different directions, from which one can estimate the diffusivity in any arbitrary direction or determine the direction of maximum diffusivity.
The tensor matrix may be easily visualized as an ellipsoid whose diameter in any direction estimates the diffusivity in that direction and whose major principle axis is oriented in the direction of maximum diffusivity (Fig 1) (10). With use of DTI, both the degree of anisotropy and the local fiber direction can be mapped voxel by voxel, providing a new and unique opportunity for studying WM architecture in vivo.

Top left, Fiber tracts have an arbitrary orientation with respect to scanner geometry (x, y, z axes) and impose directional dependence (anisotropy) on diffusion measurements.
Top right, The three-dimensional diffusivity is modeled as an ellipsoid whose orientation is characterized by three eigenvectors (ϵ1, ϵ2, ϵ3) and whose shape is characterized three eigenvalues (λ1, λ2, λ3). The eigenvectors represent the major, medium, and minor priniciple axes of the ellipsoid, and the eigenvalues represent the diffusivities in these three directions, respectively.
Bottom, This ellipsoid model is fitted to a set of at least six noncollinear diffusion measurements by solving a set of matrix equations involving the diffusivities (ADC’s) and requiring a procedure known as matrix diagonalization. The major eigenvector (that eigenvector associated with the largest of the three eigenvalues) reflects the direction of maximum diffusivity, which, in turn, reflects the orientation of fiber tracts. Superscript T indicates the matrix transpose.
The tensor model of diffusion consists of a 3 × 3 matrix derived from diffusivity measurements in at least six noncollinear directions. The tensor matrix is diagonally symmetric (Dij = Dji) with six degrees of freedom (ie, only six of the tensor matrix’s nine entries are independent and so the matrix is fully determined by these six parameters), such that a minimum of six diffusion-encoded measurements are required to accurately describe the tensor. Using more than six encoding directions will improve the accuracy of the tensor measurement for any arbitrary orientation (11–13).
The tensor matrix is subjected to a linear algebraic procedure known as diagonalization, the result of which is a set of three eigenvectors representing the major, medium, and minor principle axes of the ellipsoid fitted to the data and the corresponding three eigenvalues (λ1, λ2, λ3), which represent the apparent diffusivities along these axes. (The word eigen is Germanic in origin, meaning “peculiar” or “special.” The term eigenvalue was used by British algebraists in the late 19th century to refer to a “characteristic value” of a matrix; specifically, a number k is called an eigenvalue of the matrix A if there exists a nonzero vector v such that Av = kv. In this case, the vector v is called an eigenvector of A corresponding to k [14].) This procedure may be thought of as a rotation of the x, y, and z coordinate system in which the data were acquired (dictated by scanner geometry) to a new coordinate system whose axes are dictated by the directional diffusivity information (Fig 1).
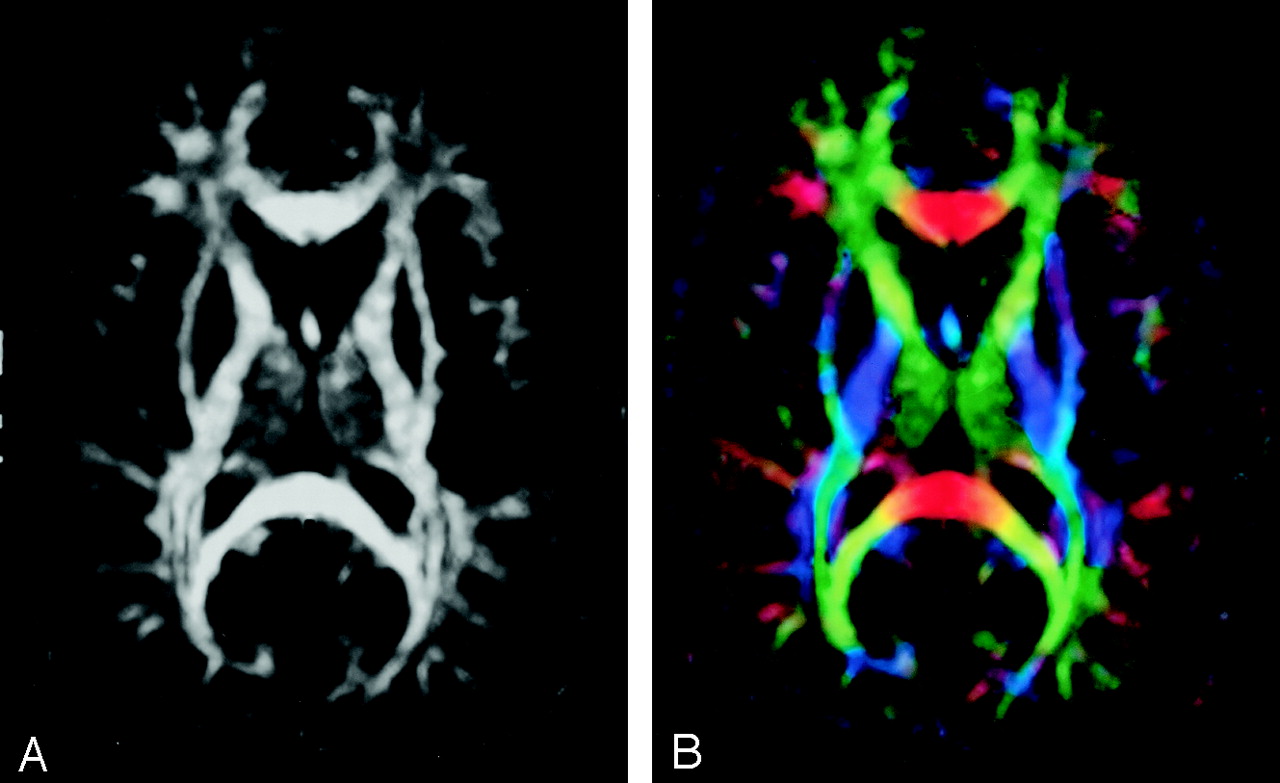
Diffusion anisotropy is easily understood as the extent to which the shape of the tensor ellipsoid deviates from that of a sphere; mathematically, this translates to the degree to which the three tensor eigenvalues differ from one another. Any of several anisotropy metrics may be used, one of the most common being fractional anisotropy (FA) (15), which derives from the standard deviation of the three eigenvalues and ranges from 0 (isotropy) to 1 (maximum anisotropy):  1 where λ̄ denotes the mean of the three eigenvalues, which is equal to the directionally averaged diffusivity. The direction of maximum diffusivity may be mapped by using red, green, and blue (RGB) color channels with color brightness modulated by FA, resulting in a convenient summary map from which the degree of anisotropy and the local fiber direction can be determined (Fig 2) (16).

A, FA map without directional information.
B, Combined FA and directional map. Color hue indicates direction as follows: red, left-right; green, anteroposterior; blue, superior-inferior. This convention applies to all the directional maps in this review. Brightness is proportional to FA.
Methods
DTI MR Acquisition and Directional Mapping
DTI MR images for this review were obtained with a 1.5-T system (GE Medical Systems, Milwaukee, WI) by using a quadrature birdcage head coil, single-shot echo planar imaging sequence (4500/71.8/4 [TR/TE/excitations], 240-mm field of view, 3-mm sections, 2 slabs, 20 sections per slab), matrix 128 × 128 zero-filled to 256 × 256, voxel size 1.87 × 1.87 × 3.0 mm interpolated to 0.94 mm isotropic, diffusion encoding in 23 directions (minimum energy optimization [12]) with b = 0, 1000 s/mm2, postprocessing with Automated Image Registration (17), a 3 × 3 in-plane spatial median filter, tensor decoding and diagonalization (12, 18). The choice of 23 directions represented a somewhat arbitrary balance between accuracy in fitting the tensor model (increasing the number of encoding directions decreases the variance in the tensor model parameters) and the number of sections that could be acquired (our imaging system limits the number of images per series to 512). The eigenvalues and eigenvectors of the diffusion tensor were used to calculate maps of the diffusion tensor trace, FA, and vector orientation maps, which were generated by mapping the major eigenvector directional components in x, y, and z into RGB color channels and weighting the color brightness by FA. The convention we used for directional RGB color mapping is red for left-right, green for anteroposterior, and blue for superior-inferior.
DTI Tractograms
The WM tracts were estimated with tractography by using the previously described tensor deflection (TEND) algorithm (19). Tracking was initiated from a start location (or seed point) in both forward and backward directions defined by the major eigenvector at the seed point. The propagation was terminated when the tract trajectory reached a voxel with FA less than 0.2 (the estimated major eigenvector direction becomes less accurate as FA decreases and becomes very sensitive to image noise for FA less than 0.2) or when the angle between two consecutive steps was greater than 45°.
A complete set of fiber trajectories was obtained by placing seeds in all the voxels with FA greater than 0.4 (the estimation of major eigenvector direction for voxels with FA greater than 0.4 is expected to be sufficiently accurate to yield a good estimate of local fiber direction). Estimates of white matter pathways were generated from the center of each seed voxel. A specific tract or fasciculus was separated from the complete set of trajectories by retaining those fibers that intersected predefined regions of interest (ROIs). The ROIs were chosen to enclose tract cross sections that were visible in any of the axial, sagittal, or coronal directional color maps (2, 19). Corpus callosum was selected by using the apparent tract cross section in the midsagittal plane. The anterior commissure was also selected by using an ROI placed in sagittal cross section; subsequently, only the branches that reached the temporal lobes were retained. The corticospinal tract was obtained by selecting the fibers emerging from the motor cortex and reaching the basis pedunculi. The tracts of the internal capsule were selected in an axial plane situated about halfway through the midbrain. The association fiber tracts were selected by using procedures similar to those described by Lazar et al (19).
Fiber trajectories are displayed with colors overlaid onto gray-scale anatomic images in various three-dimensional projections. Note that, unlike the directional color maps in which directional information is color-coded, individual tractograms are displayed by using fixed colors chosen arbitrarily.
Gross Dissections
Brain specimens were removed fresh at autopsy (before fixation) and were stored in a 10% formalin bath until final preparation for dissection. Brains that were not damaged in the area of the planned dissection were rinsed for 1 hour in room- temperature tap water and then were frozen in water in a −20°C freezer for 1 week. At the end of the week, the frozen brain was rinsed with lukewarm tap water until completely thawed (about 1 hour) and then refrozen in water for another week. This process was repeated such that the brain was rinsed and thawed 3 times in total. The entire preparatory process took 3 weeks before dissection could be performed. As many dissections could not be completed in a single sitting, the unfinished specimens were placed in 5% formalin until completed, and then stored in a 10% formalin solution when done.
Illustrations
Correlative line drawings of major tracts have been reproduced from A Functional Approach to Neuroanatomy (20) with permission from the publisher.
WM Fiber Classification
WM fiber tracts traditionally have been classified as follows: Association fibers interconnect cortical areas in each hemisphere. Fibers of this type typically identified on DTI color maps include cingulum, superior and inferior occipitofrontal fasciculi, uncinate fasciculus, superior longitudinal (arcuate) fasciculus, and inferior longitudinal (occipitotemporal) fasciculus. Projection fibers interconnect cortical areas with deep nuclei, brain stem, cerebellum, and spinal cord. There are both efferent (corticofugal) and afferent (corticopetal) projection fibers. Fibers of this type typically identified on DTI color maps include the corticospinal, corticobulbar, and corticopontine tracts, as well as the geniculocalcarine tracts (optic radiations). Commissural fibers interconnect similar cortical areas between opposite hemispheres. Fibers of this type typically identified on DTI color maps include corpus callosum and anterior commissure.
Other tracts that are occasionally, but not consistently, identified on directional DTI color maps include optic tract, fornix, tapetum, and many fibers of the brain stem and cerebellum. Space limitations preclude a comprehensive review of all tracts potentially visualized with DTI. Rather, we focus on the major tracts that are consistently identified in our practice.
Association Fibers
Cingulum (Figs 3, 4, and 5A).—

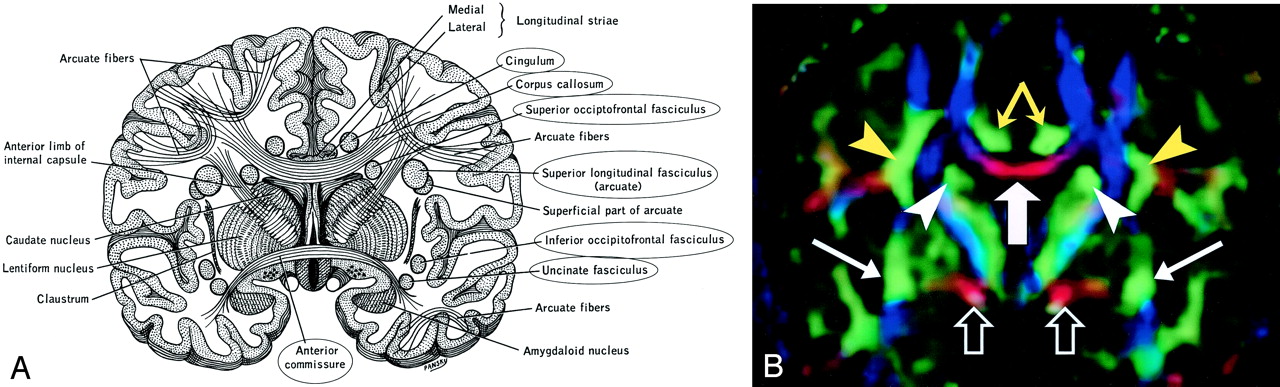
A, Illustration shows the anatomic relationships of several WM fiber tracts in the coronal plane. Circled tracts are those further illustrated in this review. The corpus callosum is “sandwiched” between the cingulum superomedially and the superior occipitofrontal fasciculus inferolaterally. The superior longitudinal fasciculus sweeps along the superior margin of the claustrum in a great arc. The inferior occipitofrontal fasciculus lies along the inferolateral edge of the claustrum. (Reproduced with permission from reference 20.)
B, Directional map corresponding to A. The paired cingula are easily identified in green (yellow arrows) just cephalad to the red corpus callosum (thick white arrow). White arrowheads indicate superior occipitofrontal fasciculus; thin white arrows, inferior occipitofrontal fasciculus; yellow arrowheads, superior longitudinal fasciculus. Like the corpus callosum, the commissural fibers of the anterior commissure are left-right oriented toward the midline, resulting in the characteristic red (open arrows) on this DTI map. Further lateral, the fibers diverge and mingle with other tracts; they are no longer identifiable with DTI, but can be traced with tractography.

Cingulum, sagittal view.
A, Illustration shows the cingulum arching over the corpus callosum.
B, Gross dissection, median view.
C, Directional map. Because DTI reflects tract orientation voxel by voxel, the color changes from green to blue as the cingulum (arrows) arches around the genu and splenium (arrowheads). Green indicates anteroposterior; red, left-right; blue, superior-inferior.
D, Tractogram. (See also Fig 5A, axial directional map.)

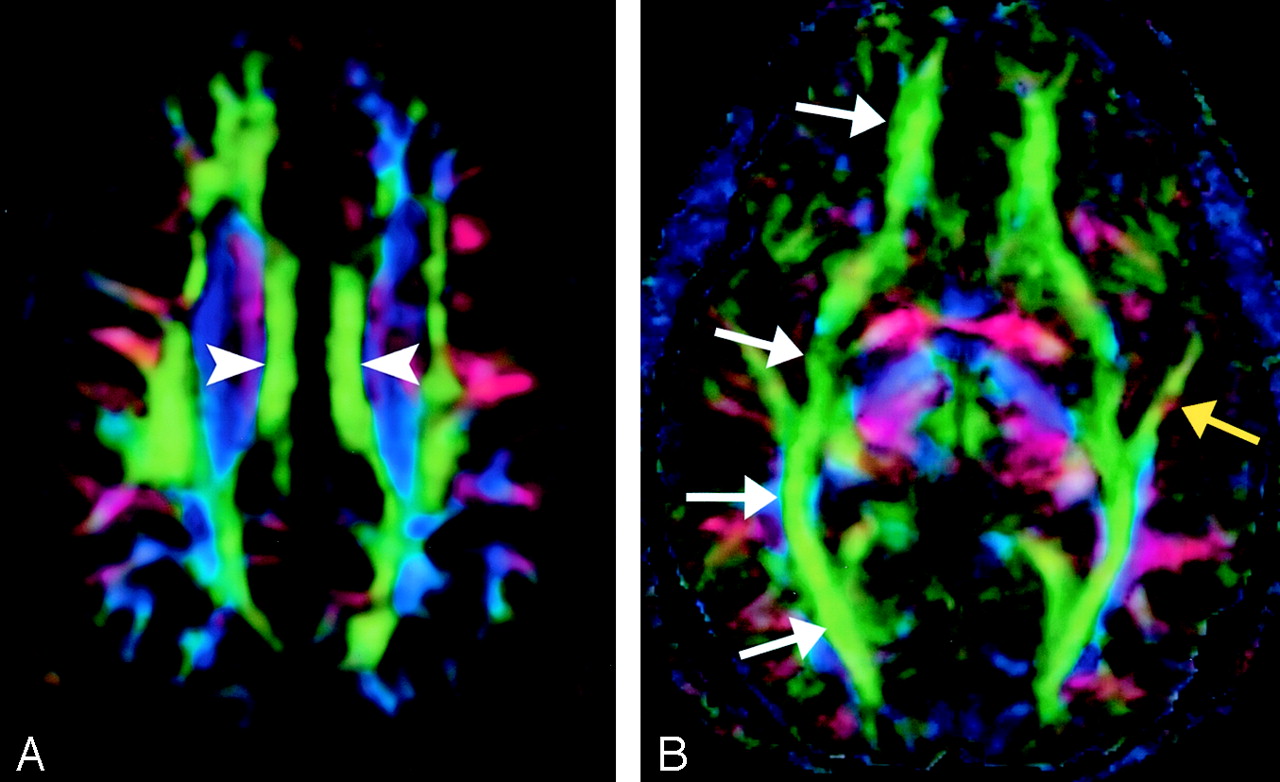
A, Cingulum, axial directional map. The paired cingula (arrowheads) are easily identified in green on this section obtained just cephalad to the corpus callosum.
B, Inferior occipitofrontal fasciculus (white arrows) and inferior longitudinal fasciculus (yellow arrow), axial directional map. The inferior occipitofrontal fasciculus lies in a roughly axial plane and is easily identified in green; it connects frontal and occipital lobes at the level of the midbrain. Posteriorly, the inferior occipitofrontal fasciculus mingles with the inferior longitudinal fasciculus, optic radiations, superior longitudinal fasciculus, and other fibers to form the sagittal stratum—a vast and complex bundle that connects the occipital lobe to the rest of the brain.
The cingulum begins in the parolfactory area of the cortex below the rostrum of the corpus callosum, then courses within the cingulate gyrus, and, arching around the entire corpus callosum, extends forward into the parahippocampal gyrus and uncus. It interconnects portions of the frontal, parietal, and temporal lobes. Its arching course over the corpus callosum resembles the palm of an open hand with fingertips wrapping beneath the rostrum of the corpus callosum.
Superior Occipitofrontal Fasciculus (Figs 3, 6).—

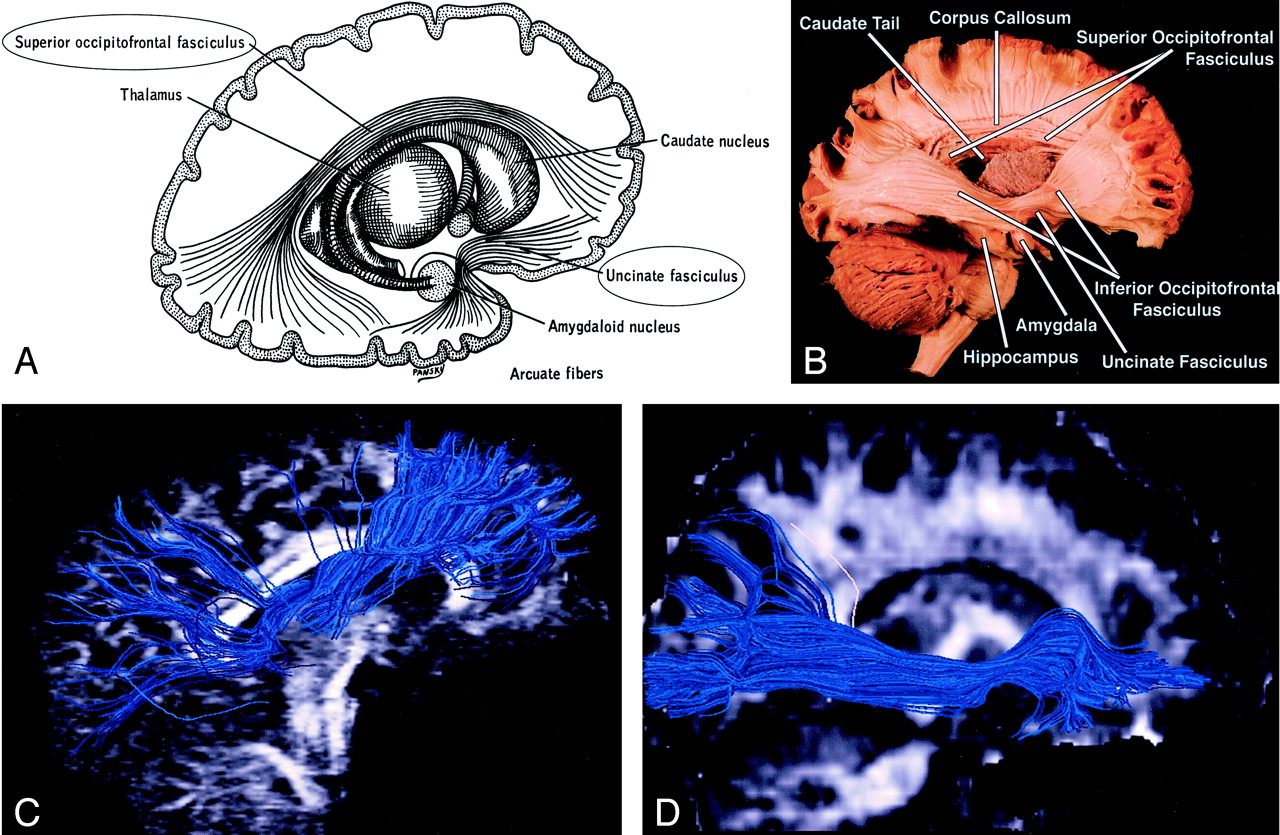
Superior and inferior occipitofrontal fasciculi and uncinate fasciculus, sagittal view.
A, Illustration shows the superior occipitofrontal fasciculus arching over the caudate nucleus to connect frontal and occipital lobes, and the uncinate fasciculus hooking around the lateral sulcus to connect inferior frontal and anterior temporal lobes (see also uncinate fasciculus in Figs 7 and 8B).
B, Gross dissection, lateral view. Like the superior occipitofrontal fasciculus, the inferior occipitofrontal fasciculus connects the frontal and occipital lobes, but it lies more caudad, running inferolateral to the claustrum (see also Fig 5B for axial view). The middle portion of the inferior occipitofrontal fasciculus is bundled together with the middle portion of the uncinate fasciculus.
C and D, Tractograms of the superior (C) and inferior (D) occipitofrontal fasciculi.
Whereas the cingulum wraps around the superior aspect of the corpus callosum, the superior occipitofrontal fasciculus lies beneath it. It connects occipital and frontal lobes, extending posteriorly along the dorsal border of the caudate nucleus. Portions of the superior occipitofrontal fasciculus parallel the superior longitudinal fasciculus (see below), but they are separated from the superior longitudinal fasciculus by the corona radiata and internal capsule.
Inferior Occipitofrontal Fasciculus (Figs 3, 5B, 6).—
The inferior occipitofrontal fasciculus also connects the occipital and frontal lobes but is far inferior compared with the superior occipitofrontal fasciculus. It extends along the inferolateral edge of the claustrum, below the insula. Posteriorly, the inferior occipitofrontal fasciculus joins the inferior longitudinal fasciculus, the descending portion of the superior longitudinal fasciculus, and portions of the geniculocalcarine tract to form most of the sagittal stratum, a large and complex bundle that connects the occipital lobe to the rest of the brain. The middle portion of the inferior occipitofrontal fasciculus is bundled together with the middle portion of the uncinate fasciculus (see below).
Uncinate Fasciculus (Figs 3, 6, 7, 8B).—

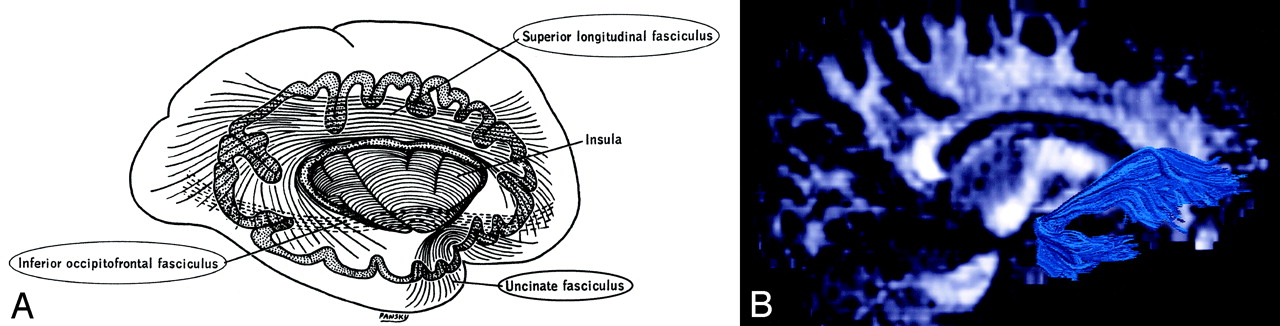
Uncinate fasciculus and superior longitudinal fasciculus, sagittal view.
A, Illustration shows the uncinate fasciculus hooks around the lateral sulcus to connect inferior frontal and anterior temporal lobes.
B, Tractogram. (See also Fig 6B for gross dissection.)

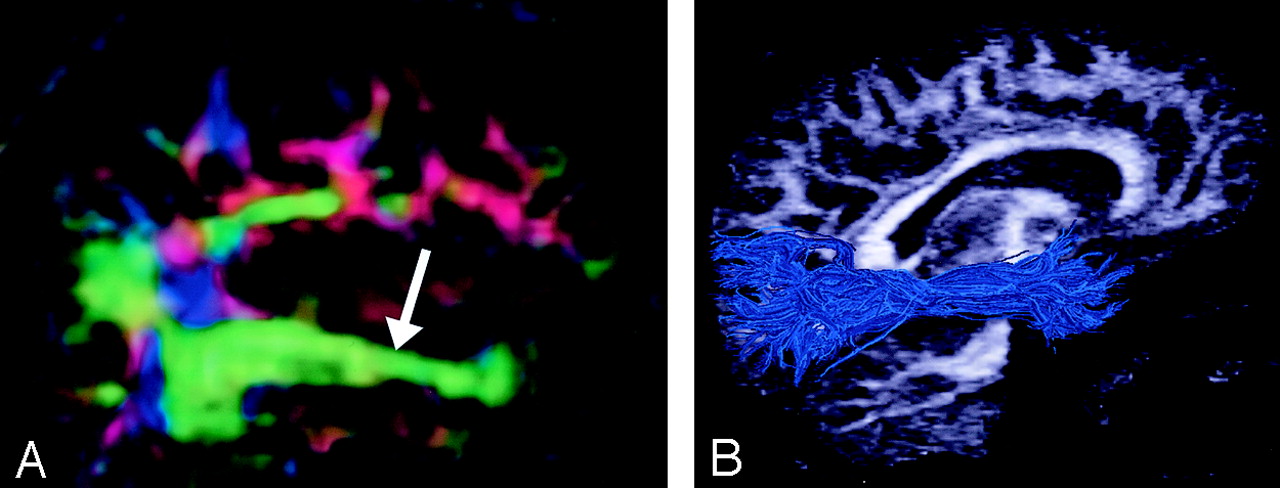
Superior longitudinal fasciculus, sagittal view. This massive fiber bundle sweeps along the superior margin of the claustrum in a great arc. The term arcuate fasciculus is often used in reference to the superior longitudinal fasciculus or, specifically, its more arcuate portion.
A, Gross dissection, lateral view.
B, Directional map, parasagittal section. Note the color change from green to blue as the superior longitudinal fasciculus fibers turn from an anteroposterior orientation (white arrows) to a more superior-inferior orientation (arrowhead). The same phenomenon can also be seen in the uncinate fasciculus (yellow arrow).
C, Tractogram. (See also Fig 7A.)
Uncinate is from the Latin uncus meaning “hook.” The uncinate fasciculus hooks around the lateral fissure to connect the orbital and inferior frontal gyri of the frontal lobe to the anterior temporal lobe. The anterior aspect of this relatively short tract parallels, and lies just inferomedial to, the inferior occipitofrontal fasciculus. Its midportion actuallyadjoins the middle part of the inferior occipitofrontal fasciculus before heading inferolaterally into the anterior temporal lobe.
Superior Longitudinal (arcuate) Fasciculus (Figs 3, 7A, 8).—
The superior longitudinal fasciculus is a massive bundle of association fibers that sweeps along the superior margin of the insula in a great arc, gathering and shedding fibers along the way to connect frontal lobe cortex to parietal, temporal, and occipital lobe cortices. The superior longitudinal fasciculus is the largest association bundle.
Inferior Longitudinal (occipitotemporal) Fasciculus (Figs 5B and 9).—

The inferior longitudinal fasciculus connects temporal and occipital lobe cortices. This tract traverses the length of the temporal lobe and joins with the inferior occipitofrontal fasciculus, the inferior aspect of the superior longitudinal fasciculus, and the optic radiations to form much of the sagittal stratum traversing the occipital lobe.
Projection Fibers
Corticospinal, Corticopontine, and Corticobulbar Tracts (Fig 10).—

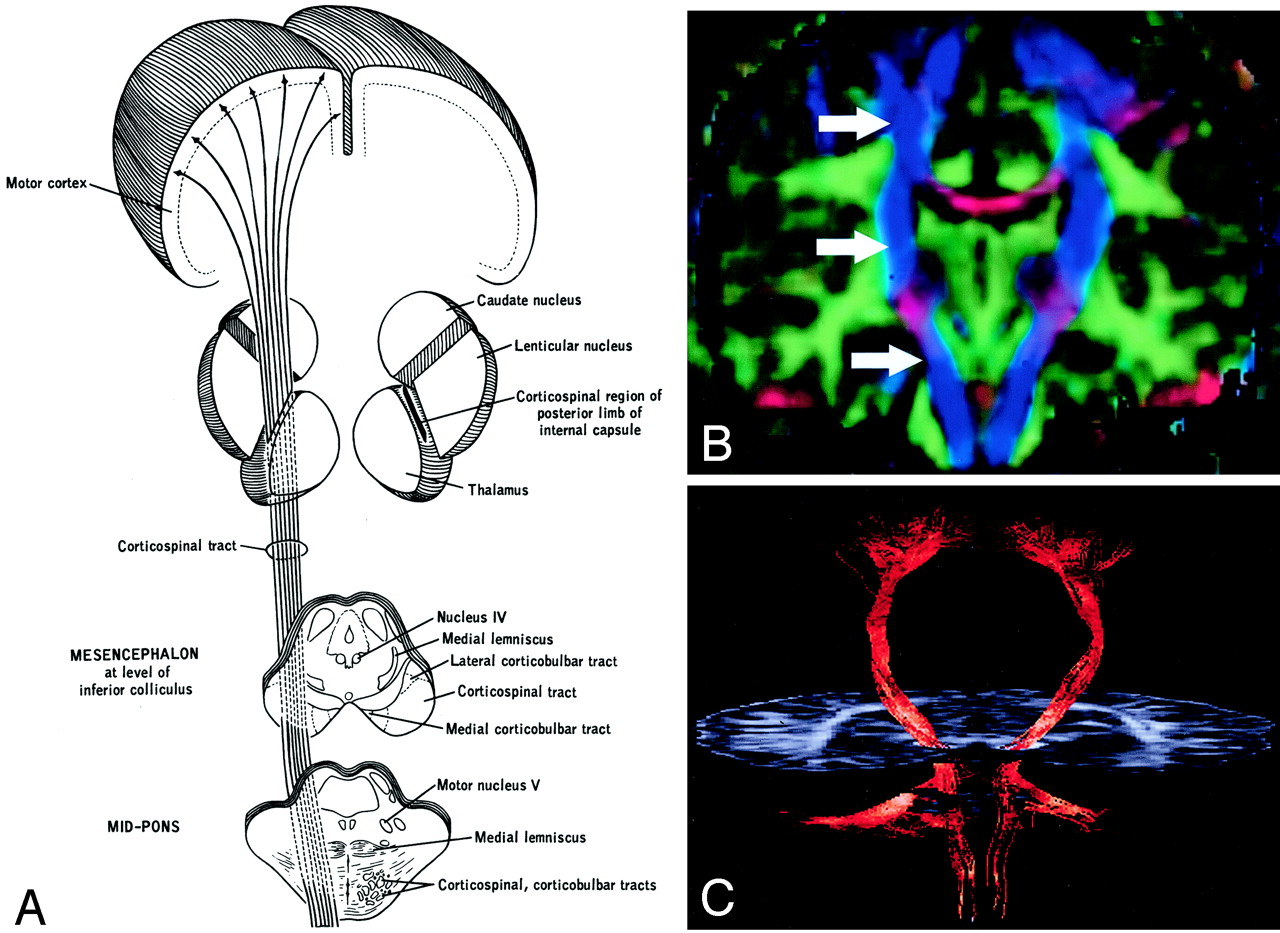
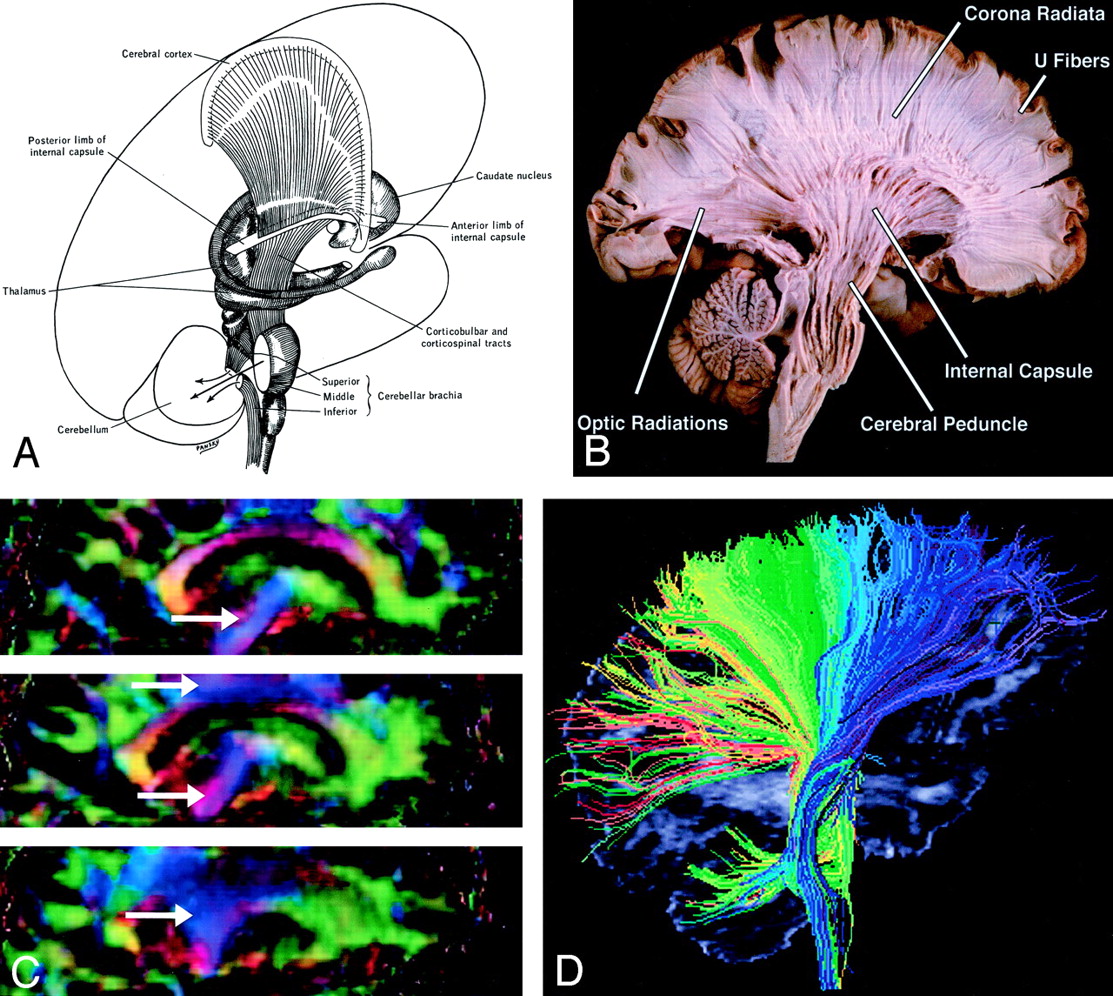
Corticospinal tract.
A, Illustration. (Twisting of the tract superior to the internal capsule not shown.) Corticospinal fibers originating along the motor cortex converge through the corona radiata and posterior limb of the internal capsule on their way to the lateral funiculus of the spinal cord.
B, Coronal directional map. Corticospinal fibers (arrows) are easily identified in blue on this DTI map owing to their predominantly superior-inferior orientation. The fibers take on a more violet hue as they turn medially to enter the cerebral peduncles, then become blue again as they descend through the brain stem. Corticospinal fibers run with corticobulbar and corticopontine fibers; these cannot be distinguished on directional maps but can be parsed by using tractographic techniques.
C, Tractogram.
The corticospinal and corticobulbar tracts are major efferent projection fibers that connect motor cortex to the brain stem and spinal cord. Corticospinal fibers converge into the corona radiata and continue through the posterior limb of the internal capsule to the cerebral peduncle on their way to the lateral funiculus. Corticobulbar fibers converge into the corona radiata and continue through the genu of the internal capsule to the cerebral peduncle where they lie medial and dorsal to the corticospinal fibers. Corticobulbar fibers predominantly terminate at the cranial motor nuclei. These bundles run together and are not discriminated on directional DTI color maps, but can be parsed by using sophisticated tractographic algorithms (21).
Corona Radiata (Fig 11).—

A and B, Illustration (A) and gross dissection, medial view (B) of the corona radiata.
C, Directional map, three adjacent parasagittal sections, with corona radiata identifiable in blue (arrows). Corona radiata fibers interdigitate with laterally directed callosal fibers, resulting in assorted colors in the vicinity of their crossing.
D, Tractogram in which different portions of the corona radiata have been parsed by initiating the tractographic algorithm from different starting locations.
Though not a specific tract per se, the corona radiata is one of the most easily identified structures on directional DTI color maps. Its coronally oriented fibers tend to give it a color quite distinct from that of surrounding tracts, which are oriented primarily light-right (corpus callosum) or anteroposteriorly (superior longitudinal fasciculus). Fibers to and from virtually all cortical areas fan out superolaterally from the internal capsule to form the corona radiata.
Internal Capsule (Fig 12).—

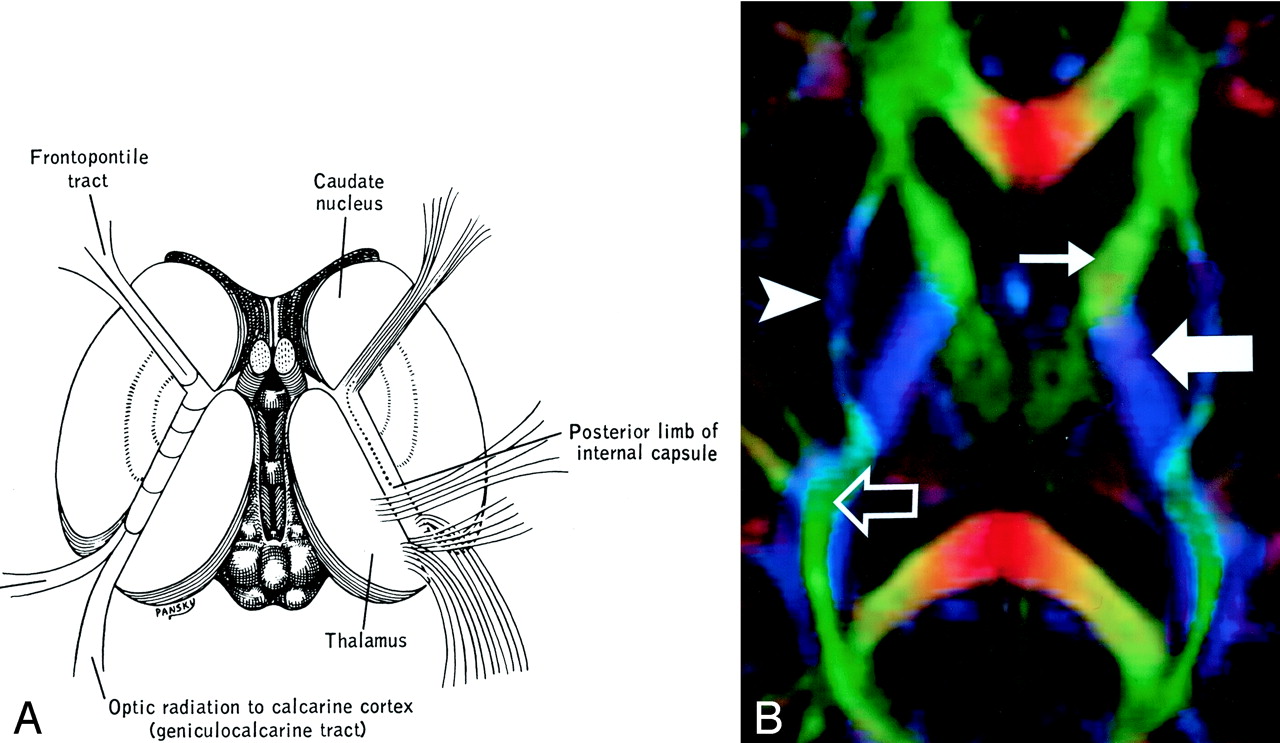
Internal capsule, axial view.
A and B, Illustration (A) and directional map (B). Because the anterior limb (small arrow) primarily consists of anteroposteriorly directed frontopontine and thalamocortical projections, it appears green on this DTI map. The posterior limb (large solid arrow), which contains the superior-inferiorly directed tracts of the corticospinal, corticobulbar, and corticopontine tracts, is blue. Note also the blue fibers of the external capsule (arrowhead) and the green fibers of the optic radiations (open arrow) in the retrolenticular portion of the internal capsule.
The internal capsule is a large and compact fiber bundle that serves as a major conduit of fibers to and from the cerebral cortex and is readily identified on directional DTI color maps. The anterior limb lies between the head of the caudate and the rostral aspect of the lentiform nucleus, while the posterior limb lies between the thalamus and the posterior aspect of the lentiform nucleus. The anterior limb passes projection fibers to and from the thalamus (thalamocortical projections) as well as frontopontine tracts, all of which are primarily anteroposteriorly oriented in contradistinction to the posterior limb, which passes the superior-inferiorly oriented fibers of the corticospinal, corticobulbar, and corticopontine tracts. This gives the anterior and posterior limbs distinctly different colors on directional DTI maps.
Geniculocalcarine Tract (optic radiation) (Fig 13).—

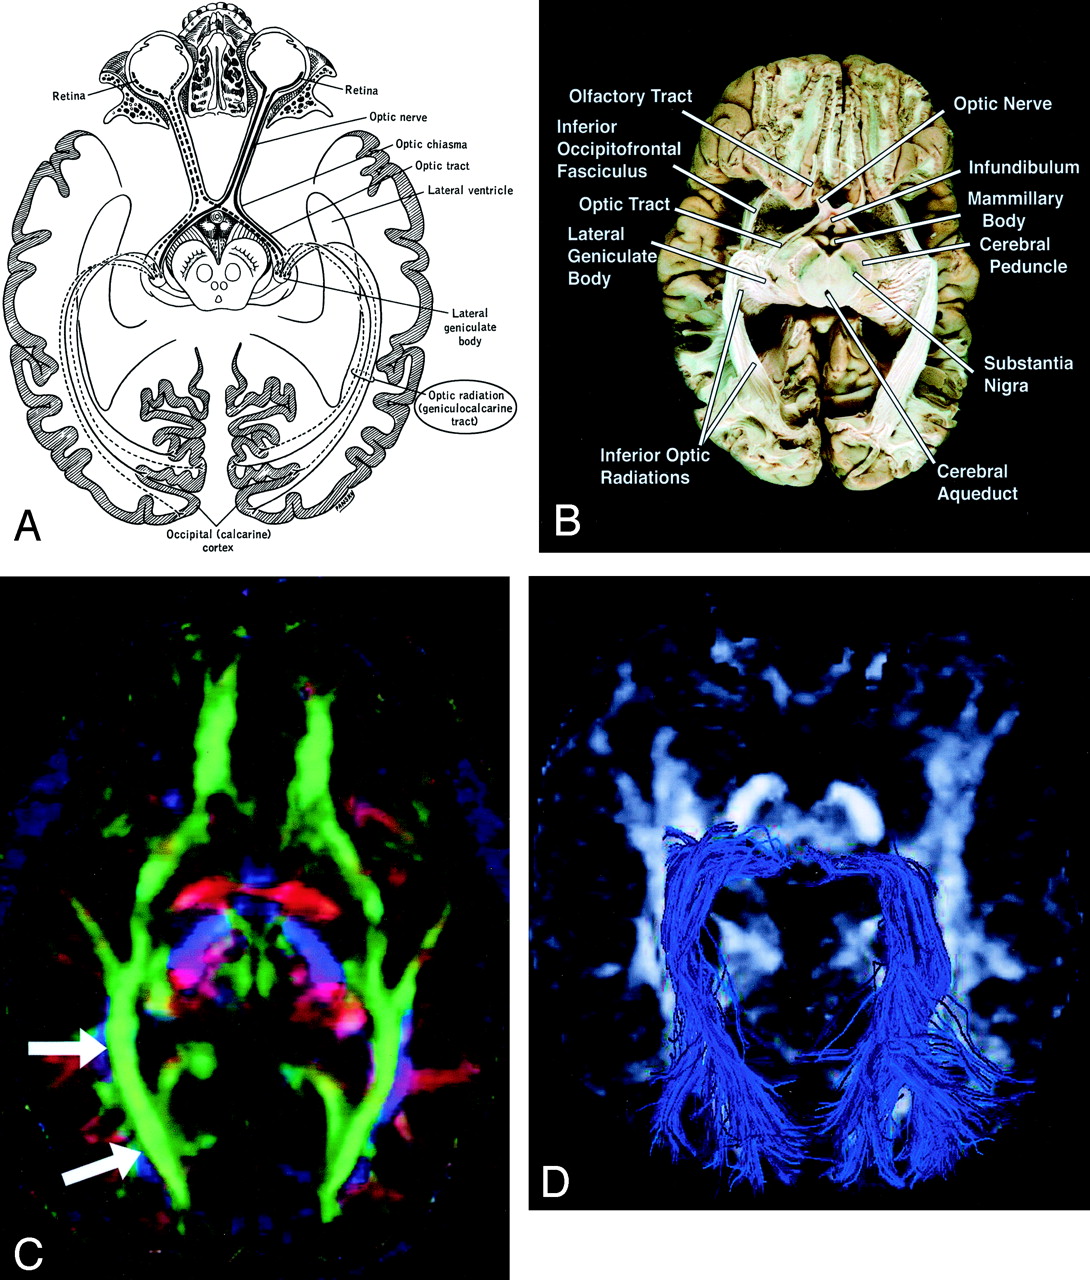
Geniculocalcarine tract (optic radiation), axial view.
A–D, Illustration (A), gross dissection (B), directional map (C), and tractogram (D). As this tract connects the lateral geniculate nucleus to occipital (primary visual) cortex, the fibers sweep around the posterior horn of the lateral ventricle and terminate in the calcarine cortex (more cephalad fibers of the optic radiation take a more direct path to the visual cortex). The optic radiation (arrows) mingles with the inferior occipitofrontal fasciculus, inferior longitudinal fasciculus, and the inferior aspect of superior longitudinal fasciculus to form much of the sagittal stratum in the occipital lobe.
The optic radiation connects the lateral geniculate nucleus to occipital (primary visual) cortex. The more inferior fibers of the optic radiation sweep around the posterior horns of the lateral ventricles and terminate in the calcarine cortex; the more superior fibers take a straighter, more direct path. The optic radiation mingles with the inferior occipitofrontal fasciculus, inferior longitudinal fasciculus, and inferior aspect of the superior longitudinal fasciculus to form much of the sagittal stratum in the occipital lobe.
Commissural Fibers
Corpus Callosum (Figs 14 and 15).—

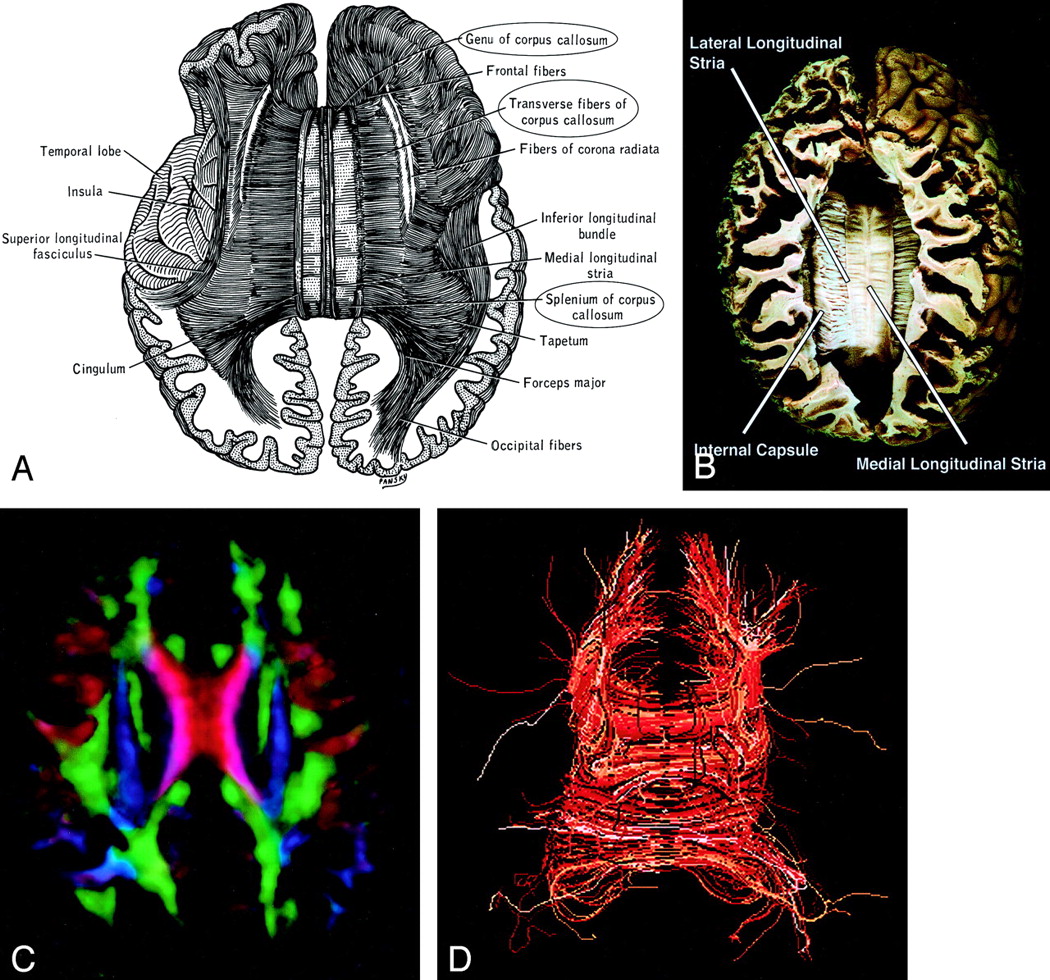
Corpus callosum, axial view.
A–D, Illustration (A), gross dissection (B), directional map (C), and tractogram (D). The largest WM fiber bundle, the corpus callosum connects corresponding areas of cortex between the hemispheres. Close to the midline, its fibers are primarily left-right oriented, resulting in its red appearance on this DTI map. However, callosal fibers fan out more laterally and intermingle with projection and association tracts, resulting in more complex color patterns.

A and B, Sagittal directional map of the corpus callosum (arrowheads) (A) and tractogram (B). (See also Fig 14.)
By far the largest WM fiber bundle, the corpus callosum is a massive accumulation of fibers connecting corresponding areas of cortex between the hemispheres. Fibers traversing the callosal body are transversely oriented, whereas those traversing the genu and splenium arch anteriorly and posteriorly to reach the anterior and posterior poles of the hemispheres. Near the midsagittal plane, all of the corpus callosum fibers are left-right oriented and easily identified on directional DTI color maps. However, as they radiate toward the cortex, callosal fibers interdigitate with association and projection fibers; resolving these fiber crossings with DTI is a difficult problem and the subject of intensive research (22).
Anterior Commissure (Fig 3).—
The anterior commissure crosses through the lamina terminalis. Its anterior fibers connect the olfactory bulbs and nuclei; its posterior fibers connect middle and inferior temporal gyri.
Brain Stem
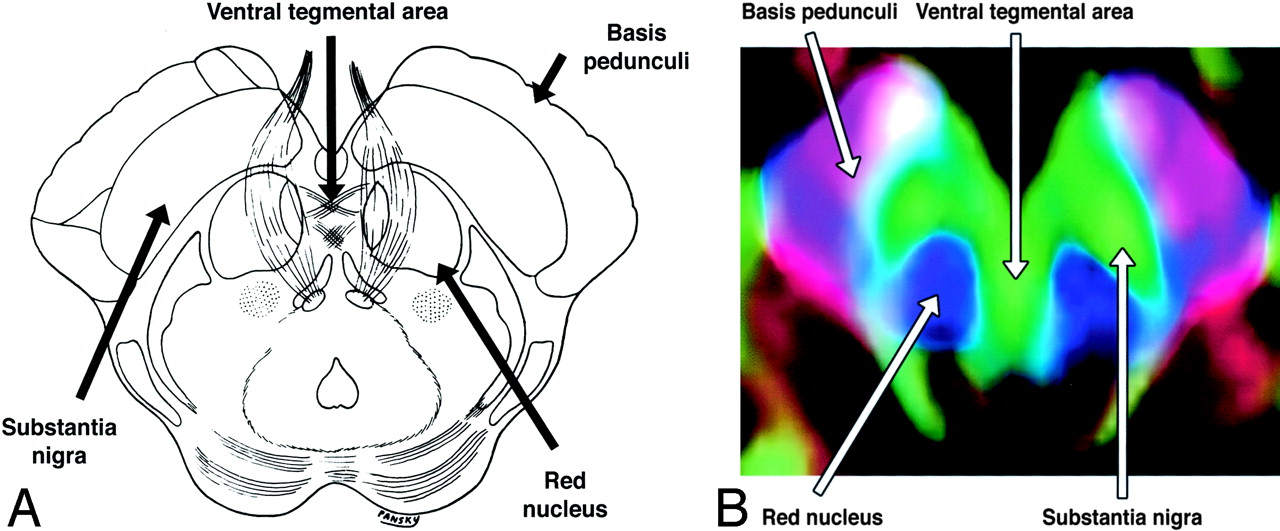
The complex anatomy of the brain stem includes a large number of tracts and nuclei, as well as multiple commissures and decussations, many of which can be resolved on directional DTI color maps. Space prohibits a comprehensive review, but several commonly seen brain stem structures are illustrated in Figs 16 and 17.

A and B, Axial illustration (A) and directional map (B) of the rostral midbrain.

A and B, Axial illustration (A) and directional map (B) of the midpons.
DTI Patterns in WM Tracts Altered by Tumor
The goal of surgical treatment for cerebral neoplasms is to maximize the extent of tumor resection while minimizing postoperative neurologic deficits resulting from damage to intact, functioning brain. This requires preoperative or intraoperative mapping of the tumor and its relationship to functional structures, including cerebral cortex and WM tracts. Cortical mapping can be accomplished with either functional MR imaging or intraoperative electrocortical stimulation. These methods are inadequate, however, for depicting the relationship of tumor to WM tracts. DTI is uniquely suited for this role.
The altered states of WM resulting from cerebral neoplasm (Fig 18) might be expected to influence the measurement of diffusion tensor anisotropy and orientation in various ways, resulting in several possible patterns on directional DTI color maps (7, 8). Intact WM tracts displaced by tumor might retain their anisotropy and remain identifiable in their new location or orientation on directional DTI color maps. Edematous or tumor-infiltrated tracts might lose some anisotropy but retain enough directional organization to remain identifiable on directional DTI maps. Finally, WM tracts might be destroyed or disrupted to the point where directional organization (and, consequently, diffusion anisotropy) is lost completely.

Potential patterns of WM fiber tract alteration by cerebral neoplasms. The extent to which these patterns can be discriminated on the basis of DTI is under investigation.
In a series of 20 brain tumors of various histologic diagnoses imaged preoperatively with DTI, we identified four major patterns in affected WM tracts, categorized on the basis of anisotropy and fiber direction or orientation (8).
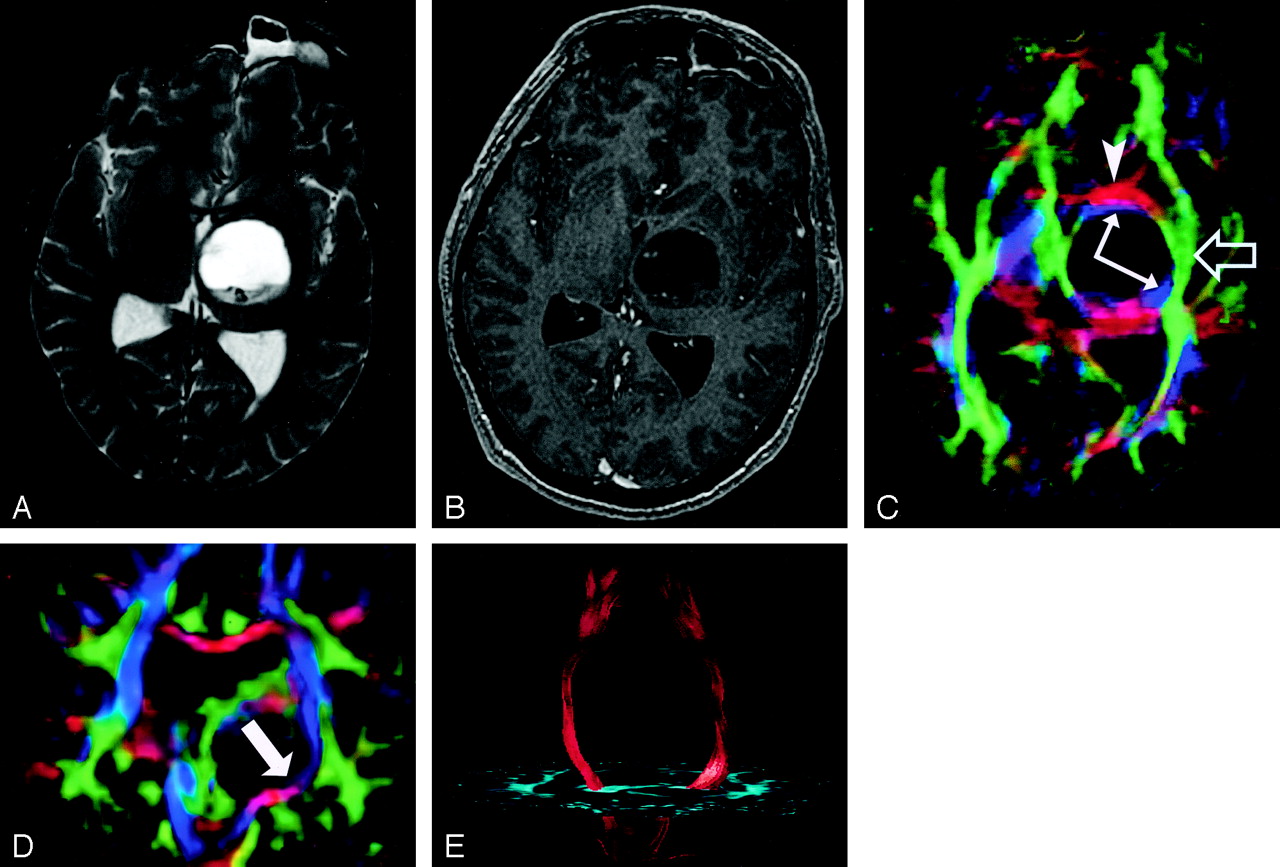
Pattern 1 (Fig 19) consists of normal or only slightly decreased FA with abnormal location and/or direction resulting from bulk mass displacement. This is the most clinically useful pattern in preoperative planning because it confirms the presence of an intact peritumoral tract that can potentially be preserved during resection (23).

DTI pattern 1: normal anisotropy, abnormal location or orientation.
A–E, T2-weighted MR image (A), contrast-enhanced T1-weighted image (B), directional maps in axial (C) and coronal (D) planes, and coronal tractogram of bilateral corticospinal tracts (E). WM tracts are deviated anteriorly, inferiorly, and posterolaterally by this ganglioglioma but retain their normal anisotropy. Therefore, they remain readily identified on DTI (C and D) and readily traced with tractography (E). The AC (red, arrowhead), IOFF (green, open arrow), and CST (blue, solid arrows) are deviated. Note the blue hue of the CST change to red as it deviates toward the axial plane by the tumor (arrow on coronal view [D]).
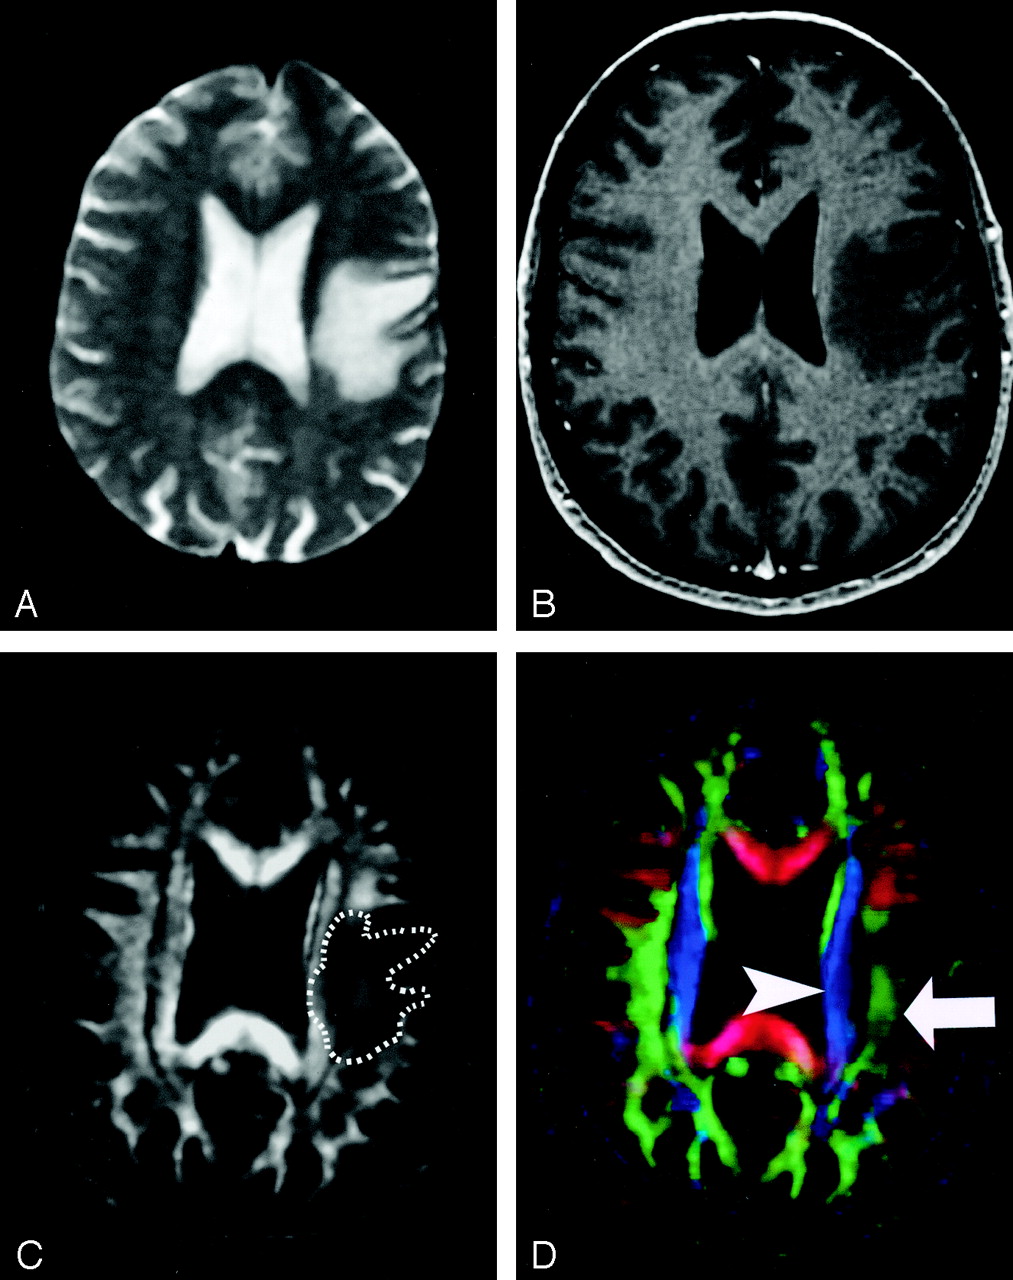
Pattern 2 (Fig 20) is substantially decreased FA with normal location and direction (ie, normal hues on directional color maps). We frequently observe this pattern in regions of vasogenic edema, although the specificity of this pattern is not yet known; further study is needed to determine the clinical utility of this observation.

DTI pattern 2: abnormal (low) anisotropy, normal location and orientation.
A–D, T2-weighted MR image (A), contrast-enhanced T1-weighted MR image (B), FA map (C), and directional map (D). The homogeneous region of hyperintensity on the T2-weighted image represents vasogenic edema surrounding a small metastasis (on another section, not shown). Despite diminished anisotropy in this region (darker region outlined on FA map) and diminished color brightness on directional map, the involved fiber tracts retain their normal color hues on the directional map (superior longitudinal fasciculus, green, arrow; corona radiata, blue, arrowhead). This preservation of normal color hues despite a substantial decrease in anisotropy is consistent with the abnormality of vasogenic edema, which enlarges the extracellular space (allowing less restricted diffusion perpendicular to axonal fibers, thus reducing the anisotropy) without disrupting cellular membranes, leaving their directional organization intact. It is not yet known to what extent this pattern is specific for edema, however.
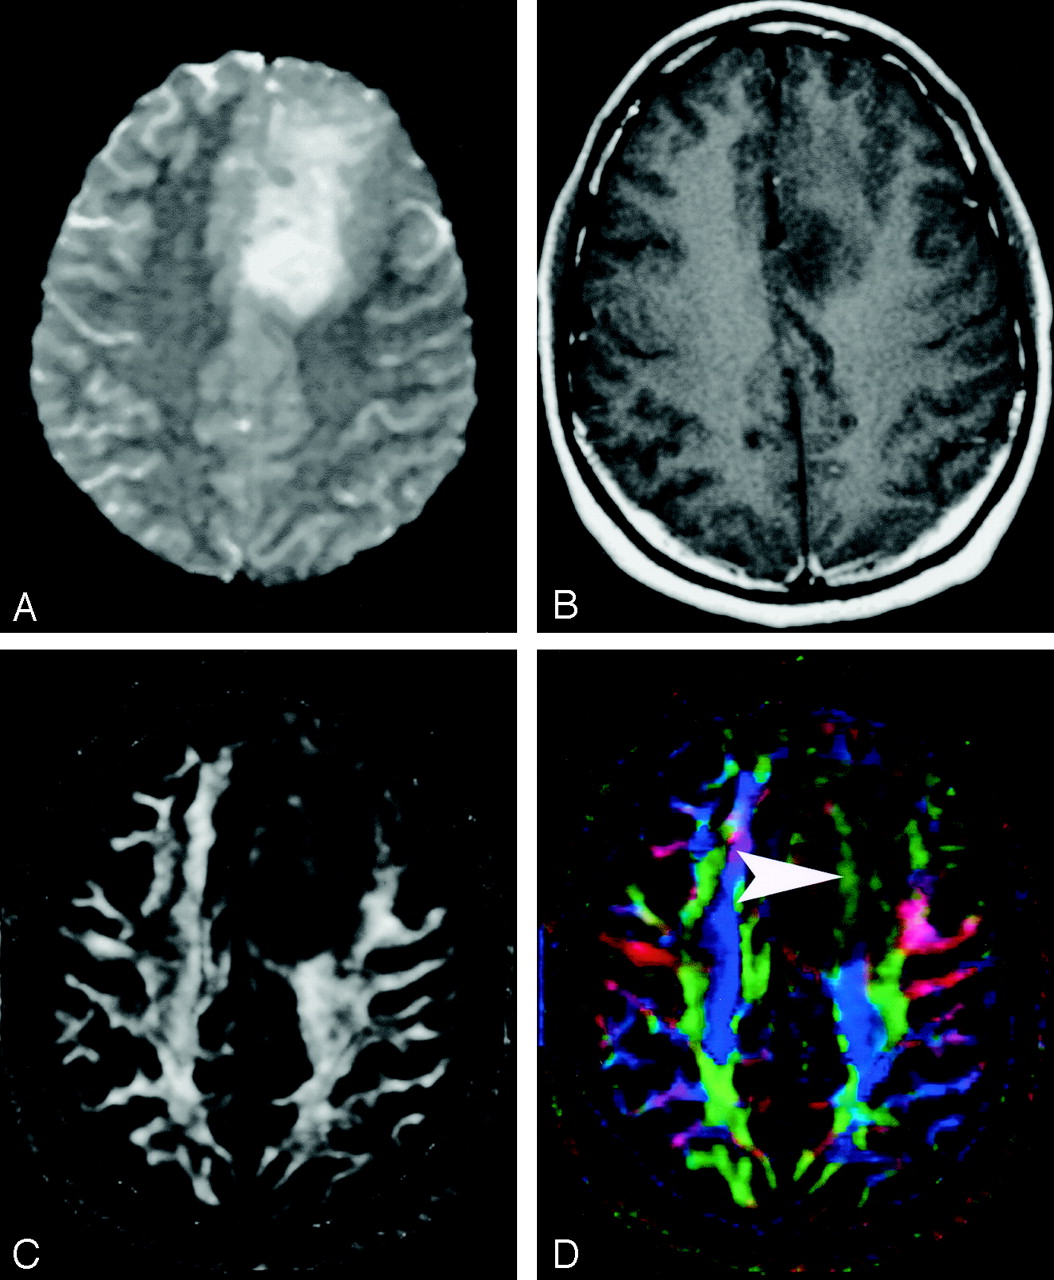
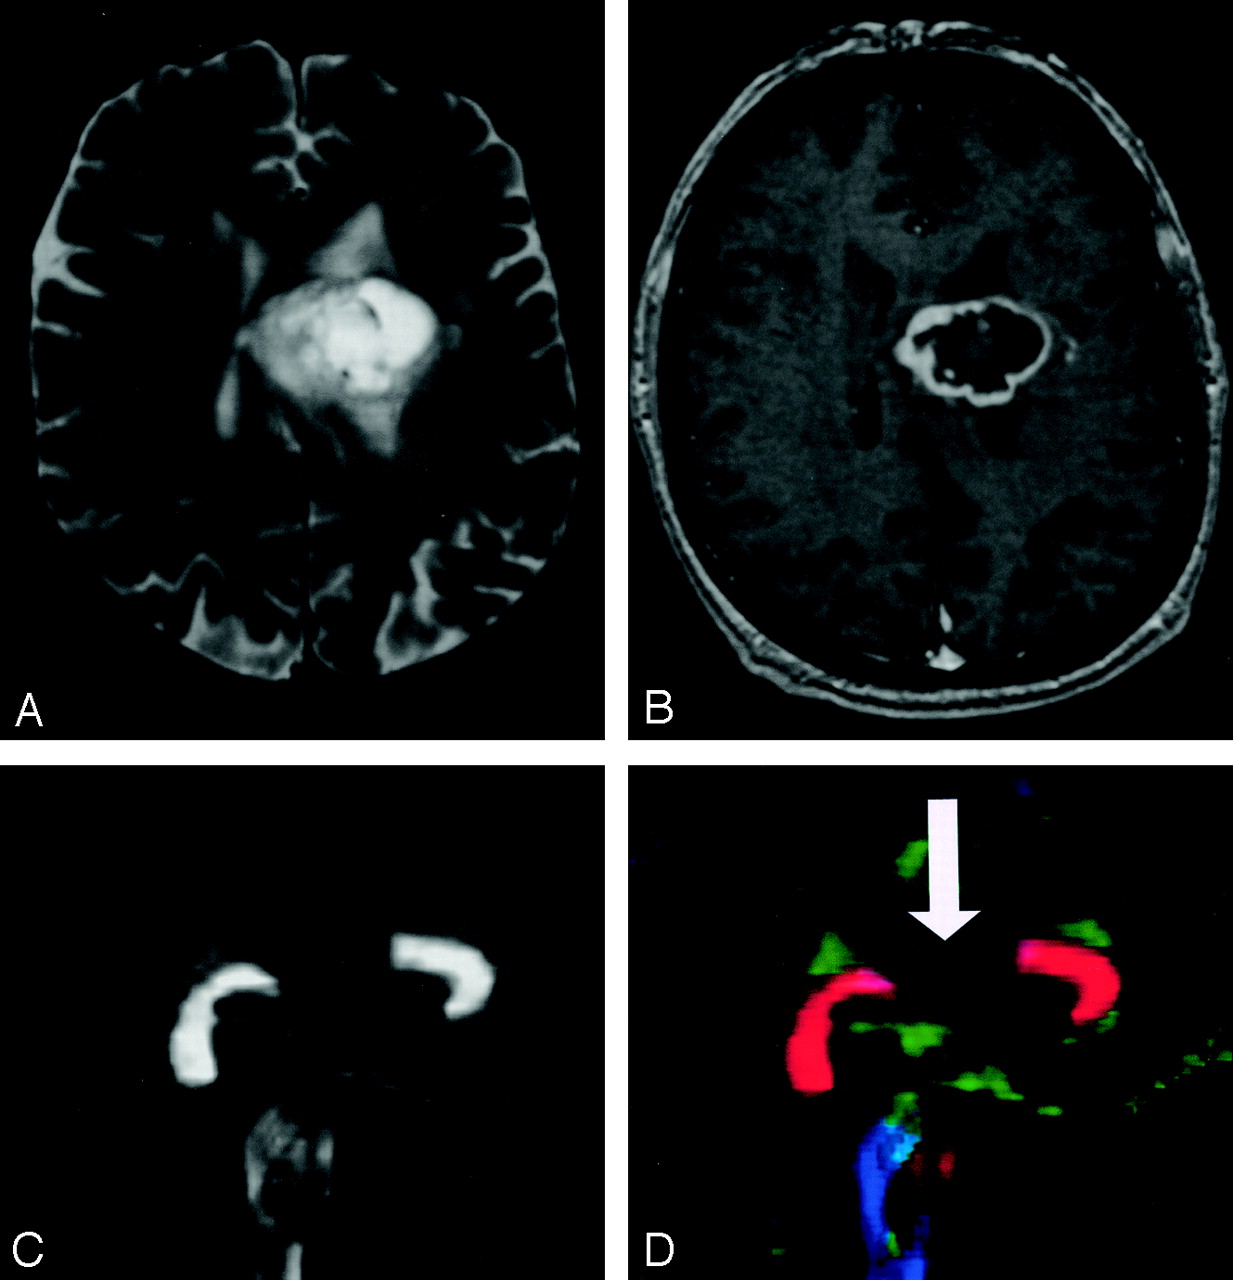
Pattern 3 (Fig 21) is substantially decreased FA with abnormal hues on directional color maps. We have identified this pattern in a small number of infiltrating gliomas in which the bulk mass effect appeared to be insufficient to account for the abnormal hues on directional maps. We speculate that infiltrating tumor disrupts the directional organization of fiber tracts to cause altered color patterns on directional maps, but this phenomenon requires further study.

DTI pattern 3: abnormal (low) anisotropy, abnormal orientation.
A–D, T2-weighted MR image (A), contrast-enhanced T1-weighted image (B), FA map (C), and directional map (D). This infiltrating astrocytoma is characterized by both diminished anisotropy and abnormal color (arrowhead) on the directional map, suggesting disruption of WM fiber tract organization more severe and complex than that seen with pattern 2 (compare Fig 20). Note that the color change cannot easily be attributed to bulk mass effect as in purely deviated tracts.
Pattern 4 (Fig 22) consists of isotropic (or near-isotropic) diffusion such that the tract cannot be identified on directional color maps. This pattern is observed when some portion of a tract is completely disrupted by tumor. This pattern can be useful in preoperative planning in the sense that no special care need be taken during resection to preserve a tract that is shown by DTI to be destroyed.

DTI pattern 4: near-zero anisotropy, tract unidentifiable.
A–D, T2-weighted MR image (A), contrast-enhanced T1-weighted image (B), FA map (C), and directional map (D). This high-grade astrocytoma has destroyed the body of the corpus callosum, rendering the diffusion essentially isotropic and precluding identification on the directional map (arrow).
It should be noted that combinations of the above patterns may occur; for example, a combination of patterns 1 and 2 may be observed in a tract that is both displaced and edematous.
Summary
The polychrome produced by mapping the direction of the diffusion tensor allows rapid and unprecedented visualization of WM tracts in vivo. There is order to the complex beauty of these maps, and their interpretation requires knowledge of fiber tract anatomy that has heretofore not been commonly applied in routine clinical imaging. As DTI rapidly makes its way into the clinical realm, we have attempted to provide a concise pictorial review of the major tract anatomy typically visualized on directional DTI color maps without the more advanced and sophisticated tractographic techniques that will take somewhat longer to reach routine clinical practice. We hope this review is useful to those radiologists who already interpret DTI maps and will inspire those who have not yet incorporated DTI into their practice to do so.
Acknowledgments
The authors gratefully acknowledge Drs. Konstantinos Arfanakis, Behnam Badie, Brian Witwer, Yijing Wu, and Sandra Zegarra for their assistance on this project.
Footnotes
Supported in part by National Institute of Mental Health grant RO1 MH62015.
Presented in part as an education exhibit at the 88th annual meeting of the Radiological Society of North America, Chicago, IL, December 1–6, 2002.
References
- Received June 8, 2003.
- Accepted after revision August 7, 2003.
- Copyright © American Society of Neuroradiology
In this issue


Jump to section
Related Articles
Cited By...
- Imaging crossing fibers in mouse, pig, monkey, and human brain using small-angle X-ray scattering
- Simultaneous Multislice for Accelerating Diffusion MRI in Clinical Neuroradiology Protocols
- Dopaminergic Nigrostriatal Connectivity in Early Parkinson Disease: In Vivo Neuroimaging Study of 11C-DTBZ PET Combined with Correlational Tractography
- Diffusion Tensor Imaging and Tractography Utilized in the Resection of a Midbrain Cavernous Malformation
- Is Low-Grade Intraventricular Hemorrhage in Very Preterm Infants an Innocent Condition? Structural and Functional Evaluation of the Brain Reveals Regional Neurodevelopmental Abnormalities
- Early life maturation of human visual system white matter is altered by monocular enucleation
- A retrospective evaluation of automated optimization of deep brain stimulation parameters
- A Quantitative Tractography Study into the Connectivity, Segmentation and Laterality of the Human Inferior Longitudinal Fasciculus
- The Relation Between White Matter Microstructure and Network Complexity: Implications for Processing Efficienc
- White Matter Extension of the Melbourne Childrens Regional Infant Brain Atlas: M-CRIB-WM
- Multi-Parametric and Multi-Regional Histogram Analysis of MRI: Revealing Imaging Phenotypes of Glioblastoma Correlated with Patient Survival
- Diffusion Tensor Tractography of Brainstem Fibers and Its Application in Pain
- Identification of the Corticobulbar Tracts of the Tongue and Face Using Deterministic and Probabilistic DTI Fiber Tracking in Patients with Brain Tumor
- MRI Tractography of Corticospinal Tract and Arcuate Fasciculus in High-Grade Gliomas Performed by Constrained Spherical Deconvolution: Qualitative and Quantitative Analysis
- Cerebral Diffusion Tensor MR Tractography in Tuberous Sclerosis Complex: Correlation with Neurologic Severity and Tract-Based Spatial Statistical Analysis
- Gender Differences in Language and Motor-Related Fibers in a Population of Healthy Preterm Neonates at Term-Equivalent Age: A Diffusion Tensor and Probabilistic Tractography Study
- Impairment of Speech Production Predicted by Lesion Load of the Left Arcuate Fasciculus
- Assessing the Chronic Neuropsychologic Sequelae of Human Immunodeficiency Virus-Negative Cryptococcal Meningitis by Using Diffusion Tensor Imaging
- Differential corticospinal tract degeneration in homozygous 'D90A' SOD-1 ALS and sporadic ALS
- Classification of Peritumoral Fiber Tract Alterations in Gliomas Using Metabolic and Structural Neuroimaging
- Maturation of Thalamic Radiations between 34 and 41 Weeks' Gestation: A Combined Voxel-Based Study and Probabilistic Tractography with Diffusion Tensor Imaging