
Abstract
BACKGROUND AND PURPOSE: Poor clinical outcomes without notable neuroimaging findings after mild traumatic brain injury (MTBI) suggest diffuse tissue damage and altered metabolism not observable with conventional MR imaging and CT. In this study, MTBI-associated metabolic changes were assessed over the entire brain by using volumetric proton MR spectroscopic imaging (MRSI) and the findings related to injury and outcome assessments.
METHODS: Fourteen subjects with mild closed head injury (Glasgow Coma Scale [GCS] scores of 13–15) underwent structural MR imaging and proton MRSI at 1.5 T within 1 month of injury. Distributions of N-acetylaspartate (NAA), total creatine (Cr), and total choline (Cho) were mapped over a wide region of the brain, and metabolite ratios were calculated for 25 regions without MR imaging abnormalities. Results were compared with data from 13 control subjects.
RESULTS: Significant changes (P < .05) were found for some, but not all, brain regions for the average values from all MTBI subjects, with reduced NAA/Cr, increased Cho/Cr, and reduced NAA/Cho. Global NAA/Cho obtained from the sum of all sampled regions in two subjects was significantly reduced. Metabolite ratios were not significantly correlated with GCS score at admission or Glasgow Outcome Scale (GOS) score at 6 months after injury, although they were weakly correlated with GOS score at discharge.
CONCLUSION: These results show evidence of widespread metabolic changes following MTBI in regions that appear normal on diagnostic MR images. Although the association with injury assessment and outcome is weak, this preliminary study demonstrates the applicability of volumetric proton MRSI for evaluating diffuse injury associated with MTBI.
Neuroimaging methods are of considerable value for the acute assessment and management of traumatic brain injury (TBI), although their role in classifying the degree of injury and in predicting outcomes remains a topic of investigation. Currently, these assessments may be made on the basis of both imaging and clinical findings, which commonly include the Glasgow Coma Scale (GCS) score and durations of loss of consciousness (LOC) and post-traumatic amnesia (PTA). Approximately 80% of injuries are classified as mild traumatic brain injury (MTBI) (1), which is defined as head trauma with LOC of less than 30 minutes with a GCS score of 13–15 and PTA less than 24 hours (2).
Although CT is the preferred imaging technique for acute evaluation of TBI (3), MR imaging may be used in the subacute and chronic period if persistent and unexplained disabilities remain. MR imaging can depict nonhemorrhagic and hemorrhagic contusions and is more sensitive for detection of diffuse axonal injury (4, 5). However, for MTBI, neuroimaging findings are frequently negative. If lesions are observed, they are typically small and few in number. In many cases, the neuroimaging findings do not fully explain the clinical symptoms, and in the absence of any corroborating neuroimaging evidence, these subjects are frequently misclassified. Furthermore, the correlation between early structural neuroimaging findings and long-term clinical outcomes is weak (6), and the prognosis for disability and social and occupational outcomes is typically based on clinical evaluation measures.
Approximately 50–80% of subjects with MTBI develop persistent symptoms that most often diminish gradually in 1–3 months, though they may persist for several years after injury. In the absence of notable neuroimaging findings, this clinical outcome suggests that widespread, microscopic tissue damage may be present that is not observable with conventional structural imaging methods (7, 8). Diffuse axonal injury is believed to be responsible for this poor late clinical outcome, and improved sensitivity for the detection of axonal injury is possible through an evaluation of functional and metabolic changes with positron emission tomography (9) and MR spectroscopy.
Using conventional MR imaging instrumentation, proton (1H) MR spectroscopy offers a noninvasive method for measuring cerebral metabolites such as N-acetylaspartate (NAA), a marker of neuronal and axonal viability (10); total choline (Cho), a marker of membrane metabolism; total creatine (Cr), which reflects energy status; lactate (Lac), an indicator of ischemia; and mobile lipids. Several studies have indicated the potential of these methods for the detection of neuronal injury following TBI (11–23). A common finding is altered metabolite concentrations in regions that appear normal at MR imaging; this is indicative of widespread and diffuse tissue damage. This finding includes reduced NAA, increased Cho, and increased myo-inositol levels. These occur in both gray matter and white matter from regions such as the occipital, parietal, and frontal lobes and the splenium of the corpus callosum. Increased Lac values have also been observed in the acute phase (11, 21).
In previous 1H MR spectroscopic studies that examined correlations between altered metabolite levels and injury severity (13, 16) or clinical outcome (11, 14, 15), the common conclusion was that metabolite levels measured within days or weeks after injury are correlated with both initial severity and late clinical outcome. However, these correlations were likely due to the inclusion of subjects with moderate or severe injury. To our knowledge, only three studies have specifically addressed subjects with mild injury, which represent the largest group of patients and perhaps the ones most difficult to characterize. Garnett et al (16) evaluated eight subjects and found significantly increased Cho/Cr and decreased NAA/Cho values in regions appearing normal at MR imaging. In a group of seven subjects, Son et al (22) found reduced NAA/Cr and increased Lac/Cr values in edematous areas adjacent to focal contusions that were visible on T2-weighted MR images. Cecil et al (13) examined 26 subjects with MTBI at an average of 1 year after injury and found reduced NAA/Cr in the corpus callosum. Limitations of these studies include the small number of subjects, the sampling of only a small region of the brain by using single-voxel 1H MR spectroscopy, and limited correlation with outcome evaluations.
From these previous studies, it is apparent that the 1H MR spectroscopic observation of neurometabolites can give valuable information about the degree of neuronal injury and that the metabolic changes are observed remote from MR imaging–identified abnormalities consistent with histologic observations of diffuse axonal injury (7). However, it is also apparent that the degree of metabolic abnormality is relatively small for subjects with mild injury. Therefore, given the diffuse and widespread nature of the injury, the aims of this study were to obtain spectroscopic measurements over a large brain region to improve sensitivity for the characterization of the degree of injury. An additional aim was to evaluate the relationship of the MR spectroscopic findings with clinical outcomes 6 months after injury.
Methods
Subject Selection
Sixteen subjects (mean age, 31 years; range, 18–53 years) with MTBI were recruited from San Francisco General Hospital, CA. Thirteen control subjects (mean age, 29 years; range, 19–52 years) were included for comparison. The study protocol was approved by the Committee on Human Research, University of California San Francisco, and the Veterans Affairs Medical Center, San Francisco, CA. All subjects with TBI had a GCS score of ≥13 and LOC of less than 30 minutes, and none had PTA for more than a few hours. MR imaging and 1H MR spectroscopic imaging (MRSI) data were collected 2–30 days (average, 13.3 days) after injury. Subjects with other causes of neurologic impairment or disease known to alter metabolite concentrations, as well as those who had a previous serious head injury, were excluded. Clinical outcomes were assessed at discharge and at 6 months after injury by using the Glasgow Outcome Scale (GOS).
Subject descriptive data, including age, sex, GCS score, interval between injury and MR study, type of injury, and CT and/or MR imaging findings are given in Table 1. Causes of injury included motor vehicle accidents (n = 10), skateboard accidents (n = 3), assaults (n = 2), and a fall (n = 1).
Summary of demographic data and imaging findings in subjects with TBI
MR Imaging Methods
All MR studies were carried out at 1.5 T (Vision; Siemens, Erlangen, Germany) by using a standard quadrature head coil. The imaging protocol was approximately 90 minutes. Standard techniques of restraining head movement, such as the use of horizontal head cushions and a vacuum-bag neck restraint, were not applied in four subjects for reason of comfort; this did not compromise data quality. The protocol included scout MR imaging, followed by an axial double spin-echo acquisition (TR/TE = 5000/20 and 80/1; 47 sections of 3-mm thickness) and a coronal/axial gradient-echo (magnetization-prepared rapid gradient-echo [MPRAGE]) acquisition (TR/TE/NEX = 9.7/4/1; slab thickness = 231 mm, number of partitions = 154). MR images were angulated in the axial direction 10° steeper than the line parallel to the anterior and posterior commissures.
Volumetric 1H MRSI data were obtained by using spin-echo excitation with echo-planar readout (24) for a 140-mm-thick slab covering the whole brain; this was angulated as for MR imaging. The acquisition included chemical shift-selective (CHESS) water suppression, inversion-recovery lipid nulling with TI = 187 ms, field of view = 280 × 280 × 240 mm, spatial acquisition size = 32 × 32 × 16 points (kx, ky, kz), 512 spectral data samples, TR/TE/NEX = 1800/70/2, and sweepwidth = 1.25 kHz. The total acquisition time was 31 minutes, and the nominal voxel size was 1.15 cm3.
Data Processing and Analysis
All MR images were analyzed for contusion, hematoma, and focal injury. MRSI data were processed as described previously (24). From the 16 reconstructed MRSI sections along the axial direction, eight or nine sections that covered the brain were selected. The brain region was manually identified for each section on the basis of the water MRSI data, and an automated parametric spectral analysis procedure (25) was applied to all voxels inside this region.
Data analysis was limited to voxels in the central five sections, which included regions known to be susceptible to injury, such as brain stem, corpus callosum, white matter, and cerebellum (8). From the five sections, voxels from 25 regions were manually selected on the basis of coregistered MR imaging, with care taken to exclude voxels corresponding to regions with any injury depicted at MR imaging. The fitted metabolite values were then averaged over 10–50 voxels in each region. NAA/Cr, Cho/Cr, and NAA/Cho ratios were calculated from the mean metabolite values. To investigate changes in average metabolite levels for the subjects with TBI, metabolite ratios obtained for each region in each subject were averaged over all subjects. The results compared with the mean values for each corresponding region in the control group. Finally, comparisons were made between global mean metabolite ratios of each subject with TBI and the average global mean metabolite ratios of all control subjects. GOS scores were collected for each subject with TBI at the time of discharge and 6 months after injury.
The Student two-tailed t test with equal variance was used to test for differences in metabolite ratios between groups. A probability value of less than .05 was considered to indicate a significant difference. Correlations between metabolite ratios and GCS or GOS scores were tested by using the Spearman rank correlation (StatsDirect; Cheshire, UK).
Results
1H MRSI data were obtained from 16 subjects with TBI and 13 control subjects; however, data from two subjects with TBI were not used because of motion-induced data corruption. CT scans obtained at admission or MR images acquired for this study showed evidence of injury in 10 subjects; findings in four were normal (Table 1). The subjects’ clinical symptoms were typical for MTBI.
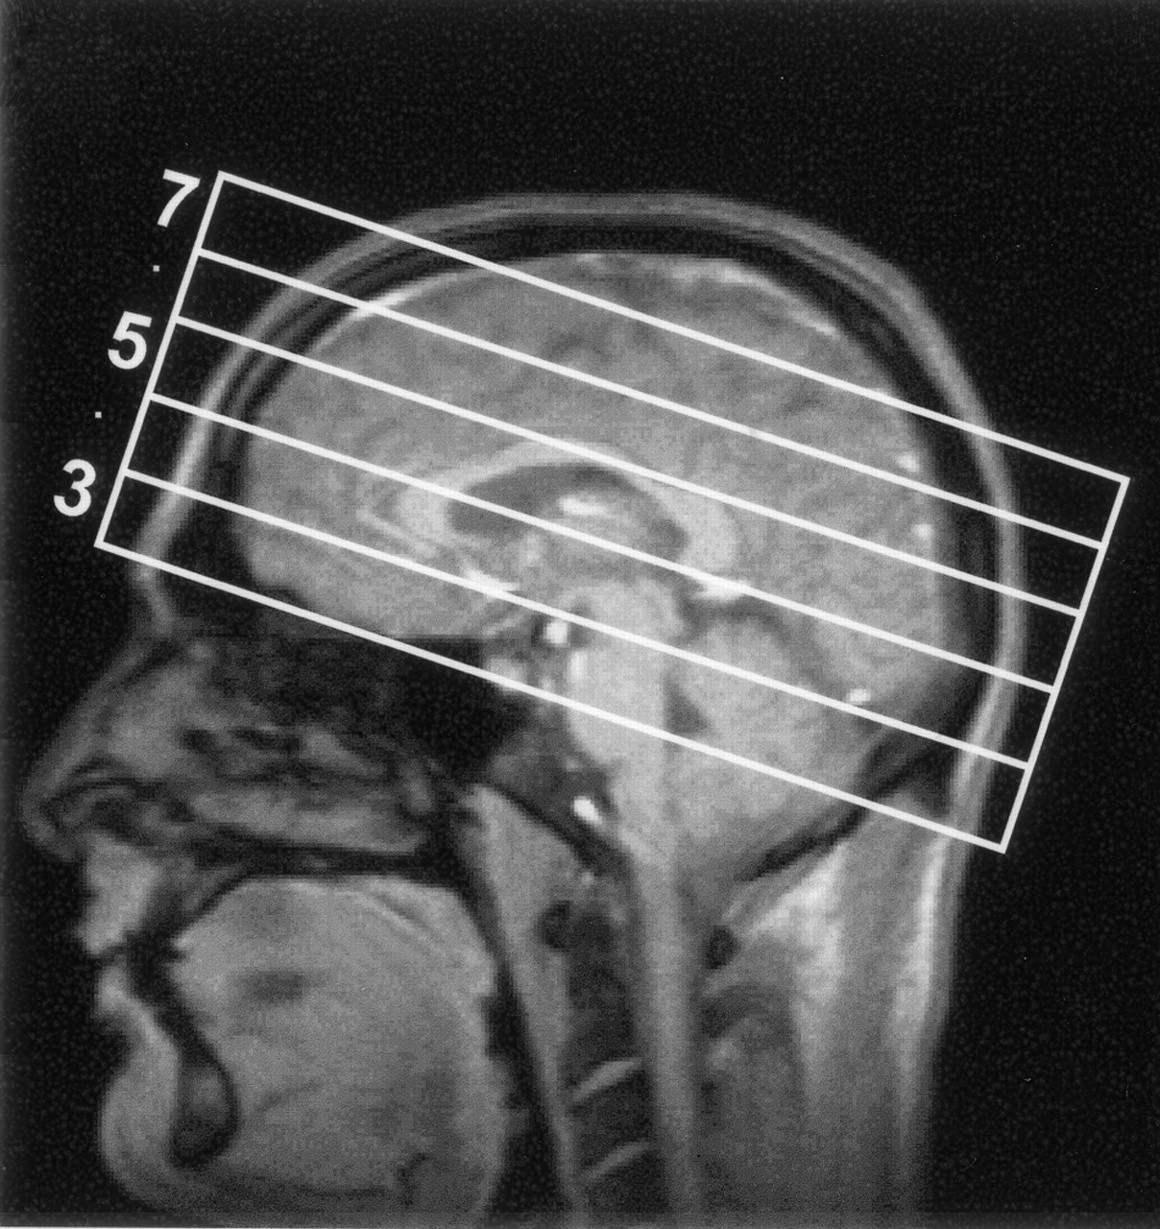
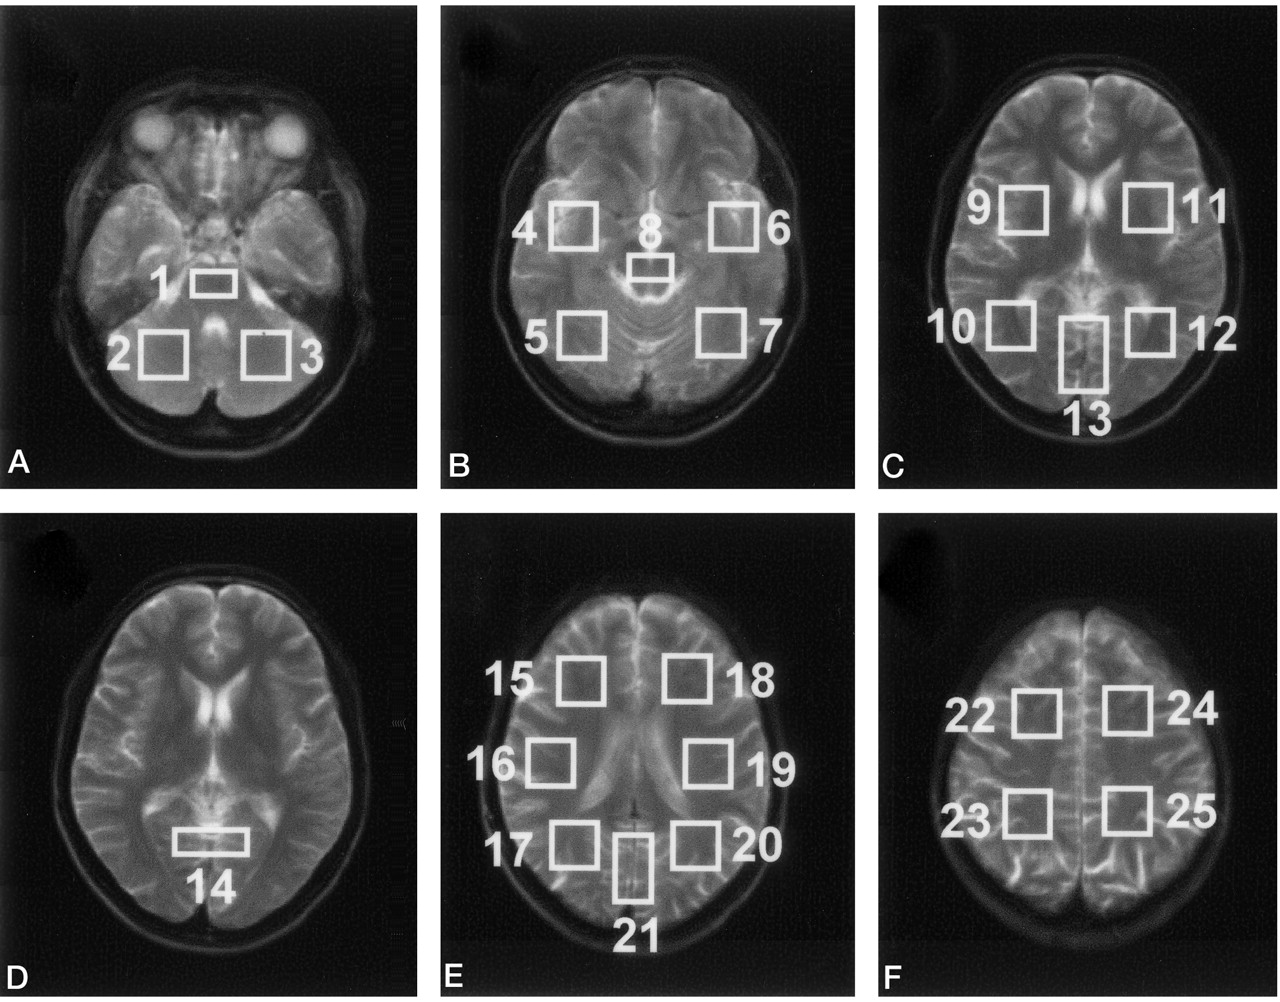
The volumetric EPSI method allowed us to obtain at least eight contiguous 15-mm sections in the brain. Figure 1 shows the central five sections selected for data analysis. Spectral quality was similar to that shown previously (24), and measured spectral linewidths for the voxels selected for analysis were in the range of 4–8 Hz. Figure 2 shows the MR images corresponding to the five central MRSI sections; each image was obtained by summing five 3-mm-thick MR images to correspond to the 15-mm-thick MRSI sections. Also shown in Figure 2 are the 25 regions selected for data analysis. Data were not obtained from parts of the frontal and temporal lobes where magnetic susceptibility variations degrade the spectral lineshape. These regions, and voxels in the region of MR imaging–observed hematomas in which localized spectral line broadening is common, were excluded from the analysis. Baseline distortions due to incomplete water suppression were commonly observed in the temporal and frontal lobes and brain stem, although they were adequately accounted for by the spectral analysis procedure.

Sections for data analysis and corresponding MRSI sections. Central five sections (numbered 3–7) selected for data analysis in the 140-mm-thick slab over which the MRSI acquisition was carried out.

A–F, MR images corresponding to the full thickness of each MRSI section (C and D are the same), with overlays indicating the 25 regions used for data analysis.
No focal abnormalities were visible on any of the metabolite images for the subjects with TBI, with the exception of one in whom a selective loss of all metabolites was evident in the immediate neighborhood of regions of MR imaging–depicted hematoma. This observation was attributed to susceptibility-induced losses in signal intensity. Also, no evidence of increased Lac levels was seen.
For the pooled data from all subjects with TBI, metabolite ratios were significantly different from ratios in controls in eight regions on three contiguous MRSI sections. As summarized in Table 2, these differences included decreased NAA/Cr in two predominately white matter regions in the parietal lobe, increased Cho/Cr in two predominately gray matter regions in the occipital lobe, and decreased NAA/Cho in four regions in the occipital lobe. The largest regional mean differences in NAA/Cr, Cho/Cr, and NAA/Cho ratios between controls and TBI subjects were 9%, 12%, and 15%, respectively, in the temporal and occipital lobes.
Metabolite ratios
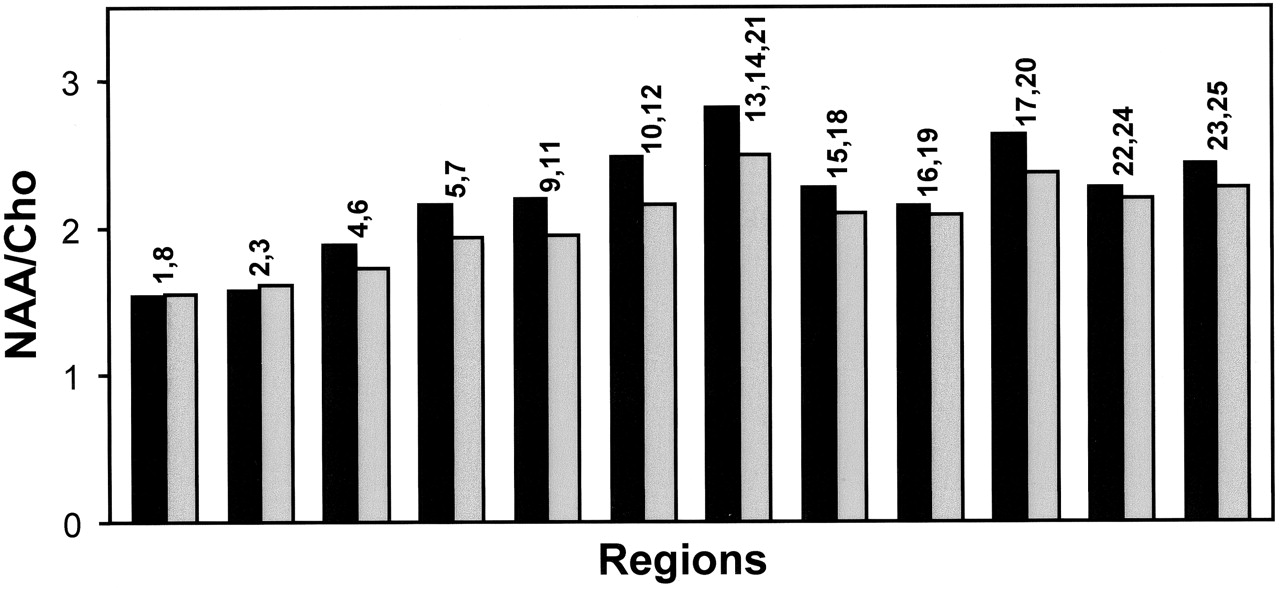
Figure 3 shows NAA/Cho values of control and TBI subjects from 12 brain regions. For simplification, the number of regions was reduced from the 25 shown in Figure 2 by combining anatomically similar areas, such as left and right voxels for the same brain region and regions corresponding to the pons and the midbrain. These results demonstrate the normal regional variation of metabolite ratios across different regions. For example, NAA/Cho ratios were lower in the brain stem and cerebellum (regions 1, 8 and 2, 3), higher in anterior areas (regions 4, 6, 9, 11, 15, 18) relative to posterior areas (regions 5, 7, 10, 12, 17, 20), and higher in occipital gray matter (regions 13, 14, 21). A consistent trend of reduced NAA/Cho was seen in TBI subjects relative to control subjects for all regions, excluding brain stem and cerebellum, although statistical significance was found in only five regions, as indicated in Table 2.

Mean regional NAA/Cho ratios of control (black) and TBI (gray) subjects. Numbers above each histogram pair refer to regions identified in Figure 2; multiple numbers indicate that data from the regions were grouped. Average SD for control and TBI subjects were 16.7% and 16.3%, respectively.
Figure 4 shows the global mean metabolite ratios for each subject with TBI, grouped according to GCS score on admission. Leaving aside the data from the subject with a GCS score of 13 as an outlier, the plot shows that global NAA/Cho (and to a lesser extent NAA/Cr) of most TBI subjects was lower than that of controls. No significant correlation was found between the GCS and the metabolite ratios (NAA/Cr, ρ = −0.25, P = .37; Cho/Cr, ρ = −0.19, P = .51; NAA/Cho, ρ = −0.01, P = .96).

Mean global metabolite ratios in subjects with TBI (open symbols) plotted against GCS score at admission. Horizontal lines and solid symbols indicate ratios for controls, and error bars show 2 SD. Triangles, circles, and diamonds indicate NAA/Cho, NAA/Cr, and Cho/Cr ratios, respectively.
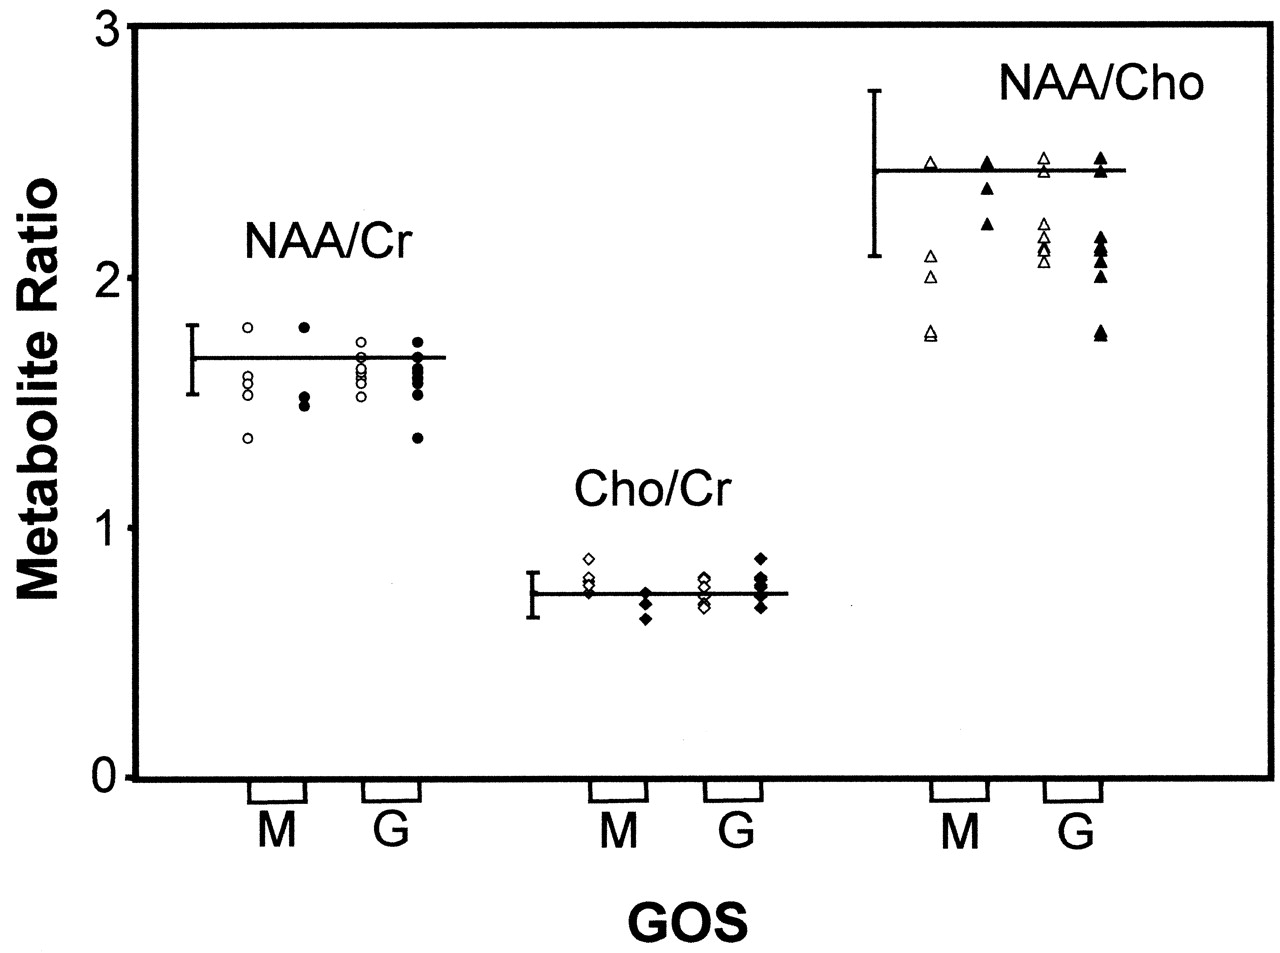
GOS scores of 14 TBI subjects at the time of discharge indicated good recovery in eight and moderate disability in five; in one, the score was not recorded. Figure 5 shows the plots of their mean global metabolite ratios grouped according to GOS score. These data indicate a trend of lower NAA/Cho and higher Cho/Cr for the group reporting moderate disability. There was evidence of a weak correlation between NAA/Cho and GOS score on discharge approaching statistical significance (ρ = 0.51, P = .08); however, this was not observed for the other metabolite ratios (NAA/Cr, ρ = 0.30, P = .32; Cho/Cr, ρ = −0.40, P = .17).

Mean global metabolite ratios in TBI subjects obtained shortly after injury plotted against GOS scores at discharge (open symbols) and at 6 months after injury (solid symbols). Data are separated according to moderate (M) and good (G) outcomes. NAA/Cr (circles), Cho/Cr (diamonds), and NAA/Cho (triangles) ratios are indicated. Horizontal lines indicate ratios for controls, and error bars show 2 SD.
GOS scores at 6 months after injury indicated good recovery in 10 and moderate disability in three; in one, the scores were not recorded. Figure 5 shows the mean global metabolite ratios grouped by GOS score. No correlations were observed between any of the metabolite ratios and the GOS score (NAA/Cr, ρ = 0.15, P = .63; Cho/Cr, ρ = 0.59, P = .04; NAA/Cho, ρ = −0.49, P = .09).
Discussion
The primary finding was that MRSI-identified metabolite ratios were significantly altered in the subacute period after MTBI in regions appearing normal on conventional MR images. These changes were observed for the global measurements for two of the subjects (obtained by averaging over all sampled brain regions for each subject) and for the eight brain regions by using average values over all 14 subjects. The primary alterations were reduced NAA/Cr and NAA/Cho; these were consistent with both the reduction in NAA and the increase in Cho seen in previous studies of more severe injury. However, this study did not observe significant alteration in metabolite intensities in any individual region of any subject and found only a weak correlation of the metabolic imaging measures with outcome at discharge and no correlation with 6-month outcomes.
Similar alterations in brain metabolites in normal-appearing regions at MR imaging were observed in previous studies of single-volume MRSI measurements or over a limited region (11–19, 22, 23). Our finding of reduced NAA/Cr is consistent with widespread neuronal damage or dysfunction “invisible” to structural neuroimaging modalities. Likewise, the increased Cho/Cr ratio is consistent with previous findings. TBI pathology includes breakdown of the cell membrane with an associated release of free Cho (26) and membrane synthesis associated with glial proliferation (27); this is widely observed as increased Cho signal intensity.
This study, however, did not show the same degree of alteration in the pooled metabolite ratios that were previously reported. Garnett et al (16) described a 25% increase in Cho/Cr and a 21% decrease of NAA/Cho in MTBI subjects relative to controls, and Son et al (22) reported a 39% reduction in NAA/Cr in pericontusional regions. In comparison, this study found that changes in NAA/Cr, Cho/Cr, and NAA/Cho were 4%, 7%, and 12%, respectively, relative to controls. Furthermore, there was no evidence of greater changes in individual regions or subjects. Potential reasons for these differences include subject selection, the relatively small number of subjects in each cohort, the timing of the study after injury, the degree of injury (as in the study of Son et al), and methodologic differences (eg, TE, use of inversion-recovery lipid nulling, acquisition method). A primary methodologic difference of our study was the use of volumetric MRSI. In comparison to single-voxel acquisitions, this technique enables data analysis over a large region of the brain, although with a reduced signal- to-noise ratio for each spectrum. However, by averaging over fitted metabolite results from multiple voxels at each sampled brain region, and then again over all regions, MRSI can effectively increase analytical power when diffuse alterations in tissue metabolites are anticipated.
This study indicated a trend to lower NAA/Cho ratios as a function of decreasing admission GCS score, though this was not statistically significant. Although previous studies (11, 13, 28) showed no correlation between metabolite ratios and GCS score, Garnett et al (16) reported a significant correlation between the frontal white matter NAA/Cho ratio and the GCS score. They also reported a correlation between NAA/Cho and PTA. However, their inclusion of moderate and severe injuries is likely responsible for these correlations.
Results indicated a trend to lower NAA/Cho and higher Cho/Cr for subjects reporting moderate disability, though no significant correlation was observed between any metabolite ratios and the outcomes. Correlations between early 1H MR spectroscopic measures and outcomes have been demonstrated (11, 14, 15); however, these again may largely reflect the inclusion of subjects with more severe injuries. Although this lack of correlation does not support the use of these methods for prognosis after MTBI, it should be emphasized that no correlation was found between GCS and GOS scores for this group. Therefore, this finding may largely reflect the limited number of subjects and their clinical presentation.
The interpretation of these results was based on metabolite ratios. This common approach has the advantage that a correction for partial-volume signal-intensity loss and signal-intensity calibration are not required. However, it may also diminish the magnitude of measured changes if both metabolites are similarly affected. Although increased Cr has been associated with subarachnoid hemorrhage (28), our analysis was limited to normal-appearing regions at MR imaging, and Cr concentrations would unlikely be changed in these measurements. Given this assumption and the findings of previous MR spectroscopic studies of TBI, it is apparent that changes in NAA and Cho are opposite in sign. Although additional information may be obtained by comparing normalized metabolite values, the normalization procedure is also limited by the accuracy with which the relative tissue water fraction can be measured. Given the likelihood of edema after TBI (29) and the lack of methods for the accurate calibration of extracellular water in this study, this approach was not implemented. The interpretation also assumed no changes in metabolite relaxation rates (T1 and T2) in TBI subjects relative to controls. Such changes have been reported for cytotoxic edema (30) and focal ischemia (31), though the effect of diffuse axonal injury is not known. A further simplification in the interpretation of these findings is that the relative contribution of gray matter and white matter to each selected brain region, and their relative metabolite concentrations (32) was not taken into account. Although the voxel selection procedure summed over the same anatomic region for each subject, differences in the relative tissue contributions might still have occurred. However, the combined effect of the relative tissue concentrations and volume contribution is estimated to be small compared with the measurement error.
We detected a significant alteration in metabolite ratios as a group effect but not in any individual brain region. This finding not only reflects the diffuse nature of the injury but also the relatively small degree of injury compared with the intersubject and intrasubject variability of the measurement. The variability of our control data was comparable to that reported for single-voxel MR spectroscopic studies at the same field strength. For example, the SD of the NAA/Cho ratio for white matter in the posterior frontal lobe (region 11 in Fig 2C) was 19.7%; the same ratio from an identical region in the study by Garnett et al (16) was also 19.7%.
This study represents the first application of a truly volumetric MRSI acquisition for the study of human brain injury. The results in healthy subjects demonstrate the importance of accounting for regional differences in metabolite concentrations and of making comparisons between subject groups in the same brain region. Although regional variations have been demonstrated (32–34), the use of a volumetric acquisition enabled comparisons over a brain volume larger than that of any single previous study. The observed regional variations (Fig 3) qualitatively agree with previous findings, including a reduced NAA/Cho ratio (primarily due to increased Cho) in the cerebellum and brain stem (34–36), an increased NAA/Cho ratio in posterior regions (37), and an increased NAA/Cho ratio in occipital gray matter (32, 37). The results also demonstrate that a consistent, and spatially widespread, trend of reduced NAA/Cho is seen in the average results from the TBI subjects relative to controls. The exception is the absence of differences between the two groups in the brain stem and cerebellum. Coincidentally, these areas tended to be of high spectral quality and had the smallest SDs of any brain region. This finding is consistent with clinical observations that brain stem injuries are not commonly seen in subjects with MTBI. In addition, the relative reduction of NAA/Cho in subjects with TBI was less in the central white matter and the vertex of the head.
One limitation of the volumetric MRSI method in this study is the difficulty of obtaining good quality spectra in the bases of the frontal and anterior temporal lobes. Although improvement in sampling of this region may be possible with improved localized shimming procedures and higher resolution acquisition, this problem will undoubtedly remain a challenge for the implementation of this acquisition method. That we did not detect significant changes in metabolite ratios from frontal brain regions may reflect this limitation.
Conclusions
This study shows that widespread neurochemical changes occur in brain regions that appear structurally normal after MTBI. This result is consistent with those of previous studies and with the presence of diffuse cellular level injury seen in postmortem examinations. Therefore, the use of volumetric 1H MRSI measurements in subjects with TBI remains of considerable interest for the characterization of injury. This study did not demonstrate any correlation between alterations in metabolite ratios observed with MR spectroscopy and clinical outcomes; however, this finding is not unexpected given the complex nature of this type of injury and the relatively small number of subjects. The findings do, however, warrant further study with a larger cohort of subjects and with additional clinical evaluation criteria.
Acknowledgments
We thank Diane Moribito for her assistance with the recruitment of subjects with TBI.
Footnotes
Supported by Public Health Service grants EB00207 and NS38029.
References
- Received May 2, 2003.
- Accepted after revision October 24, 2003.
- Copyright © American Society of Neuroradiology
In this issue


Jump to section
Related Articles
Cited By...
- Imaging Evidence and Recommendations for Traumatic Brain Injury: Advanced Neuro- and Neurovascular Imaging Techniques
- Evaluation of Delayed Neuronal and Axonal Damage Secondary to Moderate and Severe Traumatic Brain Injury Using Quantitative MR Imaging Techniques
- Acute metabolic brain changes following traumatic brain injury and their relevance to clinical severity and outcome