
Abstract
BACKGROUND AND PURPOSE: Endovascular embolization is an increasingly common method to treat intracerebral arteriovenous malformations (AVM). To date, however, published data are rather scarce, especially with regard to true procedure-related complications and their causes. The purpose of our study was to evaluate treatment safety and correlate anatomic results with clinical outcome by using MR imaging, including diffusion-weighted (DWI) and perfusion imaging (PI).
METHODS: We performed 50 endovascular procedures in 21 patients. Most AVMs were supratentorial, Spetzler-Martin grades II–IV. MR imaging was scheduled within 1 week before and 3 days after each treatment. MR imaging findings were correlated to digital subtraction angiography, procedure reports, and the clinical course. Outcome was graded according to the modified Rankin scale (mRS) 3–6 months after treatment.
RESULTS: In this study, 104 MR imaging examinations were performed; mean interval between the endovascular procedure and posttreatment MR imaging was 28 hours. Nine adverse events occurred in 7 patients during 8 procedures (16%), one causing a permanent deficit. New lesions were noted on MR imaging after 22/50 procedures. Ischemic lesions in 22% of the procedures, frequently located perinidally. Most lesions were small, frequently asymptomatic, and reversible (18/23). Four hematomas were found. Subacute hemorrhages developed from a vasogenic edema on 2 occasions. New lesions, including hematomas, developed between treatments in 4 patients, mainly because of progressive occlusion of the nidus or draining veins. PI overestimated the AVM nidus on most occasions, and transient worsening of the PI pattern was noted in 2 patients. Treatment-related mortality and morbidity were 0% and 14.2%, respectively (mRS 1–2).
CONCLUSIONS: Endovascular procedures are rather safe but are associated with more ischemic events and followed by less hemodynamic disturbances than previously understood. Adverse procedural events and new MR imaging lesions were generally asymptomatic and most often transient, if symptomatic. Most lesions would not have been verified without MR imaging. DWI and PI were most useful to detect and understand the cause of various complications. The most clinically important complications were caused by late venous occlusions.
Intracerebral arteriovenous malformations (AVMs) constitute an uncommon disease with a prevalence of 0.06%–0.11% and an incidence of 0.01%–0.0013%.1–3 Intracranial hemorrhage and epilepsy, the most important manifestations of AVM, are seen in 52%–71% and 23%–40% of cases, respectively.4–6 Other symptoms, such as headache and transient ischemic attacks, have been reported.6 The overall annual mortality and severe morbidity associated with AVM have been estimated to 1% and 1.5%, respectively, and increase with recurrent hemorrhage.4,5 There is still considerable controversy regarding AVMs, and a number of important issues—such as the annual risk of hemorrhage and/or rebleeding, ways of identifying AVMs at high risk of bleeding, consequences of recurrent hemorrhage, and the optimal therapeutic strategy—remain unresolved.7–11 However, because intracranial hemorrhage is the most common, as well as the most critical, complication of AVM, the general consensus is that treatment of AVM should aim at total occlusion or, if possible, complete removal to eliminate the risk of future or recurrent bleeding.
Today, AVMs can be treated by microsurgery,12–14 radiation therapy,15,16 endovascular embolizations by using liquid embolic agents,17–19 or by a combination of these methods.20,21 With additional experience, improved techniques, and the incorporation of various grading systems in patient selection, such as the surgically applicable Spetzler-Martin grades I–V,22 the overall cure rate and clinical outcomes have improved for each treatment technique.13,16,23 Nevertheless, procedure-related complications and deaths are still being reported with these methods.11,12,15,18,24 Although permanent complications are normally reported in the literature, reports of transient symptoms associated with any of the techniques are rarely published.
Of all the factors triggering the initial AVM manifestation or procedure-related complications, transient or permanent, some have been identified but are still incompletely understood. Patient age, anatomic AVM features (size, location, vessel characteristics, and associated aneurysms, etc), hemodynamic disturbances, including shear stress to the vascular wall, “steal phenomenon,” and venous outlet impairment, or mass-effect, have been explored.25–28
Recent publications emphasize the usefulness of MR imaging for improved understanding and evaluation of the safety of endovascular, neurosurgical procedures, and radiation therapy.29–31 Postprocedural MR imaging, including diffusion-weighted imaging (DWI) and, sometimes, perfusion imaging (PI), have revealed ischemic events in 10%–69% of patients who underwent endovascular therapy for intracerebral aneurysms, though most of the events were clinically silent.32–35 The aim of our study was to evaluate our procedural performances with MR imaging, including DWI and PI, before and after each treatment, and to correlate the MR findings with anatomic features, procedural events, and clinical outcomes.
Materials and Methods
The protocol was approved by the local ethics committee, and informed consent was obtained from all patients and/or their legal representatives before study enrollment.
Patient Population and Clinical Presentation
Between November 1999 and January 2003, 21 patients with intracerebral AVMs (15 men and 6 women) underwent one or more endovascular procedures, accompanied by MR imaging examinations, at our institution. The mean age was 40.7 years (range, 27–56 years). Six patients presented with intracerebral hemorrhage (ICH). One patient had an intraventricular hemorrhage (IVH), and one had an epidural hematoma (EDH). The AVM was an incidental finding in 2 patients, each with a history of subarachnoid hemorrhage (SAH) due to a ruptured saccular aneurysm. Six patients suffered from recurrent epilepsy. In the remaining 5 patients, the AVM was found incidentally on MR or CT examinations performed for a contralateral ischemic stroke in one patient and for various unrelated reasons in the others. Clinical manifestations are summarized in Table 1.
All treatments were initiated as a result of multidisciplinary consensus. Patients were enrolled prospectively, and the selection to treat by endovascular means was based on the anatomic features of the AVM, its clinical presentation and accessibility, and the estimated risks of either endovascular or surgical intervention and radiation therapy. All patients were treated within 1–6 months after the diagnosis of an AVM; however, 5 patients had undergone one or more endovascular AVM procedures before study enrolment. Three of these 5 patients presented with ICH and had previously been treated with acute targeted embolizations of one or more ruptured pseudoaneurysms for the purpose of occluding these potentially fragile structures, thereby reducing the presumed risk of early rebleeding. Because all 5 AVMs were large and the size of the residual AVM suggested that at least one or 2 additional embolizations would be required to achieve the desired result, we decided to include these patients in the study.
At the time of study enrollment, 6 patients had minor neurologic deficits representing sequelae from previous ICH in 4 patients, a minor bleed after embolization in one, and ischemic stroke in one patient. The deficits were manifested as hemianopsia in 2 patients, minor hemiparesis in one patient, dysphasia in 2, and dysphasia with dyspraxia in one patient. The remaining 15 patients had no neurologic deficits. Saccular aneurysms around the circle of Willis were found in 4 patients, all of whom are included in a similar aneurysm study at the time of this report.36
AVM Locations, Characteristics, and Spetzler-Martin Grading
Nineteen AVMs were located supratentorially and 2 infratentorially. Fourteen of the AVMs were located within a single lobe, one had an intraventricular and subependymal location, one was dural, and 5 had a mixed lobar distribution. Nine of the AVMs were considered to be of high-flow type (ie, associated with one or more intranidal AV-fistulas). AVM characteristics are described in Table 1.
The sizes of the AVMs were determined (excluding the feeding arteries and draining veins) by correlating the measurements from the corresponding digital subtraction angiography (DSA) and the MR imaging. For calculation of AVM volume, the formula of Pasqualin et al (V = d1 × d2 × d3, where V is the volume in milliliters and d1–3 are the 3 sides in centimeters) was used.37 From these measurements, the AVMs were divided into 4 subgroups: <6 mL (6), 6–10 mL (2), >11–20 mL (8), and >20 mL (5 patients).
Fourteen AVMs had cortical venous drainage (a single drainage in 4 cases and multiple draining veins in 10). One patient had a pure drainage toward the deep venous system, and 4 AVMs had a combination of cortical and deep venous drainage. Of the 2 cerebellar AVMs, both drained to the cerebellar veins; however, one of them also drained directly into the dural sigmoid sinus. Nine patients had one or more venous ectasia. The AVMs were further graded according to the surgically applicable Spetzler-Martin grade: grade I, 4; grade II, 5; grade III, 6; and grade IV, 6.
Endovascular Procedures and Routines
A Philips Integris 5000 biplanar unit (Philips Medical Systems, Best, the Netherlands) was used for all DSA and interventions. A nonionic, low-osmolar contrast agent (240 mg/mL Omnipaque, Amersham Health [GE Health Care, Oslo, Norway]) was used in all procedures. Endovascular therapy was performed under general anesthesia with a mean arterial blood pressure ranging from 90 to 120 mm Hg. The flush solution for syringes was heparinized, and the guiding catheter was connected to a continuous flush of nonheparinized NaCl solution. With a few exceptions (see below), further heparinization was not used. All patients were administered steroids (8 mg of betametasone), intravenously during the treatment and orally for 2 days after the embolizations (8 mg × 3/day). All patients were kept in the neurointensive care unit for 16–24 hours after the procedure and remained hospitalized for another 3–6 days before discharge.
A 5F catheter (Headhunter) was used for diagnostic angiographies and a 6F Envoy guiding catheter (both from Cordis Neurovascular, Johnson and Johnson, Miami Lakes, Fla) was used in all procedures. The microcatheters used were the Flowrider/Ultraflow (MicroTherapeutics [MTI], Irvine, Calif) 1.5–1.8 or the more flow-directed Magic 1.2 or 1.5 (Balt Extrusion, Montmorency, France). The Terumo (Terumo Corp, Tokyo, Japan) and the Silverspeed (MTI) were the most frequently used microwires. n-butyl 2-cyanoacrylate (n-BCA; Histoacryl, Braun Melsung, Germany) was used as an embolic agent in all but 5 procedures in which superselective injections of the liquid polymer Onyx (EV3; MTI) were made. Where the obliteration of the nidus was instantly complete or almost complete, a control angiography was performed within 3 months. Patients with incomplete AVM occlusion were referred to a center for radiation therapy.
MR Examinations
All MR imaging examinations, including DWI and PI sequences, were scheduled to be carried out within a short interval (ie, 1 week before and 3 days after) of the endovascular procedures. Repeat MR imaging was advocated for patients who deteriorated during hospitalization or between 2 endovascular procedures (one patient, see below).
MR Protocols
A Magnetom Vision 1.5T MR unit (Siemens Medical Systems, Erlangen, Germany) with maximum gradient amplitude of 25 mT/m was used in all MR examinations. Sagittal and transverse T1-weighted spin-echo (SE) sequences and transverse proton density and T2-weighted (PD/T2-weighted) turbo SE sequences with 5-mm section thickness covered the entire brain. In addition, a coronal, spoiled T2-weighted gradient echo (GE) sequence (fast low-angle shot [FLASH]) with high sensitivity to susceptibility effects was obtained. Transverse DWI was performed by using a SE echo-planar imaging (EPI) technique with diffusion-encoding gradients applied in 3 directions (section, read, and phase) with 3 b values (0, 500, and 1000 s/mm2). Imaging parameters were TE, 100 milliseconds; field of view (FOV) 230 × 230 mm2; matrix, 96 × 200; section thickness, 5 mm; gap, 1.5 mm; 20 sections; total acquisition time, 56 seconds. Mean apparent diffusion coefficient (ADC) maps, based on the 3 individual gradient directions, were calculated.
Perfusion MR imaging was performed by using dynamic susceptibility contrast MR imaging based on rapid gradient-echo EPI following intravenous injection of gadodiamide (Omniscan, Amersham Health). The contrast agent bolus, in a dose of 0.3 mmol/kg body weight, was administered by using an MR-compatible power injector at 3 mL/s. The parameters were TE, 54 milliseconds; FOV, 250 × 250 mm2; matrix, 128 × 128; transverse section thickness, 8 mm; and section gap, 0.8 mm. In the dynamic study, 9-10 sections with a total of 60 images per section were recorded with a temporal resolution of 1.65 seconds. Maps of relative regional cerebral blood volume (rCBV), relative regional cerebral blood flow (rCBF), and mean transit time (MTT) were calculated by using a method including deconvolution based on singular value decomposition (SVD).38 The arterial input function was determined from an artery in the Sylvian fissure contralateral to the AVM. Relative rCBF and rCBV maps were color coded after normalization to the relative rCBF and rCBV values of the cerebellum.
Complication Analyses, MR Imaging Evaluations, and Clinical Follow-Up
Patient files, angiographies, treatment reports, and MR examinations were reviewed. Pre- and posttreatment angiographies were evaluated by 2 interventional neuroradiologists (M.C. and B.Ra.). All adverse events, defined as any technical difficulties and complications noted during the procedure, were recorded. The MR examinations were scrutinized by 2 experienced neuroradiologists (M.C. and E.-M.L.). All pre- and immediate posttreatment MR imaging examinations were compared with respect to occurrence and extent of new lesions. The immediate posttreatment MR imaging was further compared with the subsequent pre-embolization MR imaging for patients who had multiple endovascular procedures. All lesions were noted and characterized. Special attention was paid to DWI and the extent of PI disturbances, if present, before and after treatment. Perfusion alterations were evaluated on PI by visual assessment of the baseline examination, the gray-scale images, and the color-coded maps. Asymmetry and changes of signal intensity before and after treatment were compared. New MR abnormalities were correlated with the procedural technique applied, the adverse procedural events, and the clinical course. Any clinical event during or within 1 month after treatment—minor or major, transient or permanent—that might be even remotely associated with the procedure was considered to be procedure related. All clinical evaluations during hospitalization and at follow-up visits at 6–12 months after complete cure or before radiation therapy were conducted in regular consultations with neurosurgeons at the hospital. Functional outcome was measured and graded according to the modified Rankin scale (mRS 0–6): 0, no symptoms; 1, minor symptoms; 2, some restrictions in lifestyle; 3, significant restriction; 4, partially dependent; 5, fully dependent; and 6, death.39
Results
Endovascular Treatment
Fifty endovascular procedures were performed with a total of 116 superselective microcatheterizations, followed by 108 embolizations. Ten patients underwent single endovascular procedures. In the remaining patients, ≥2 procedures (range, 2–8) were performed during the study period. The mean interval between multiple endovascular procedures was 2.7 months (range, 1–6 months). A complete and stable occlusion of the AVM by endovascular means alone was achieved in 8 patients (38%), most of whom had small AVMs. The remaining 13 patients (62%) had residual AVMs and were referred for complementary radiation therapy. The total number of endovascular procedures and the overall estimated occlusion rates, relative to AVM size, are summarized in Table 2.
Adverse Technical Events Noted during the Endovascular Procedure
No adverse periprocedural events were noted in 14 patients (67%) or during 42/50 (84%) procedures. Nine adverse technical events occurred in 7 patients during 8 procedures (ie, 16% [8/50]) (Table 3). Four of the events were extravasations, and 3 were partial artery occlusions (one intentional reflux of glue along the catheter and 2 adverse migrations of glue, one distally through arterial-arterial anastomosis and one sudden reflux). One transient thromboembolus into the MCA (apart from the vascular territory of the AVM) was observed, as well as one glued microcatheter (combined with the intentional reflux of glue mentioned above). Two extravasations took place in different procedures in one patient. Two events were observed in one patient during the same procedure. The remaining 5 events occurred in 5 different patients. One extravasation was caused by direct catheter perforation, whereas the others occurred during superselective injection of contrast agent. The tip of the catheter was found to be stuck and wedged in a small, barely visible arterial branch.
Complication Management during the Procedures
All 4 extravasations occurred in close relation to the nidus and were detected immediately. The site of the perforation was promptly sealed by superselective injection of n-BCA through the microcatheter.40 Three of the four patients with arterial flow reduction (clot and adverse migration of glue) received an intravenous bolus of heparin. In the one patient with a glued microcatheter, the distal shaft of the catheter was stretched, cut, and left floating in the femoral artery at the puncture site. Although this patient received a heparin bolus at the start, no additional anticoagulant was given during and after the procedure.
MR Examinations
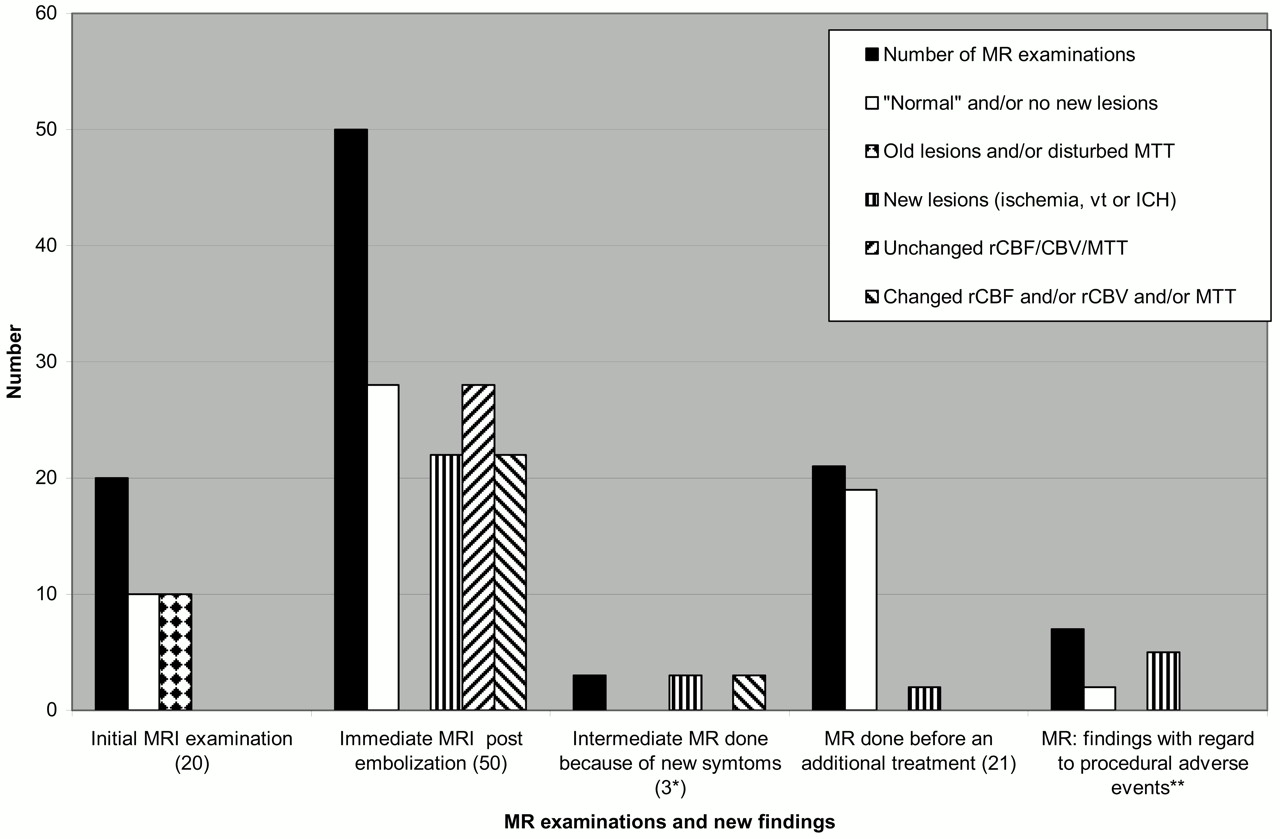
Altogether 104 MR examinations were performed (41 pretreatment, 50 posttreatment, 3 intermediate posttreatment, and 10 follow-up examinations). On 9 occasions, pre-embolization MR imaging could not be performed for logistic reasons or because of technical problems within the MR unit. For similar reasons, the MR examinations were carried out 6–9 days before embolization on 3 occasions. The mean interval between the start of the endovascular procedure and the remaining 38 pre- and 50 posttreatment MR examinations was 21 hours (range, 1.5–72 hours) and 28 hours (range, 18–70 hours), respectively. The MR findings are summarized in Fig 1 and Table 3. The embolic agents (n-BCA and Onyx) caused virtually no artifacts on MR imaging and had signal intensities similar to that of fat on T1-weighted SE and T2-weighted turbo SE sequences.
Initial MR Imaging: Before the First Endovascular Procedure
Twenty MR imaging examinations were performed in 21 patients. Of the 7 patients presenting with ICH, 6 had a residual parenchymatous lesion containing blood-degradation products. An organized clot within large, occluded venous ectasia was found adjacent to the AVM in 2 patients. In one patient, vasogenic edema surrounded an enlarged draining vein. A cerebral infarction was found in the patient who presented with a recent stroke from an occlusive angiopathy disorder.
Baseline DWI did not reveal recent ischemia in any of the patients. Three AVMs were too small to be visualized on PI. Seventeen perfusion MR imagings (85%) were abnormal with increased rCBF and rCBV at the site of the AVM as well as along the pathway of the draining veins (Fig 2). The extent of rCBF and rCBV increase within each patient was almost always approximately similar. No major differences were noted between rCBF and rCBV patterns in other areas of the ipsilateral parenchyma versus the contralateral hemisphere, with 2 exceptions. Thus, MTT did not reveal any obvious hemodynamic disturbances in 18/20 MR imagings (90%). Perfusion changes with increased MTT before treatment were seen in 2 patients, engaging large areas of the ipsilateral brain circulation in one patient, and both hemispheres in the other who had a history of ischemic stroke.
MR Imaging: Immediate Postendovascular or Final Examinations
In 6 patients (29%), no new abnormalities were detected throughout the study. After 22 procedures (44%), 43 new abnormalities were found on MR imaging, including DWI, represented by a combination of different types of lesions in 8/22 procedures. An intracerebral hematoma was seen in 4 patients, 2 with known extravasations and 2 without any recognized procedural event. Although no evident hemorrhage was detected on immediate MR imaging, minor vasogenic edema was observed around the sites of embolization of the AVM in 4 patients; however, CT, performed 3 days after the endovascular procedure, detected a minor hemorrhage at the site of the vasogenic edema in 2 of these patients (Fig 3). All hematomas resulted in small irreversible parenchymal lesions. Procedural adverse events caused 6 new MR findings on 5 occasions (4 patients). The pre-existing vasogenic edema shown in one patient, and a similar edema that evolved between treatments in another patient, disappeared or decreased after partial nidus occlusion.
DWI
Thirty-five hyperintense spots with corresponding decrease of ADC were found on DWI after 18 procedures. All but one were ipsilateral to the AVM. Fifteen spots (43%) were small (< 4 mm), 11 (31%) measured 4–10 mm, 5 (14%) were 11–20 mm, and another 4 (12%) were >20 mm. Twenty-three spots (66%) were regarded as true ischemic lesions, 8 (22%) represented stagnation of blood/clots within veins, and 4 (12%) were of uncertain origin (ischemic lesion or intravenous clot). Type, number, location, and distribution of new DWI abnormalities are described in detail in Table 3. A hemorrhagic transformation was noted in one of the ischemic lesions.
Six of 23 ischemic lesions (26%) were considered to be associated with diagnostic angiographies performed immediately before and after the embolization procedure. Some DWI lesions were larger than PI defects, whereas most lesions were either too small or located too closely to the AVM to be recognized by PI. Three large lesions had a corresponding decrease of rCBF/rCBV on PI without DWI/PI mismatch. Only 5 ischemic lesions left permanent infarcts.
PI
A correlation between pre- and post-PI could be made after 40 procedures. A perfusion defect within the embolized portion of the nidus was seen in most patients.
Decreases in rCBF and rCBV within and around the AVM were found after 19/40 procedures. In 3 cases, major reduction of both was demonstrated immediately. rCBF and rCBV remained unchanged after 19/40 procedures. No prolongation of MTT was observed immediately after treatment in any patient. Immediate alterations in rCBF and/or rCBV with secondary ipsilateral decrease of MTT were noted in one patient and bilaterally in one patient; in both patients PI had demonstrated prolonged MTT before embolization. The final MR imaging revealed decreased AVM size and perfusion disturbances in all treated AVMs (Fig 2).
New MR Imaging Patterns, including DWI and PI, Evolving between Procedures
New MR imaging abnormalities were noted between treatments in 3 patients. Pure progressive venous outlet thrombosis associated with an “asymptomatic” ICH (subacute hematoma in resolution) was found in one patient and a severely disturbed perfusion pattern with increased MTT in a second (Fig 4). The latter occurred contralaterally to the embolized AVM. Following a week of conservative medication therapy and regular MR imaging monitoring, PI ultimately returned to normal (see discussion below). A more extensive thrombosis involving the feeding artery, the nidus, and, in particular, the draining vein, was seen in the third patient and resulted in vasogenic edema in the white matter with a matching PI defect (Fig 5).
Clinical Symptoms and Course
Symptoms arising immediately after the procedure or during hospitalization were seen in 7/50 procedures. Sixteen patients (76%) awakened from anesthesia clinically unchanged or asymptomatic (ie, the embolizations were clinically “silent”). Five patients (14%) suffered from new symptoms immediately after treatment, one of them after each of 2 procedures. Two patients, initially asymptomatic, developed symptoms during the postoperative hospital stay. Three patients (one with ICH; see below) developed symptoms in the interval between treatments, and, in one case, symptoms occurred shortly after discharge. Symptoms and clinical course are summarized in Table 4. Of the 9 procedural adverse events, 5 were asymptomatic and 4 were symptomatic, though transient on 3 occasions.
Most symptoms were transient, and only 3 patients were left with minor, permanent deficits. Of all ischemic lesions, only one (ischemia combined with hemorrhagic transformation (in the patient with the glued catheter) caused permanent deficits, manifested as moderate aggravation of pre-existing hemianopsia. One patient with ICH, evolving from a vasogenic edema, developed left-sided hyperesthesia (allodynia). One patient had recurrent ICH 2.5 months after the second embolization (2 weeks before a scheduled retreatment). No MR imaging was done at the time. The AVM was completely occluded by embolization alone and the patient has shown remarkable recovery. Modified Rankin scale scores related to the embolizations alone, before radiation therapy, and/or within 12 months after treatment were graded as 0 in 18 patients, 1 in one patient, and 2 in 2 patients. Symptoms, clinical course, and final outcome are described in Table 5.
Discussion
The remarkable development seen within the field of interventional neuroradiology during the past 2 decades has generated increased interest and activity worldwide. New techniques and devices have improved the possibilities for successful embolizations of intracranial AVM, alone or in combination with other therapeutic techniques.11,13,16,23 In view of the number of AVM patients treated by embolizations during the past decades, however, the overall published data on this topic are surprisingly scarce. Data from major, well-conducted studies describe ranges for procedure-related mortality and morbidity of 1%–6.0% and 4.5%–33% of cases, respectively;17,24,41 however, Wikholm et al provide a compelling demonstration of improved results with increased experience.23 The authors compared the outcomes of 2 patient groups, one treated between 1987 and 1988, the other between 1992 and 1993. The overall complication rate was reduced from 52% to 23% and outcomes rated as excellent or good increased from 56% to 89% in the more recent group. It appears reasonable to assume that these trends have continued.
The final outcome, described in the literature, has typically been based on clinical assessments made >3–4 weeks after the final endovascular treatment, and transient symptoms have received little attention. In a previous publication including the report of one patient with an AVM, we proposed that DWI and PI may be useful for the evaluation of treatment results and complications.29 A recent report by Guo et al31 described the use of perfusion-MR imaging on patients before and after radiation therapy. Thus far, we have failed to locate any published reports on AVM patients monitored by regular CT or MR imaging in conjunction with embolization. The current study was designed to evaluate and scrutinize the safety of endovascular treatment by consistently using MR imaging with special attention to DWI and PI and correlate its diagnostic capacity with clinical manifestations (transient or permanent) and procedural events.
We reviewed 104 MR examinations, including DWI and PI sequences, performed in close connection to the endovascular procedures. The records of 21 patients were reviewed. Complete occlusion was achieved in 8 patients and the remaining patients underwent radiation therapy. New symptoms occurred in 11 patients at the end of 7 procedures or between procedures. Only 3 patients developed permanent deficits, which suggests that the frequency of reversible symptoms may have been relatively high. Of these 3 patients, one developed a late recurrent hemorrhage for which a definite causal relation between treatment and bleed could not be established. Mortality and morbidity associated with the endovascular treatment amounted to 0% and 14.2%, respectively (mRS 1–2), which is comparable with other published data.23,24
Adverse and Technical Events during the Procedure
Of 9 technical adverse events noted in 7 patients following 8 procedures (8/50), one resulted in a permanent deficit. The 4 extravasations took place in small perforators close to the nidus, all occurring while the more braided and over-the-wire dependent microcatheters were being used. This type of catheter offers better access to distal locations and small vessels but is stiffer and less floppy at the tip and induces higher axial force during catheterization than the more flow-dependent microcatheters. Our number of perforations, however, is rather high, and we currently prefer to use the softer, flow-dependent catheters in similar situations.
MR Imaging and DWI
The mean interval between the start of treatment and the immediate postprocedural MR imaging was 28 hours, representing a phase interpreted as acute or subacute in recent publications on DWI in the stroke population.41–44 Immediate posttreatment MR imagings were abnormal (AVM and old lesions excluded) in 22/50 procedures (44%). Of the new “lesions,” 43/60 (72%) were found in immediate posttreatment MR imagings, all related to the endovascular procedures. Seventeen new lesions (mainly venous clots) occurred in 3 patients between treatments—ie, after the previous postprocedural MR imaging, suggesting a risk of delayed complications (Figs 4 and 5).
Ischemic Events
MR-DWI is most sensitive to ischemic lesion at an early state.41–45 Multiple, often asymptomatic ischemic lesions, detected by DWI after endovascular procedures, have been reported in recent studies of intracranial aneurysms, with ischemic events noted in 10%–69% of patients.32–35 In our recent work on aneurysms, we found ischemic lesions in >40% of the procedures, notably in patients presenting with SAH.36 In the present study, ischemic events were less frequent, seen in 22% of the procedures (in 9 patients). Of 35 lesions detected on immediate postprocedural DWI, 23 (66%) were of ischemic origin, 8 (23%) represented perinidal venous clots, and 4 (11%) were of unclear origin. Four lesions found on DWI (b = 1000 s/mm2) remained undetected on the ADC maps. In the past, we proposed that the small size of the lesions (≤2 mm diameter), and their close relation to the CSF (high signal intensity on ADC and low or no signal intensity on DWI) combined with poor image resolution and suboptimal contrast-to-noise ratio may have explained our failure to locate the corresponding lesions on the ADC maps.36
It is interesting to note that almost 40% (9/23) of the ischemic lesions were found in close proximity to the AVM nidus, perinidally. These lesions were generally large (>10 mm diameter) and consistently associated with the superselective injection of glue. Two lesions were believed to be caused by the adverse migration of glue and 2 lesions (one <10 mm and one >10 mm) developed from the arteries occluded by glue for the purpose of sealing the site of extravasations. On 2 occasions, embolizations were done in enlarged feeders supplying high-flow fistulas. Although the feeders were initially patent, MR imaging detected progressive thrombosis with subsequent ischemia along their pathways. The 3 remaining perinidal ischemic lesions were thought to be caused by occlusion of small perforators and/or arteries arising from perforators close to the nidus, thus supplying the nidus as well as the surrounding parenchyma. This type of event can be avoided to some extent by applying the embolizations close to the nidus and in full flow control (the catheter wedged to the vessel wall). Under less-favorable conditions, however, AVMs are fed primarily by small perforating arteries. This is seen especially after previous embolizations, as was the case in the latter 3 situations described above.
One large ischemic lesion with hemorrhagic transformation, found distal to the nidus, was induced by a combination of reflux of the embolic agent (Onyx) and a glued catheter. We decided to leave the catheter in place knowing that this might involve a slight increase in the risk of ischemia, as described by Debrun et al.46 The remaining ischemic lesions were mostly small, almost invariably located distally of or apart from the treated AVM. Six of them were considered to be associated with the diagnostic angiography. Data from recent DWI studies suggest that ischemic events occur in as many as 25% of patients during DSA.47 Although commonly mild and asymptomatic, these complications may be associated with devastating consequences.
The value of using DWI and PI in combination is well known, not the least for evaluation of tissue at risk (the penumbra) and prediction of ischemic stroke outcome.48–51 Most of our ischemic lesions detected on DWI were comparable in size to, or larger than, those seen on PI. Few patients were left with permanent infarcts, despite a distinct decrease in ADC. Similar patterns, often involving moderately decreased ADC, have been described and interpreted as signs of early reperfusion and lesion reversibility.42,45 It is conceivable that the location of many lesions in the perinidal area with high-flow and perinidal angiogenesis may have provided favorable conditions for reperfusion. This might explain the common findings of minor and short-lasting deficits in the presence of relatively extensive lesions as well as the observation that most lesions, in particular those located perinidally, appeared to be more or less reversible (Fig 6). In addition, some of the lesions might be of venous rather than arterial origin. Recent reports have suggested that restricted diffusion and cytotoxic edema may occur in venous thrombosis, though with better options for reversibility than arterial stroke, probably due to less impairment on local perfusion and cell membrane function.52,53
Venous Thrombosis and Related Hemorrhage
In 2 patients, venous thrombosis was seen at the time of clinical presentation of the high-flow AVM and before the first embolization. On 8 occasions, venous clotting was recognized intra- or perinidally on posttreatment MR imaging. Three patients who developed progressive cortical and/or deep venous occlusions between treatments had undergone partial embolizations of high-flow AVMs with the veins left patent. One of these patients suffered a transient episode of headache and uncoordination 16 days after treatment but did not seek medical attention and hence did not undergo MR imaging examination. On the subsequent MR imaging before the second embolization 6 weeks later, the thrombosis was detected along with a subacute hematoma in resolution. Delayed venous thrombosis is a potential complication to endovascular treatment of AVMs.54 The other 2 patients are discussed below.
It is interesting to note that most venous clots, whether acute or subacute, showed DWI (and ADC) signal intensity patterns that were barely distinguishable from those seen with ischemic lesions. Correlating the DWI findings with the corresponding morphologic MR imaging (subacute clots are hyperintense on T1-weighted images) and DSA enabled us to confirm the location of these lesions and conclude that they did not represent ischemic events. Clots were generally thinner and more tubular in appearance than ischemic lesions. Even the central portion of the hematoma had signal intensity similar to that of an ischemic lesion. Each hematoma, however, was surrounded by a black rim of hemosiderin on FLASH and T2-weighted images, which is consistent with findings reported elsewhere.55,56
Repeat MR examinations allowed us to follow the change in DWI signal intensity pattern over time. The process of “normalization” differed significantly between the true ischemic lesions and the clots. The ischemic lesions seen on DWI consistently disappeared between examinations, whereas the diffusion pattern (high signal intensity on DWI and low on ADC maps) tended to remain unchanged for prolonged periods of time when representing a hematoma or clot in a draining vein. “Normalization” occurred especially late in clots and remained unchanged for several months in some veins.
Ischemic events and perinidal venous thrombosis in conjunction with embolization of intracerebral AVMs appear to be more frequent than previously understood.
Most ischemic episodes are asymptomatic or accompanied by transient symptoms and therefore not reported. Furthermore, most lesions are unlikely to be detected by CT or T2-weighted MR imaging alone for several reasons, among them DWI is known to be more sensitive to acute ischemia than CT and ordinary SE sequences.43,44 MR imaging is also less likely than CT to be disturbed by artifacts from the embolic agents (Fig 6).29 Hence, because of their size and/or the concealing effect of extensive artifacts induced by the glue (n-BCA, Onyx), most small peripheral lesions and large perinidal ischemic lesions would have escaped detection by CT. Consequently, the various mechanisms underlying the transient or permanent deficits resulting from embolization-related ischemic events can be identified and distinguished only by the extensive use of MR, including DWI. New multidetector CT units that use thin sections may, however, overcome some of these limitations.
Vasogenic Edema and Hemorrhage
Vasogenic edema surrounding a draining vein was found in one patient before treatment and resolved after embolizations and shunt reduction. Although the procedures were uneventful, vasogenic edema appeared around the nidus on MR imaging immediately after treatment in 4 patients and between treatments in one patient with a progressive venous occlusion (Fig 5). Perfusion was decreased in the area of edema. The edema was initially asymptomatic in the first 4 patients. Three days later, 2 patients developed paresthesia and hemiparesis, respectively, both transient. In one of the patients, however, allodynia developed later. In each of the 2 patients, postprocedural MR imaging, including FLASH images, failed to visualize a hemorrhagic component, though a minor hematoma organized around the AVM nidus was revealed on CT performed 2 days later (Fig 3). However, the virtually identical appearances of the susceptibility artifacts generated by glue and hemorrhage may explain the failure of FLASH sequences to identify the hemorrhage.
The vasogenic edema may also have reflected a minimal vascular tear with a slowly progressing hemorrhage that initially went unnoticed. Alternatively, it may have served as a precursor for hemorrhage. Three patients with vasogenic edema did not show any bleeding. In all 5 patients, a minimal volume of glue had entered into the draining veins of the AVM. The immediate postprocedural DSA showed no interference with the venous drainage, though in one case the dominant draining vein was not opacified afterward. We believe that vasogenic edema may be caused by venous congestion with or without venous thrombosis and that it may be associated with an increased risk of hemorrhage, especially in high-flow AVMs.57
Early asymptomatic hematomas showing typical patterns on MR imaging, including DWI, were seen in 2 patients subsequent to uneventful procedures.55,56 The bleeding may have been caused by a vascular tear associated with the retraction of the catheter or by overextension of the nidus/vessel during embolization.
PI
To make an exact definition of the nidus on the PI proved to be extremely difficult, in part because the perfusion disturbances almost invariably exceeded the size of the AVM. The increases in rCBF and rCBV were similar and correlated more to the distribution of the draining veins than to the feeding arteries. Whenever the cortical and draining veins were multiple and diverging toward a long extension of the draining dural sinus, the area of increased perfusion tended to be larger than the size of the AVM (ie, overestimated). Hence, it was almost impossible to evaluate the perfusion pattern in the parenchyma located in close proximity to the nidus or between the draining veins (Fig 2). With few exceptions, no major disturbances of rCBF/rCBV or MTT were found in the parenchyma distally or contralaterally to the AVM before or immediately after treatment. These observations do conflict with the conclusions of Guo et al.31
Immediate decrease of rCBV and rCBF close to the AVM was seen in only 48% of the procedures, mostly following total or near-total AVM occlusion and reduction of the shunt. In another 48%, no immediate change was noted. This is not surprising, in light of the partial reduction of the nidus and the regular patency of the veins without instant adaptation (lumen reduction) to the reduced flow.
Pretreatment MTTs of 2 patients were abnormal. In one patient, the high-flow AVM was drained by a venous ectasia associated with a functional stenosis at the passage through the dura into the superior sagittal sinus. Instant normalization with increased rCBF and decreased rCBV, as well as MTT (MTT = rCBV/rCBF), were noted after treatment. This may be explained by a shunt reduction resulting in a decrease of the pressure in the venous system. In another patient, the perfusion pattern was disturbed with prolonged MTT in both hemispheres because of an underlying frontal AVM and bilateral vascular occlusions within the circle of Willis (a Moyamoya-like appearance) before embolization. The right-sided high-flow AVM was fed by the left ICA through the anterior communicating artery and by retrograde flow from pial anastomosis. Because a connection between the stroke and the AVM could not be ruled out, we decided to embolize the fistula, reduce the size of the nidus, and, if possible, improve the perfusion in both hemispheres. Posttreatment MTT was improved bilaterally. The improvement, however, was more pronounced contralateral to the AVM. In addition, we found that the nidus could be defined more precisely. In an attempt to comprehend our observation fully, one of us (R.W.) confirmed our visual impression by making additional measurements of the MTT bilaterally before and after treatment.58
Revascularization or spontaneous AVM thrombosis, depicted as an increased or decreased perfusion pattern around the nidus, developed during the course of 7 procedures. In the latter case, the decrease in rCBV and rCBF indicated that the draining veins had adapted to the reduced shunt or become part of the veins draining the normal brain.
Two patients (discussed above) with venous thrombosis progressing between the treatments showed impaired perfusion. In the patient with extensive vasogenic edema, perfusion was decreased (both rCBF and rCBV). Following treatment, however, the edema was almost totally reabsorbed and the PI ameliorated (Fig 5). Plausibly, the edema was caused by locally increased perfusion pressure, induced by the venous outflow obstruction, that was eliminated instantly with the reduction of the AVM shunt. The second patient presented with minor left-sided symptoms 3 weeks after an uneventful treatment of a high-flow AVM in the left cerebral hemisphere. Although no signs of ischemia were detected on DWI, PI revealed a severely disturbed and prolonged MTT (reduced rCBF and moderately increased rCBV) in the right hemisphere (Fig 4). Re-evaluation of the postprocedural DSA confirmed patent vessels with the draining veins free from stagnation and glue. Following treatment with intravenous heparin and hypervolemic hemodilution, the patient became asymptomatic and the PI pattern was almost normalized within 9 days.
Because, in this patient, the brain could not compensate for the diminished perfusion by progressive vasodilation, we assume that rCBF had begun to fall. The compensatory vasodilation in response to increased rCBV, normally seen in arterial occlusions, appears to be less pronounced with hypoperfusion emanating from a venous occlusion, probably because the venous system is then forced to work against a higher pressure gradient.
Although our understanding of the complex pattern of cerebral autoregulation and PI findings is still incomplete, we could nevertheless use the information from PI to estimate the degree of variations in cerebral perfusion and initiate appropriate treatment.
Specific perfusion patterns indicating the presence of steal phenomena, reported in some recent publications on AVM, could not be found in the present study.31 In accordance with other investigators, we question the theory of arterial hypoperfusion causing a steal phenomenon around an AVM.59
Although this was a single-center study involving a relatively small number of patients, we believe that the results indicate an involvement of the venous system in AVMs beyond the realm of mere complications.28 Although the morphologic and/or clinical manifestations of the complications vary considerably in our study, they correspond to those generally seen in patients presenting with an AVM. It is our understanding that the extent of venous obstruction may vary over time and might sometimes be induced by spontaneous thrombosis, especially in high-flow AVMs, with or without venous ectasia. It may trigger an elevation of the mean vascular pressure and induce either hypoperfusion in the surrounding parenchyma or increased stress on the fragile vessel, already involuted by high-flow angiopathy, and in the nidus.
For these reasons, we are adopting a more favorable approach to postprocedural anticoagulation therapy for patients with conditions such as hypercoagulation disorders, high-flow AVMs, venous ectasia, and functional stenosis. The purpose of such therapy is to prevent rapidly progressive thrombosis and reduce the risk of ischemia and late bleeding. So far, our results have been positive and without any reports of adverse events.
Conclusion
MR imaging with DWI and PI can contribute significantly to our understanding of transient and permanent neurologic deficits following AVM treatment. Most symptoms, including the transient ones, are associated with morphologic lesions on MR imaging with DWI and PI. Endovascular procedures appear to be associated with more ischemic events and followed by less-immediate hemodynamic disturbances than previously understood. Ischemic lesions frequently had a perinidal location and tended to be reversible. The overall information obtained by the consistent use of DWI and PI proved to be useful in our efforts to develop optimal management strategies, especially in patients with complex disorders or late procedural complications. The venous system appears to play a prominent part in the course of AVMs as well as in the complications associated with their endovascular therapy.
Furthermore, our observations may have the potential to improve the understanding of some complications related to surgery and radiation therapy in AVM. Nevertheless, further research is required.

MR imaging examinations during the study. MTT indicates mean transit time; rCBF/CBV, regional cerebral blood flow/volume; Vt, venous thrombosis; ICH, intracerebral hemorrhage. *All 3 examinations in one patient. **Included in the 22 postprocedural MRI with new MR lesions. The 10 follow-up examinations are not included in this figure.
{/GRAPH;zj4001060262004a;comptd;;center;stack}

Parieto-occipital AVM before and after treatment.
A and B, Left internal carotid artery (ICA) angiograms in frontal and lateral projections demonstrating a parieto-occipital high-flow AVM with multiple feeders and cortical veins draining to the superior sagittal sinus (pre-embolization).
C and D, Axial rCBFs illustrating the increased perfusion in the AVM nidus (arrow) as well as in the widespread distribution of the cortical draining veins before treatment.
E and F, Almost corresponding rCBFs made after 2 uneventful sessions of embolization. The images show a decrease in AVM nidus size and rCBF in the area of the previously enlarged and draining veins. The patient was then sent for subsequent radiation therapy.

Patient with a small temporal AVM.
A and B, Frontal projections of internal carotid angiogram done before and after an uneventful embolization. One of 2 draining veins is patent after the treatment.
C and D, Illustrate the cast of glue on unsubtracted DSA and on coronal MR (2D FLASH, performed 26 hours after treatment). The susceptibility artifacts caused by the glue are well illustrated but an associated hematoma could not be definitely defined.
E–G, Axial MR (T2-weighted, DWI b 1000, and ADC maps) performed after treatment show a vasogenic edema in the surroundings of the AVM nidus (arrowhead).
H, Axial CT, performed 2 days later in conjunction with sudden onset of minor symptoms, shows a small hematoma in the area of previous edema. The AVM showed a complete and spontaneous occlusion at follow-up.


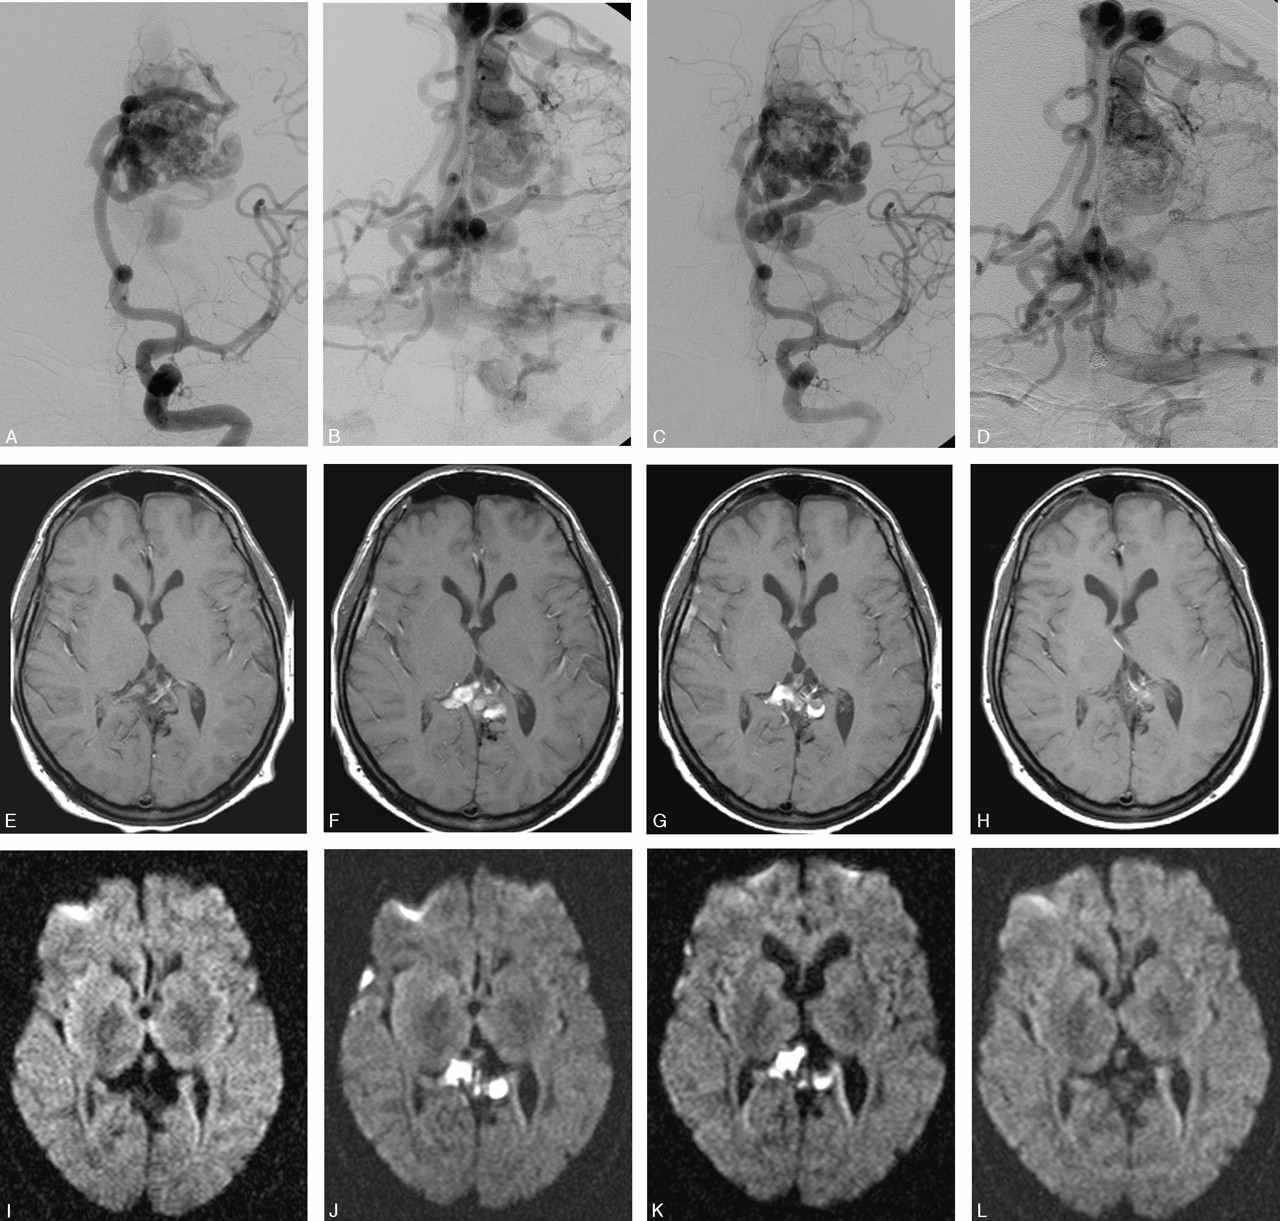
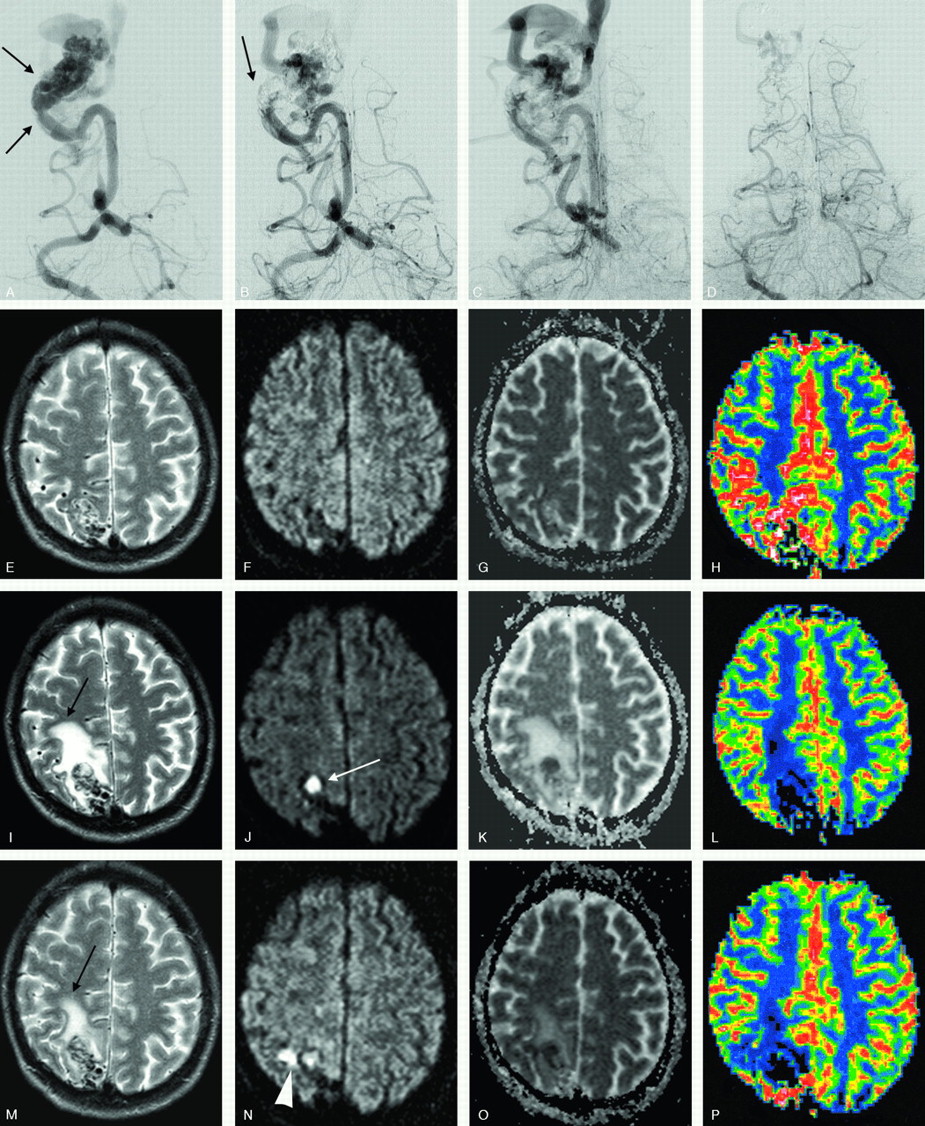
Parietal high-flow AVM with deep and bilateral cortical drainage.
A–D, Frontal left internal carotid angiogram, early and late phase, before and after the second embolization. Patent venous drainage is seen after the treatment.
E–L, Axial MR (E–H, T1-weighted, and I–L, DWI [b 1000]) immediately posttreatment, at 23 days, 35 days after treatment, and before a third treatment, 3 months later. The images illustrate the development of venous thrombosis 3 weeks after treatment in the deep and contralateral cortical veins with a complete resolution at follow-up.
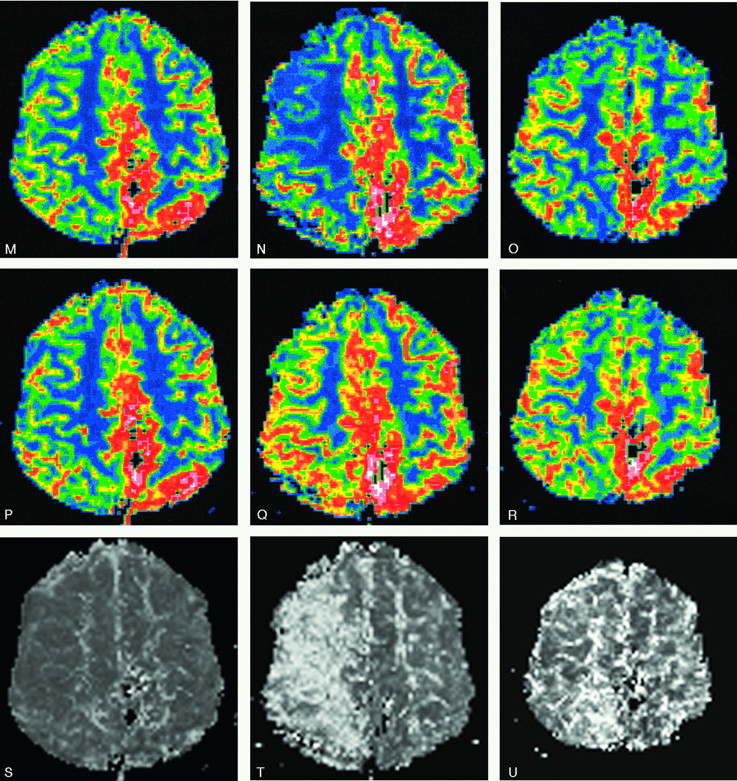
M–U, rCBF (M–O) and rCBV (P–R) with the corresponding MTT (S–U): unchanged PI images after treatment (left column) are followed by a dramatic increase in MTT (severe drop in rCBF with a mild rCBV increase) 3 weeks later (middle column). A slow but almost total normalization of PI pattern was seen 9 days later (ie, after hypervolemic hemodilution) (right column). The patient was left with no symptoms.

Occipital AVM before and after treatment.
A, Frontal right vertebral angiogram demonstrates a small, high-flow, parieto-occipital AVM with an enlarged feeder supplying 2 intranidal fistulas (arrows) before embolization.
B and C, Same projection after partial embolization. Glue can be seen at the site of the fistulas, and the venous drainage remained patent.
D, DSA, performed 6 weeks later (same projection) in conjunction with and before an additional embolization. A spontaneous occlusion of the feeder supplying the fistula is noted with a partial reduction of the nidus. The vein is still patent but reduced in size.
E–P, Axial T2-weighted, DWI, ADC maps, and rCBF done after the first embolization (E–H), before (I–L), and after (M–P) the second treatment. A vasogenic edema (black arrow) evolved in between the treatments, because of a spontaneous thrombosis of the feeder, nidus plus draining vein (white arrow), and decreased immediately after the second embolization. A small, perinidal ischemic lesion is seen after the last treatment (arrowhead). The patient experienced minor and transient headaches in between the embolizations.

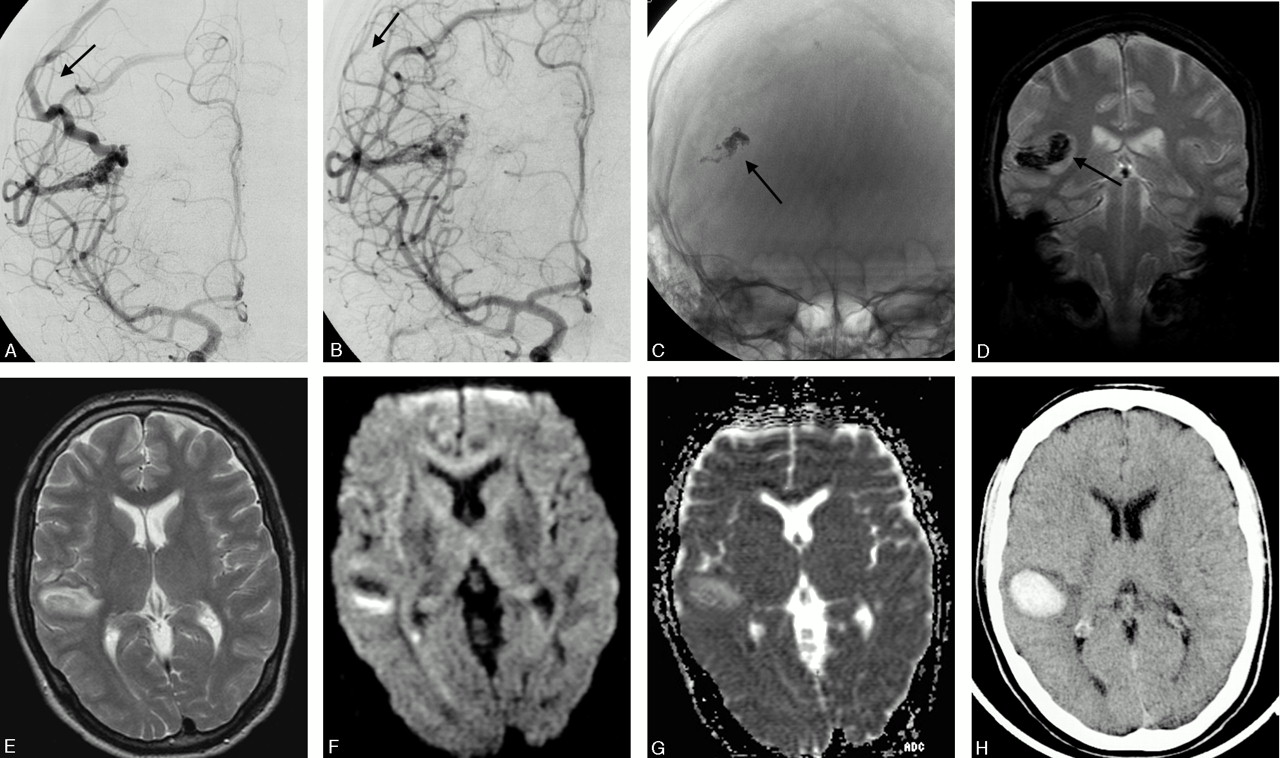
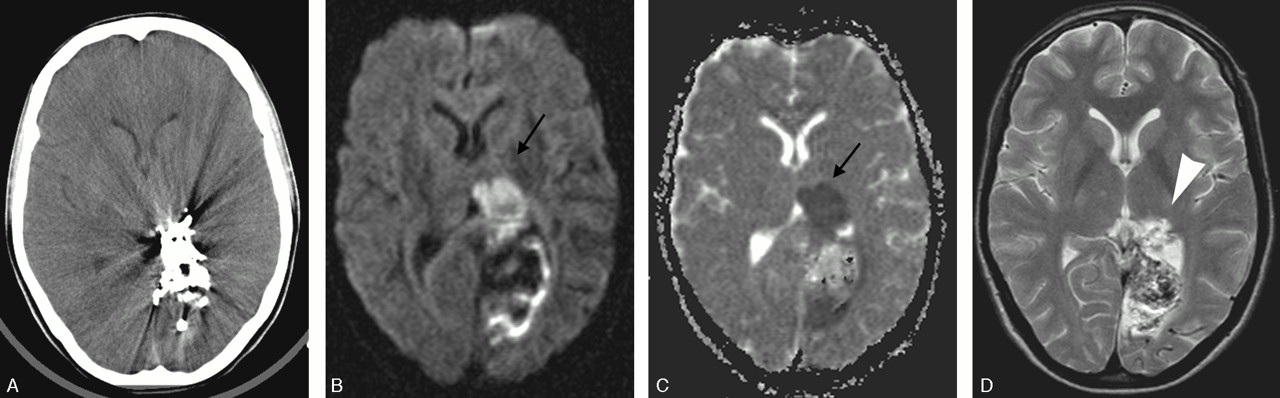
Patient with an occipital AVM. Procedure-related technical events occurred during treatment (reflux of glue and a glued catheter).
A, Axial CT performed the day after treatment illustrates the severe artifacts caused by the glue, but no obvious ischemic lesion is noted.
B and C, Corresponding sections on postprocedural MR-DWI/ADC demonstrate a rather large ischemic lesion (arrows) within the left thalamic nucleus (not seen on the CT image).
D, Axial T2-weighted MR image at follow-up shows a small and permanent infarct in the posterior portion of the left thalamus (arrowhead).
AVM description
AVM treatment; number of endovascular procedures and occlusion rate/patient
Procedural adverse events (technical events)
New lesions on MRI/DWI posttreatment and in between treatments (type of lesion, number, size, and location)
Signs and symptoms, clinical course, and final outcome
Footnotes
This work was supported by grant from the Faculty of Medicine Lund University and the County Council of Medical Research in South Sweden.
References
- Received March 17, 2005.
- Accepted after revision June 3, 2005.
- Copyright © American Society of Neuroradiology
In this issue


Jump to section
Related Articles
Cited By...
- Selection of Patients for Treatment of Brain Arteriovenous Malformations by the Transvenous Approach: Relationship with Venous Anatomy and Risk of Hemorrhagic Complications
- Complications of Endovascular Treatments for Brain Arteriovenous Malformations: A Nationwide Surveillance
- Neurological outcomes and cure rates of embolization of brain arteriovenous malformations with n-butyl cyanoacrylate or Onyx: a meta-analysis
- Hemorrhagic Complications after Endovascular Treatment of Cerebral Arteriovenous Malformations
- A Translational Paradigm for the Preclinical Evaluation of the Stroke Neuroprotectant Tat-NR2B9c in Gyrencephalic Nonhuman Primates
- Microsurgical retrieval of an endovascular microcatheter trapped during Onyx embolization of a cerebral arteriovenous malformation
- Brain Arteriovenous Malformation Treatment Using a Combination of Onyx and a New Detachable Tip Microcatheter, SONIC: Short-Term Results
- Territorial and Microvascular Perfusion Impairment in Brain Arteriovenous Malformations