
Abstract
PURPOSE: The purpose of this study was to evaluate the cerebral hemodynamic change in the hyperacute stage of cerebral fat embolism induced by triolein emulsion, by using MR perfusion imaging in cat brains.
METHODS: By using the femoral arterial approach, the internal carotid arteries of 14 cats were infused with an emulsion of triolein 0.05 mL. T2-weighted (T2WI), diffusion-weighted (DWI), apparent diffusion coefficient (ADC) map, perfusion-weighted (PWI), and gadolinium-enhanced T1-weighted (Gd-T1WI) images were obtained serially at 30 minutes and 2, 4, and 6 hours after infusion. The MR images were evaluated qualitatively and quantitatively. Qualitative evaluation was performed by assessing the signal intensity of the serial MR images. Quantitative assessment was performed by comparing the signal-intensity ratio (SIR) of the lesions to the contralateral normal side calculated on T2WIs, Gd-T1WIs, DWIs, and ADC maps at each acquisition time and by comparing the relative cerebral blood volume (rCBV), cerebral blood flow (CBF), and mean transit times (MTT) of the lesions to the contralateral normal side calculated on PWI.
RESULTS: In the qualitative evaluation of the MR images, the lesions showed hyperintensity on T2WIs, enhancement on the Gd-T1WIs, and isointensity on DWIs and the ADC maps. In the quantitative studies, SIRs on the Gd-T1WIs, DWIs, and ADC maps peaked at 2 hours after infusion. The SIRs on the T2WIs peaked at 4 hours after infusion and decreased thereafter. On PWIs, the rCBV, rCBF, and MTT of the lesion showed no significant difference from the contralateral normal side (P = .09, .30, and .13, respectively) and showed no significant change of time course (P = .17, .31, and .66, respectively).
CONCLUSION: The embolized lesions induced by triolein emulsion showed no significant difference in cerebral hemodynamic parameters from those on the contralateral normal side. The result may suggest that consideration of the hemodynamic factor of embolized lesions is not necessary in further studies of the blood-brain barrier with triolein emulsion.
Clinical cerebral fat embolism shows reversible and/or irreversible change in MR images and on pathology.1,2 Experimental cerebral fat embolism by a single injection of bolus fat also shows both reversible and irreversible findings in the same cat brain.3,4 According to Robinson and Soloway,5 fat embolism depends upon many factors, such as the size and shape of the fat particles, the hydrostatic pressure in the vascular bed, and the flow characteristics of the vessels into which the fat particles have been introduced. The size of the fat particles may be one of the most important factors in the pathomechanism of fat embolism. Experimental cerebral fat embolism induced by small particles of neutral fat has revealed major findings of reversible change. The MR imaging findings of the embolized lesions were prominent at 1 hour, less evident on day 1, and reverted to normal after day 4.6
We assumed that the changes in the MR imaging findings would appear predominantly in the hyperacute stage during the first 6 hours after embolization, which have not been studied extensively. We also hypothesized that, if an embolized lesion showed reversibility in the hyperacute stage, information on cerebral hemodynamic change in the lesion is very important. Therefore, we intended for this study to evaluate relative cerebral blood volume (rCBV), cerebral blood flow (rCBF), and mean transit time (MTT) in the hyperacute stage of cerebral fat embolism induced by triolein emulsion.
Methods
Animal Models and Experimental Design of Fat Embolism
All animal experiments were conducted in accordance with our institutional guidelines. Adult domestic cats used in this study weighed 2.7–3.8 kg; they were anesthetized by an intramuscular injection of ketamine HCl (2.5 mg/kg; Korea United Pharm Inc., Seoul, Korea) and xylazine (0.125 mg/kg; Bayer Korea, Seoul, Korea). The cats were allowed to breathe ambient air spontaneously during the procedure. An 18-gauge intravenous catheter (Angiocath; Becton Dickinson, Sandy, Utah) was placed in the right femoral vein for the purpose of contrast injection. The right femoral artery was isolated and its distal portion was ligated with 4.0 silk. Then a second 18-gauge intravenous catheter was inserted into the artery. A 3.0F microcatheter (MicroFerret-18 Infusion Catheter; William Cook Europe, Bjaeverskov, Denmark) with a microguidewire was passed through the intravenous catheter into the lumen of the artery. Either the right or the left internal carotid artery was selected. The tip of the microcatheter was positioned just proximal to the entrance of the intracranial portion of the carotid artery.
A 1-mL syringe containing 0.05 mL of neutral triglyceride triolein (1,2,3-tri [cis-9-octadecenoyl]glycerol, 99% purity, d = 0.91 g/mL; Sigma, St. Louis, Mo) and a 25-mL syringe containing 20 mL of saline were connected to a 3-way stopcock. The fat emulsion was made by mixing triolein and saline via the stopcock with a vigorous to-and-fro movement of the syringes for 2 minutes. The fat globules in the emulsion ranged from 1 μm to 30 μm. The emulsified fat was infused manually into the selected carotid artery at a rate of 4 mL/min for 5 minutes followed by injection of 3 mL of saline.
MR Imaging
Serial MR imaging was performed at 30 minutes and 2, 4, and 6 hours after infusion. Each cat was placed in a prone position within a pediatric MR infant restrainer, and a flexible surface coil was placed around its head. All studies were performed on a 1.5T MR Sonata scanner (Siemens, Erlangen, Germany). All images were acquired in the coronal plane. With each animal, T2-weighted (T2WI), diffusion-weighted (DWI), perfusion-weighted (PWI), and gadolinium-enhanced T1-weighted (Gd-T1WI) coronal images were obtained.
For spin-echo imaging, the following scan parameters were used: repetition time (TR) = 3000 milliseconds; echo time (TE) = 96 milliseconds for T2-weighted; section thickness = 4 mm with a 0.1-mm gap; field of view = 70–75 mm; 2 excitations; and acquisition matrix = 210 × 256. Diffusion-weighted imaging was performed by using an echo-planar sequence. The imaging parameters were as follows: field of view = 130 mm; phase-encoding steps = 128; section thickness = 4 mm with a 0.1-mm gap; and acquisition matrix = 96 × 160. The diffusion sensitizing gradients were oriented in the 3 axes with b values of 0 and 1000 s/mm2. The apparent diffusion coefficient (ADC) map was obtained simultaneously by using standard software. PWIs were obtained by using a single-shot gradient echo-planar sequence with a bolus injection of 0.2 mmol/kg Gd-DTPA. The imaging parameters were as follows: TR = 1200 milliseconds; TE = 33 milliseconds; section thickness = 4 mm; flip angle = 90°; acquisition matrix = 104 × 128; and field of view = 123 mm. Forty-four images were obtained with a 1-second repetition time for 44 seconds in 4 sections. Sequential imaging was initiated, and a bolus contrast agent was injected through a femoral vein catheter between acquisition of the fourth and fifth images and was followed by injection of 10 mL of saline. Gd-T1WIs were then obtained with TR/TE = 320/20 milliseconds; the other parameters were the same as T2WI.
Analysis of MR Images
Qualitative Analyses
T2WIs, DWIs, ADC maps, and Gd-T1WIs obtained for all cats were analyzed with respect to the presence or absence and location of abnormal signal intensity. Also, the sequential changes in the size and degree of the signal intensity of the lesions were visually assessed by consensus of 2 of the authors (K.Y.W. and K.H.J.). High signal intensity on T2-weighted images or diffusion-weighted images or enhancement on contrast-enhanced T1-weighted images on either examination was defined as a lesion.
Quantitative Analyses
The signal-intensity ratio (SIR) was measured independently on T2WIs, Gd-T1WIs, DWI, and ADC map images at each acquisition time by the 2 authors (Y.W.K. and H.J.K.). The SIR was defined as the ratio of the signal intensity of the region of interest of an obviously abnormal cortical lesion to that of the normal contralateral cortex. The measurement of SIR was performed at 3 gyri per section and in the posterior 3 sections in each cat (for a total of 9 times in each cat). The size (5–10 mm2) and position of the region of interest were identical in each cat.
Cerebral hemodynamic changes (such as rCBV, rCBF, and MTT) were measured by using PWIs. Signal intensity-time curves were generated at the lesion and on the contralateral normal side of the hemispheres. The rCBV, rCBF, and MTT were estimated by using an image-processing program (MRDx, Seoul, Korea). The rCBV, rCBF, and MTT of the lesion were compared with those of the contralateral normal side of the hemispheres. The ratios of the rCBV, rCBF, and MTT of the lesion to the contralateral normal side were also evaluated over time.
Statistical Analysis
For analysis of the SIRs on T2WI, Gd-T1WI, DWI, and ADC map images over time, the analysis of variance (ANOVA) on repeated measurements was used to calculate the statistical significance of the mean values.
For analysis of the cerebral hemodynamic changes, we compared the rCBVs, rCBFs, and MTTs of the lesion and the contralateral normal side at each acquisition time and the rCBV, rCBF, and MTT ratio over time. Statistical significance was estimated with the ANOVA on repeated measurements. P < 0.05 was considered to indicate a statistically significant difference.
Results
Qualitative Analyses
The lesions occurred diffusely in the superficial cortex of the ipsilateral cerebral hemisphere. On T2WIs, the lesions were hyperintense at 30 minutes. The hyperintensity showed a tendency to increase for 4 hours and to decrease thereafter.
The lesions were remarkably enhanced in all cases, and the lesion contrast was more conspicuous on Gd-T1WIs than on T2WIs or DWIs. At 30 minutes, all cats showed leptomeningeal and adjacent parenchymal enhancement which tended to increase markedly for 2 hours and to decrease thereafter.
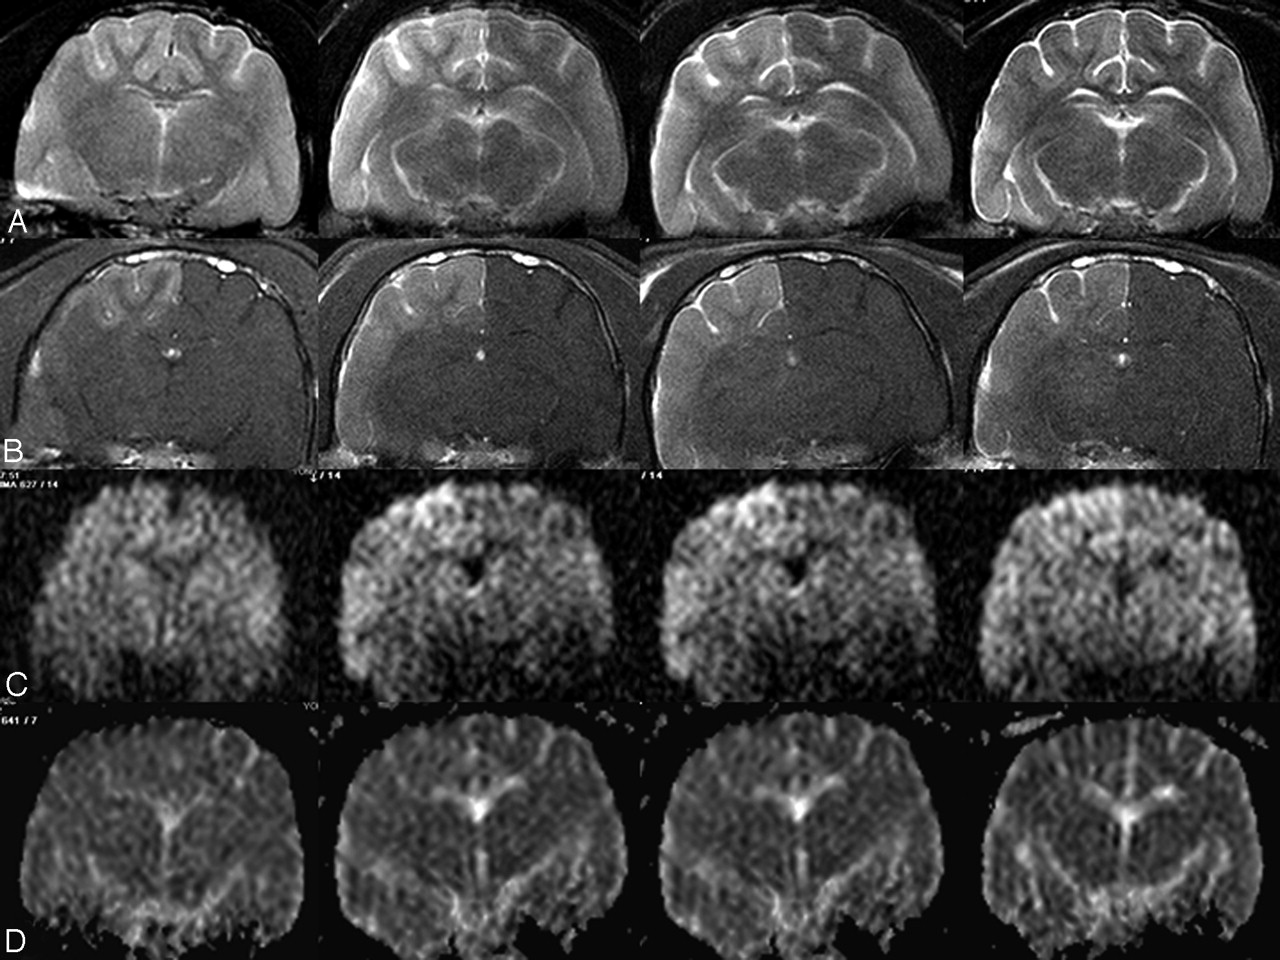
On DWIs, the lesions were isointense at 30 minutes and subtly hyperintense thereafter. On the ADC map images, however, the lesions were isointense at all acquisition times in all cats (Fig 1).

Sequential T2-weighted (A), Gd-enhanced T1-weighted (B), diffusion-weighted (C), and ADC map (D) images at 30 minutes (first column), 2 hours (second column), 4 hours (third column), and 6 hours (fourth column) after triolein emulsion infusion in cat 320. T2 hyperintensity (A) is shown at 30 minutes, extends into the subcortical white matter at 2 hours, is maximal in size and intensity at 4 hours, and decreases thereafter. Lesion enhancement on Gd-enhanced T1-weighted imaging (B) is revealed from 30 minutes, increases at 2 hours, and decreases thereafter. Diffusion-weighted images (C) show mild hyperintensity at 2, 4, and 6 hours. ADC map images (D) all reveal isointensity over time.
Quantitative Analyses
The SIRs on T2WIs significantly increased for 4 hours (P < .05) but decreased thereafter (Table 1).
Signal intensity ratios of lesion to contralateral normal side on T2-weighted images
On the Gd-T1WIs, the SIRs at 2, 4, and 6 hours increased significantly compared with those at 30 minutes (P < .05). The SIRs peaked at 2 hours (Table 2).
Signal intensity ratios of lesion to contralateral normal side on Gd-enhanced T1-weighted images
The SIRs on the DWIs increased for 2 hours but not to a statistically significant degree (P = .16). On ADC map images, the SIRs significantly increased for 2 hours (P < .05) but decreased thereafter (Table 3).
Signal intensity ratios of lesion to contralateral normal side on DWI and ADC map images
On PWIs, there were no significant differences in the rCBVs, rCBF, and MTT in the lesions or in the contralateral normal side at each acquisition time (P = .09, 0.30, and 0.13, respectively). The rCBV, rCBF, and MTT ratios of 2, 4, and 6 hours showed no significant change compared with those at 30 minutes (P = .17, 0.31, 0.66, respectively) (Table 4).
Relative ratios of lesion to contralateral normal side on perfusion-weighted images
Discussion
In the hemodynamic study with PWI, the mean values of rCBV, rCBF, and MTT of the lesion showed no statistical difference compared with those of the contralateral side at each acquisition time (P = .09, 0.30, 0.13, respectively). Nor were there any significant changes in the ratios of rCBV, rCBF, and MTT over time (P = .17, 0.31, 0.66, respectively). These results indicate that the cerebral hemodynamics in the embolized lesions do not seem to be affected by triolein emulsion. Therefore, the cerebral hemodynamic consideration is not necessary in further blood-brain barrier (BBB) studies with triolein emulsion.
In human hyperacute stroke, the lesion consists of an ischemic core and a peripheral penumbra.7,8 Because the ischemic penumbra is the region of decreased perfusion not situated below the critical level for maintenance of the Na+, K+-ATPase pump, it is thus potentially reversible.9–11 In previous studies, the penumbra demonstrated 2 parts, one of which progressed to infarction, whereas the other appeared normal on follow-up images. The optimal cutoff values between the 2 parts of the penumbra were found to be an rCBV ratio of 0.85, an rCBF ratio of 0.59, and an MTT ratio of 1.63. The mean rCBV ratio was 0.94 in the reversible part of the penumbra, and the mean rCBF and MTT ratios for the reversible part of the penumbra were 0.62 and 1.66.12–14 In the present study, the mean rCBV ratios were >0.95, the mean rCBF ratios were >0.94, and the MTT ratios were <0.99 at all time points (Table 4). None of these ratios was significantly different over time (P < .05); this result may suggest that the lesions can be reversible on follow-up images.
In this study, the mean of all the lesions’ ADC and DWI SIRs were 1.01–1.17 and 1.08–1.15. Mean ratios for ADC at 2 hours and 4 hours were significantly different from those at 30 minutes (P = .02), and the mean ratios for DWI at 2 hours and 4 hours were not significantly different from those at 30 minutes (P = .16). Schaefer et al15 reported that the mean ADC and DWI ratios were 0.96 (range, 0.85–1.06) and 1.08 (range, 0.95–1.22) in the reversible part of the penumbra. The threshold ratios for tissue viability were 0.85 on the ADC map image and 1.23 on DWI. These results suggest that neither embolized lesions by triolein emulsion have ischemic change and that the change of SIRs on DWIs and ADC maps reveals the T2 hyperintensity effect. Therefore, embolized lesions by triolein emulsion will be reversible on follow-up images. According to Kim et al,16 the embolized lesions by fat bolus injection show a low ADC value, resulting in brain infarction. In the present study, however, the SIR on ADC maps was higher than 1.0 at all time points. This represents the size of infused fat is important in determining the results of embolized lesions.
In this study, lesion enhancement peaked at 2 hours and T2 hyperintensity peaked at 4 hours and decreased thereafter. These results suggest that the BBB opening was maximal at 2 hours and the vasogenic edema was maximal at 4 hours. Two hours after fat embolization is the appropriate time for the study of the BBB opening and for evaluation of the effectiveness of BBB stabilizing agents or drug delivery. Fluid movement into the interstitial space seemed to follow the disrupted BBB with a 2-hour delay in the present study.
Conclusions
The embolized lesions induced by triolein emulsion showed no significant difference in cerebral hemodynamic parameters compared with those of the contralateral normal side. These results may suggest that consideration of the hemodynamic factor of embolized lesions is not necessary in further studies of BBB with triolein emulsion.
Acknowledgments
We are grateful to Bonnie Hami, Department of Radiology, University Hospitals of Cleveland and Haaga Radiology Research, for her assistance in the preparation of this article. This work was supported by the MRC program of MOST/KOSEF (R13-2005-009).
References
- Received February 13, 2005.
- Accepted after revision June 29, 2005.
- Copyright © American Society of Neuroradiology
In this issue


Jump to section
Related Articles
Cited By...
- No citing articles found.