
Article Figures & Data
Figures
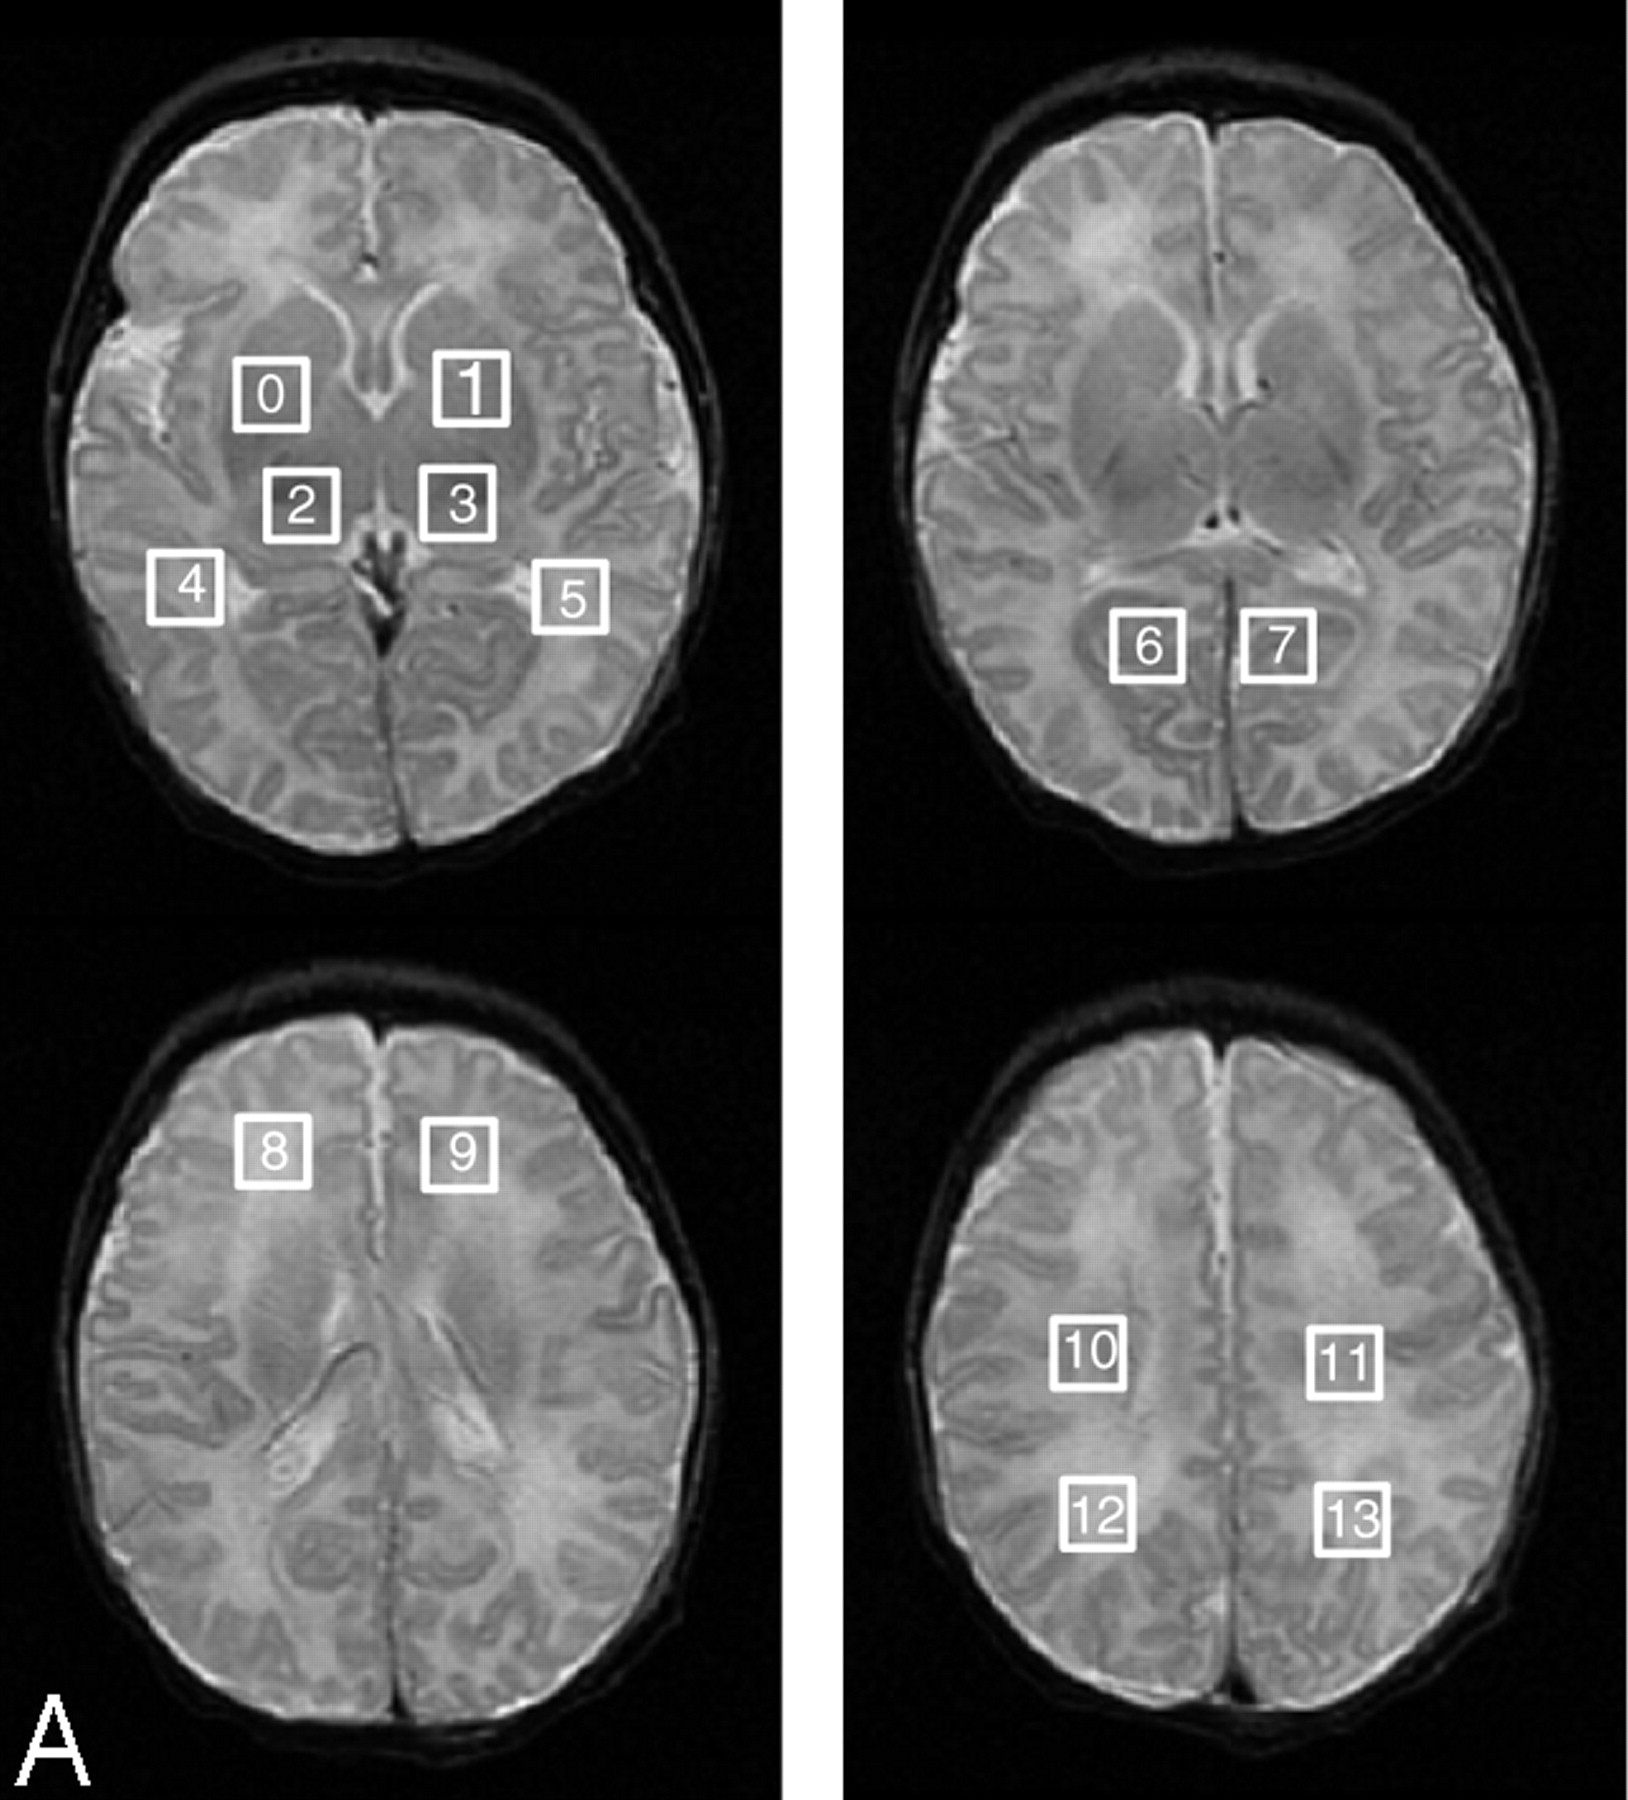
- Fig 1.
Locations of regions of interest for DTI and MRSI measurements are marked by rectangles.
A, Squares showing region of interest locations from which proton spectra ratios were acquired and calculated by automated processing after each MR study of every patient.
B, Squares and rectangles showing the 18 regions of interest from which Dav and FA values were calculated by automated processing.
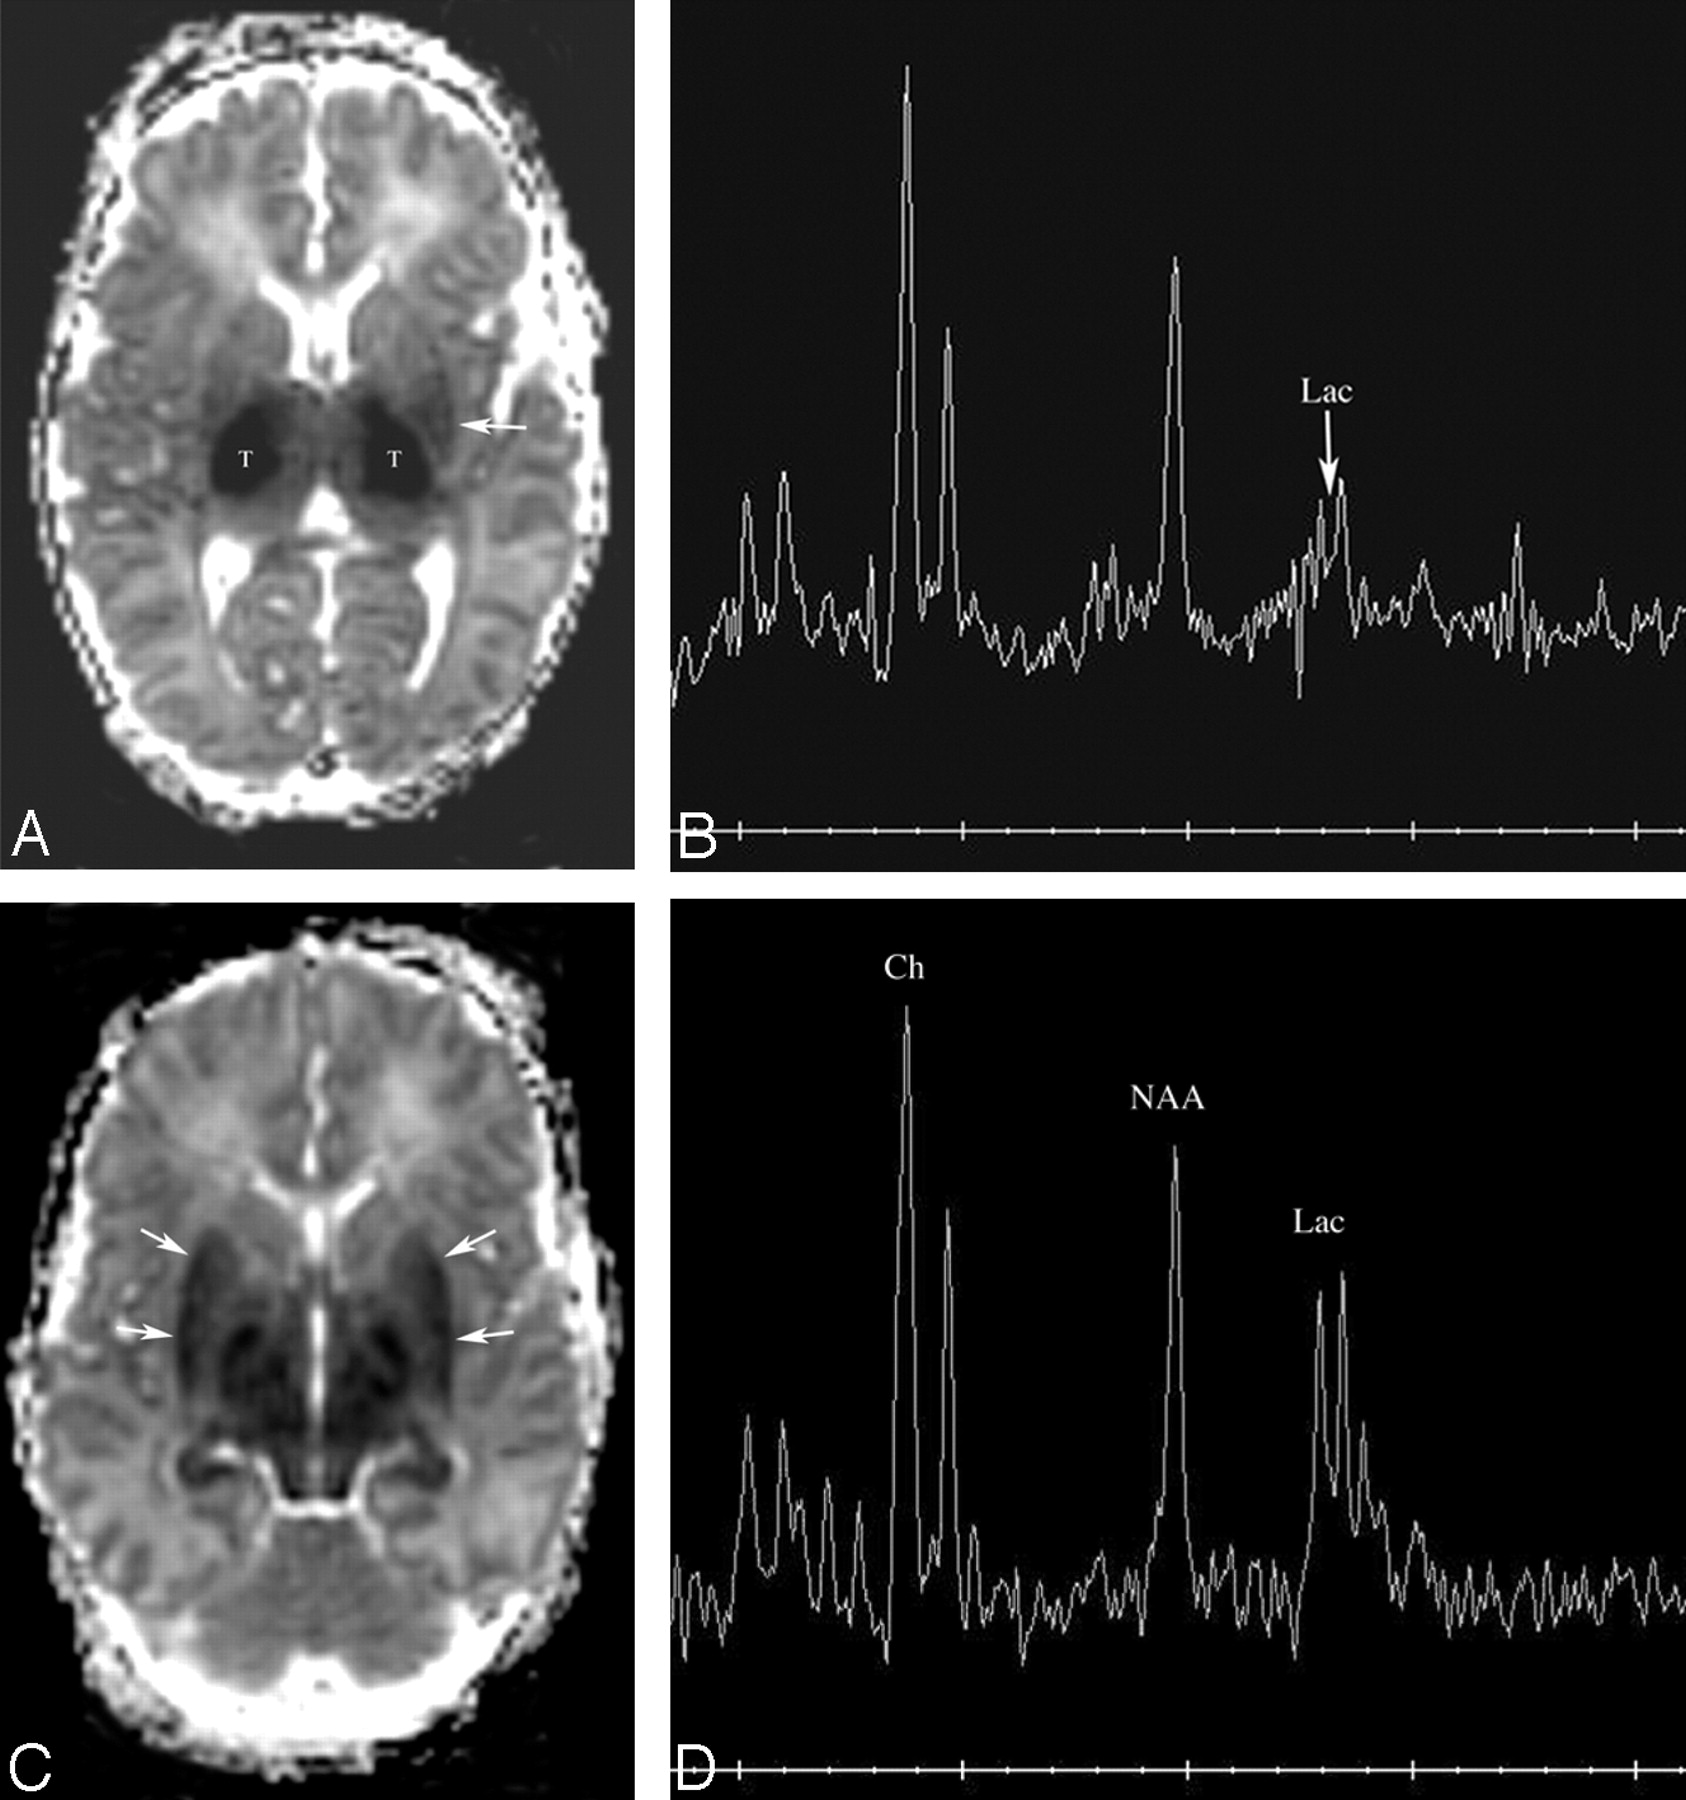
- Fig 2.
Patient 163. Increasing abnormality from day 1 to day 3.
A and B, Axial Dav maps at age 22 hours (day 1) show reduced diffusion in the ventrolateral thalami (arrows) and normal-appearing mesial temporal lobes in the region of the uncus.
C, Proton MR spectroscopy from left thalamus at 22 hours shows elevated lactate peak (Lac) and normal appearing NAA peak. The peak upfield from lactate is propane diol (ethylene glycol), which is administered as the base for antiseizure medications.
D and E, Axial Dav maps at age 64 hours (day 3) show more extensive reduced diffusivity. The mesial temporal lobes (D, white arrows) show reduced Dav, as do the cingula (E, black arrows) and the entire basal ganglia-thalami-insular region (E, white arrows).
F, Proton MR spectroscopy from left thalamus at 64 hours shows interval increase in lactate and decrease in NAA and choline (Ch) compared with creatine (Cr).
- Fig 3.
Patient 170. Increasing abnormality from day 2 to day 3.
A, Axial Dav map at age 34 hours shows extensive reduced diffusion in the lateral thalami (T) and, to a lesser extent, in the posterior left putamen (white arrow).
B, Proton MR spectroscopy from the left thalamus at 34 hours is most remarkable for a moderate lactate peak (arrow).
C, Axial Dav map at age 61 hours shows that extensive reduced diffusivity has developed within the putamina (arrows).
D, Proton MR spectroscopy from the left thalamus at 61 hours shows a marked increase in lactate compared with NAA and choline.
- Fig 4.
Patient 178. Evolution of T1, diffusivity, and metabolites over 3 scans during 8 days. A–C were performed at day 1 (16 hours), D–F were performed at 4 days (84 hours), and G–I were performed at 8 days (178 hours).
A, Axial T1-weighted image at age 16 hours is normal.
B, Axial Dav map at age 16 hours shows a small amount of reduced diffusivity on the ventrolateral thalami (arrows). Measurements showed a reduction in Dav of about 10%.
C, Proton MR spectroscopy from the right thalamus at age 16 hours shows minimal elevation of lactate (Lac), but is otherwise normal.
D, Axial T1-weighted image at 84 hours shows that the normal hyperintensity in the posterior limb of the internal capsule is no longer seen. Abnormal hyperintensity is seen in the ventrolateral thalami and posterior putamina.
E, Axial Dav map at 84 hours shows that reduced diffusivity is now present in the posterior putamina (arrows). Measurements of Dav showed significant reduction since day 1, with values now 50%–60% or normal (40%–50% reduced) in the thalami and putamina, and dorsal brain stem. Lesser reductions of about 25% were found in the cerebral hemispheric white matter.
F, Proton MR spectroscopy from the right thalamus at 84 hours shows an increase in lactate (Lac) and relative reduction of choline and NAA compared with the first study.
G, Axial T1-weighted image at 8 days shows that the T1 shortening is becoming less diffuse and more globular (arrows), with the globular regions being located in the globi pallidi, ventrolateral thalami, and at the junction of the anterior globi pallidi and putamina.
H, Axial Dav map at 84 hours shows that reduced diffusivity is now almost exclusively seen in the posterior putamina (arrows) with the thalamic abnormality nearly completely gone. Measurements showed that the Dav values of the putamina were still about 30% below normal, but those in the thalami had normalized.
I, Proton MR spectroscopy from the right thalamus at 8 days shows that the lactate peak has gotten significantly smaller. Note that the NAA and choline peaks have continued to decrease in size compared with the creatine peak.
- Fig 5.
Patient 193. New involvement of white matter pathways on second study. Studies performed at day 2 and day 7.
A–C, Axial Dav maps at 34 hours show reduced diffusivity (Dav reduced by about 50%, black arrows) in the ventrolateral thalami, posterior limbs of internal capsules, and corticospinal tracts in centrum semiovale. No other areas of reduced diffusivity are identified.
D, Proton MR spectroscopy from the left basal ganglia at 34 hours shows mild lactate (Lac) elevation.
E–H, Axial Dav maps at 148 hours show that diffusivity in the deep gray nuclei has normalized (values were within 5% of normal); however, new areas of reduced diffusivity are seen in what are believed to be the optic radiations (E, medium white arrows), corpus callosum (F, small white arrows; G, smaller white arrows), cingulum (H, medium white arrows), and superior longitudinal fasciculus (G, larger arrows).
I, Proton MR spectroscopy from left basal ganglia at 148 hours shows that lactate (Lac) has increased in comparison with NAA, choline, and creatine. NAA is the most reduced metabolite.
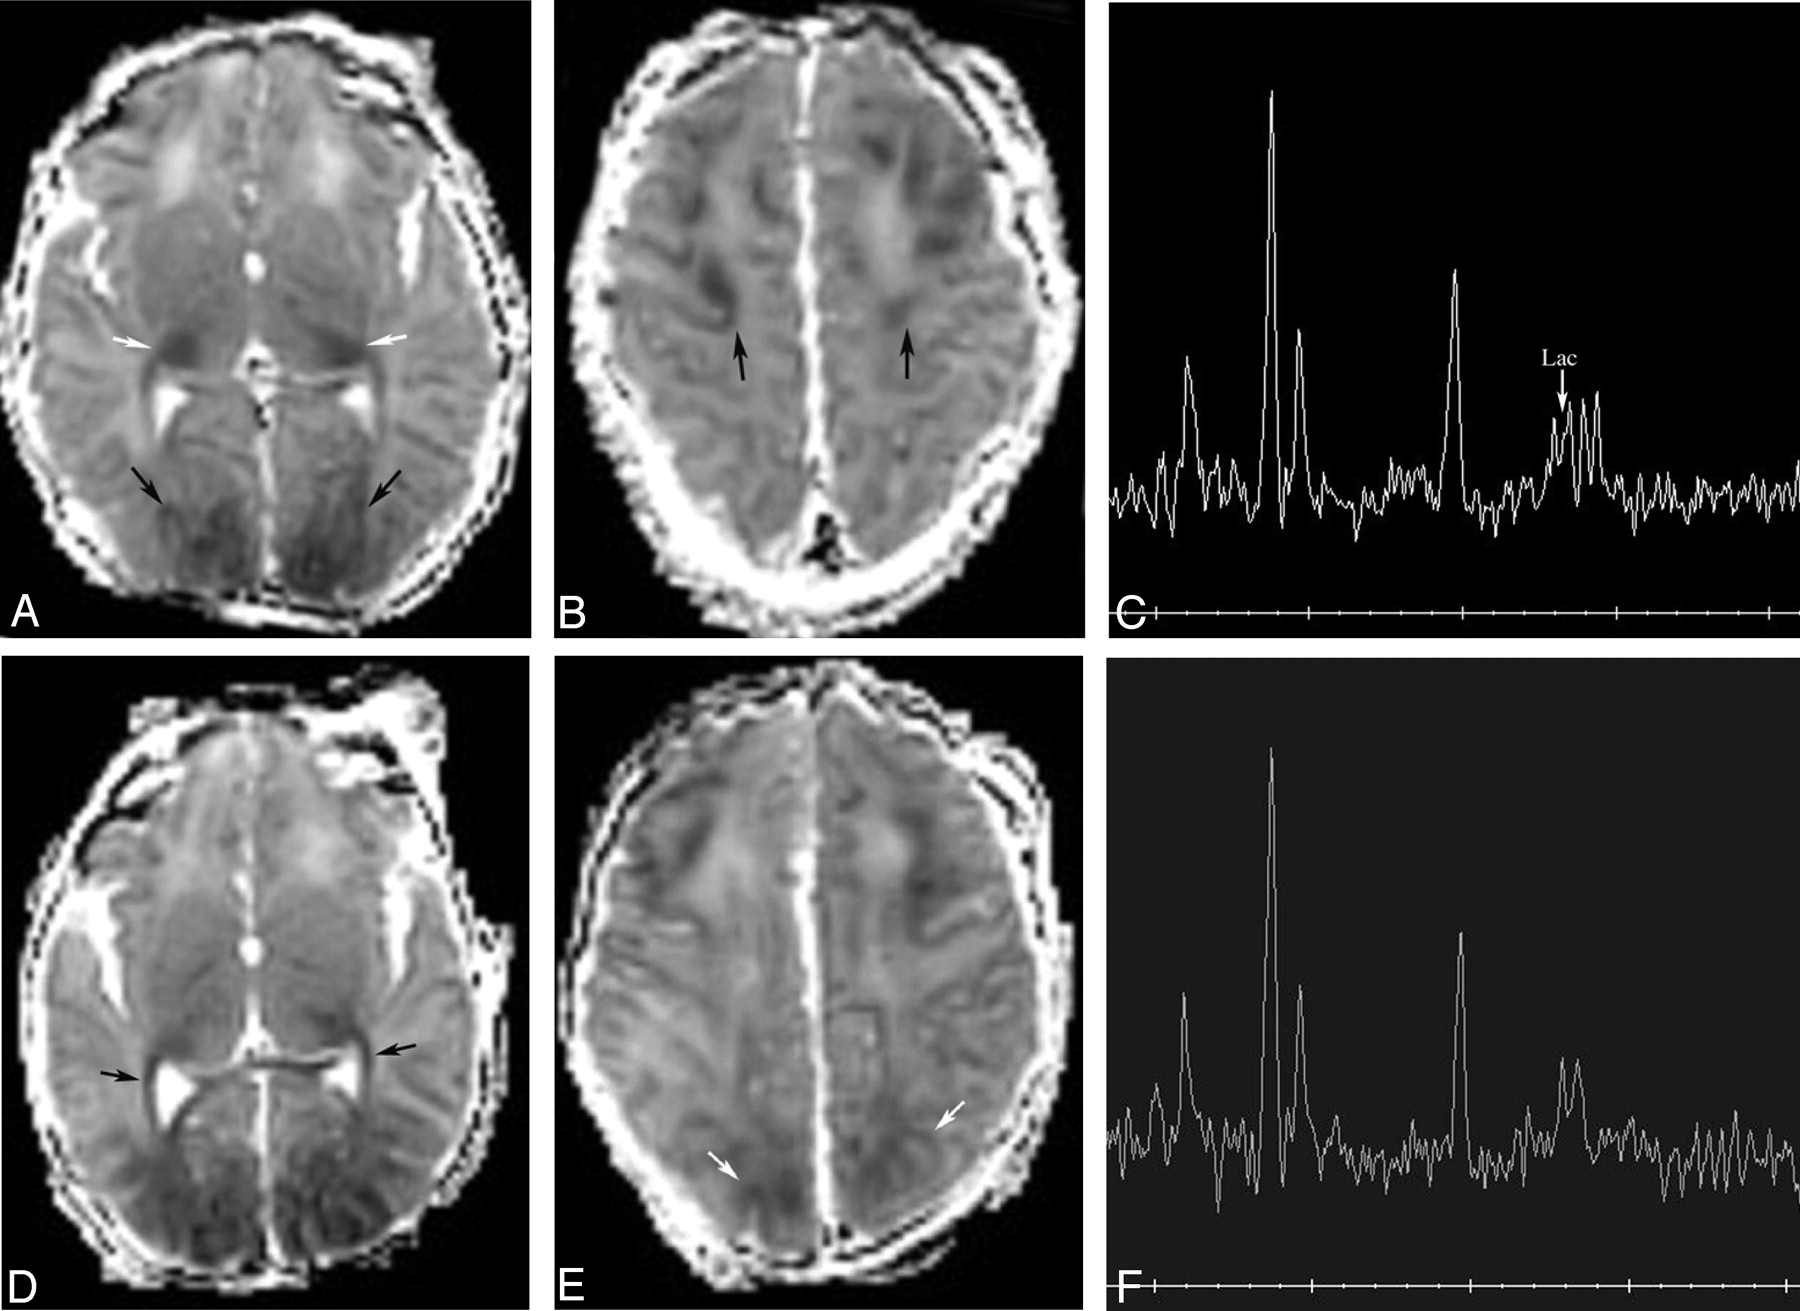
- Fig 6.
Patient 154. Increased volume of injury in vascular boundary zones from 2 to 4 days.
A and B, Axial Dav maps at 49 hours show reduced diffusivity (Dav reduced by about 20%, black arrows) in the frontal and parietooccipital intervascular boundary zones. Note also some reduced diffusivity in the posterolateral thalami (white arrows).
C, Proton MR spectroscopy from the left frontal white matter at 49 hours shows mild lactate (Lac) elevation.
D and E, Axial Dav maps at 91 hours show more extensive reduced diffusivity in the frontal and parieto-occipital intervascular boundary zones and new reduced diffusivity along the optic radiations (black arrows). Dav values were not significantly changed from the prior study at 49 hours.
F, Although the proton MR spectrum does not look significantly changed, measurements showed a 16% decrease in Lac/NAA and a 36% decrease in Lac/Ch in the frontal white matter compared with the study at 49 hours.


Tables
Patient No. Age at Scan Clinical Background T1-weighted images T2-weighted images Diffusion Images (Dav, mm2/s) 153a 2 d (25.5 h) Placental abruption, deep fetal decelerations and poor variability. Slight hyperintensity in basal ganglia and at the depths of several cortical sulci. Diffuse hyperintensity in white matter, basal ganglia Reduced diffusivity in lateral thalami (0.70), posterior limbs of internal capsules (0.75) Emergent C-section. Seizure at 8 hours, required 3 drugs Absent hyperintensity in PLIC 153b 6 d (124 h) Hyperintensity in dorsal brain stem, posterolateral putamina, lateral thalami Slight hypointensity in posterolateral putamina and lateral thalami Reduced diffusivity in posterior thalami (0.80), splenium of corpus callosum (0.80), and left more than right hemispheric white matter 154a 2 d (48 h) Tight nuchal cord, variable decelerations. Normal Blurring of cortex and white matter in anterior and posterior watershed zones Reduced diffusivity in bilateral posterior thalami, anterior and posterior watershed cortex, and subcortical white matter Multifocal seizures at 10 hours, treated with 4 drugs. Negative blood and CSF cultures and PCR 154b 4 d (91 h) Normal Blurring of cortex and white matter in anterior and posterior watershed zones Reduced diffusion in posterior watershed cortex and white matter Slight persistent reduced diffusion in anterior watershed cortex Minimal persistent reduced diffusion in posterior thalami 155a 1 d (20 h) Oligohydramnios, thick meconium, birth depression. Normal Hyperintensity in white matter and thalami Reduced diffusivity in watershed white matter Seizure on day of life 2, stopped with phenobarbital. PLIC present Negative blood cultures 155b 6 d (124 h) Normal Subtle gray-to-white blurring in posterior watershed cortex. Increased T2 in white matter and thalami Reduced diffusivity in watershed white matter PLIC present 155c 8 d (170 h) Hyperintensity in watershed cortex Hyperintensity in watershed cortex, posterior more than anterior Normal 162a 2 d (46 h) Maternal hypotension after epidural placement, fetal decelerations, C-sections, thick meconium. Seizures at 8 hours, treated with phenobarbital. Mom had history of herpes, but no lesions at labor, and PCR was negative for viruses in CSF Slight hyperintensity in VLT, posterior putamen Normal Reduced diffusivity in left frontal subcortical white matter (0.50) and cortex, greater than right. Reduced diffusivity in VLT, left more than right (0.60–0.65) Faint hyperintensity in PLIC 162b 7 d (146 h) Hyperintensity in left more than right frontal cortex, left GP Normal Reduced diffusivity in VLTs only (0.70–0.75) 163a 1 d (22 h) Seizures in utero 3 days before birth. Crash C-section due to flat fetal heart rate. Infant seizing at delivery, nuchal cord1. PCR of CSF was negative Hyperintensity in GP, putamen, caudate, VLT Hyperintensity in most of cerebral cortex Reduced diffusivity in VLTs (0.40), putamina (0.60), PLIC (0.55), subcortical white matter (0.70–0.75), dorsal BS (0.45–0.50) Absent hyperintensity in PLIC 163b 3 d (64 h) Hyperintensity in GP, putamen, caudate, VLT, dorsal BS Hypointensity in dorsal BS, VLT, lateral putamen Reduced diffusivity in hippocampi (0.45), subcortical white matter (0.45–0.50), basal ganglia (0.45), thalami (0.35), cerebellar vermis (0.50) Absent T1 in PLIC Long T2 in remainder of thalamus, much of cortex 167a 1 d (19 h) Pre-eclampsia, failed home labor, thick meconium, variable decelerations, crash C-section. After birth, persistent pulmonary hypertension, hypoglycemia, acute tubular necrosis. Blood cultures negative Increased T1 in VLT Normal Tiny area of reduced diffusivity in VLTs (0.85) Normal PLIC Focal infarct left frontal lobe 167b 4 d (88 h) Normal Slight T2 prolongation in cortical infarcts Small amount of reduced diffusivity in VLTs (0.60) and CSTs (0.70). Two focal infarcts, left frontal and left occipital 170a 2 d (34 h) Uterine rupture, deep decelerations. Hypointensity in thalami Hyperintensity in thalami, basal ganglia Reduced diffusivity in lateral thalami (0.55), CSTs (0.65), posterior BS (0.65–0.70) Seizures at 9 hours. Blood cultures negative Normal PLIC 170b 3 d (61 h) Hypointensity in basal ganglia Hyperintensity in thalami, basal ganglia Reduced diffusivity in putamen more than caudate, anterior and lateral thalami (0.40), CSTs (0.45–0.50), subthalamic nuclei, dorsal BS (0.50) Hyperintensity not seen in PLIC 178a 1 d (16 h) Maternal septic shock. Fetal tachycardia and abnormal fetal tracing. Thick meconium; no spontaneous activity or respirations at birth. Apgars 0, 0, 1 at 1, 5, and 10 minutes. Transient hepatic and renal dysfunction. Seizures before first MR image. Blood and CSF cultures of infant were negative Hyperintensity in caudate, GP, putamen Hypointensity in VLT Reduced diffusivity in VLTs (0.65), CSTs (1.0) Normal PLIC Blurring of perirolandic cortex 178b 4 d (83 h) Hyperintensity in VLT, GP, posterior putamen, posterior insula Normal Reduced diffusivity in posterior putamina (0.55), VLTs (0.50), CSTs (0.70–0.75), CC (0.75), subcortical white matter (0.60) Hyperintensity not seen in PLIC 178c 7 d (178 h) Globular hyperintensity in VLTs, GP–putamen junction, posterolateral putamen. Hyperintensity not seen in PLIC Heterogeneous basal nuclei. T2 prolongation in cerebral white matter Reduced diffusivity in posterior putamen (0.70). Minimally reduced in VLTs (0.90), CSTs (1.0). 193a 2 d (34 h) Home delivery complicated by LGA infant and shoulder dystocia. After prolonged delivery, infant was cyanotic, limp. Infant was given CPR for 40 minutes before spontaneous respirations. Seizures at about 5 hours, treated with phenobarbital Hyperintensity in VLTs, GPs, putamina, caudates, most of cerebral cortex. Normal PLIC Hyperintensity of BG, thalami. Blurring of perirolandic cortex Reduced diffusivity in VLTs (0.45–0.50), CSTs (0.60) 193b 7 d (148 h) Hyperintensity in VLTs, GPs, putamina, caudates, posterior insular cortex, perirolandic cortex, calcarine cortex Normal Reduced diffusivity in cingulum (0.65), corpus callosum (0.60), fronto-occipital fasciculus (0.95), optic radiations (0.90), uncinate fasciculus (0.85) Hyperintensity not seen in PLIC 195a 2 d (44 h) Jittery baby. Mild hypoglycemia. Low normal ABG pH Normal. Hyperintensity present in PLIC Normal Normal 195b 19 d (330 h) Focus of hyperintensity in right frontal periventricular white matter Normal Normal Note:—Dav indicates average diffusivity; PLIC, posterior limb of internal capsule; ABG, arterial blood gas; VLT, ventrolateral thalamus; CST, corticospinal tract; GP, globus pallidus; CC, corpus callosum; LGA, large for gestational age; CPR, cardiopulmonary resuscitation; CSF, cerebrospinal fluid; BS, brain stem; PCR, polymerase chain reaction.
Patient No. Dav V0 Dav V1 Dav V2 Dav V3 Dav V4 Dav V5 Dav V6 Dav V7 Dav V8 Dav V9 Dav V10 153a 1274.24 1278.57 912.551 948.122 1481.61 1407.82 1176.6 1199.73 1344 1303.29 1497.69 153b N/A N/A N/A N/A N/A N/A N/A N/A N/A N/A N/A 154a 1117.53 1111.89 946.773 937.83 1281.96 1350.27 1079.62 1109.05 1065.62 1097.97 1326.35 154b 1237.79 1199.41 1110.94 1077.08 1364.24 1348.91 1140.5 1206.36 1179.75 1300.34 1125.61 155a 1149.22 1183.5 997.95 1056.08 1236.5 1316.49 1154.74 1215.4 1198.18 1109.86 1538.64 155b 845.5 824.827 768.009 712.835 956.855 1009.75 849.545 842.436 857.864 866.35 958.491 155c 1287.58 1280.5 1157.1 1118.98 1428.45 1420.55 1222.6 1231.45 1553.6 1337.48 1691.56 162a 1093.49 1117.43 975.102 957.429 1231.08 1279.31 1108.83 1121.71 1032.18 1165.36 1292.57 162b 1210.61 1174.37 1008.33 1021.61 1335.98 1283.27 1207.29 1188.76 1231.41 1256.41 1553.59 163a 1029.65 1013.39 712.633 714.347 1334.59 1210.96 1092.9 1110.41 1302.2 1354.76 1824.82 163b 693.694 674.898 649.816 583 862.429 935.776 841.918 856.878 758.776 914.232 1002.63 167a 1239.98 1251.2 1026.67 977.107 1399.39 1307.88 1209.84 1218.98 1286.93 1329.55 1447.08 167b 1180.67 1166.73 1008.43 989.755 1290.06 1347.55 1197.23 1217.22 1168.47 1196.41 1282.24 170a 1195.67 1196.51 622.429 732.898 1378.24 1398.45 1277.43 1255 962.408 1049.69 1374.71 170b 981.286 942.5 601.122 603.959 1400.65 1484.71 1158.33 1112.96 1436.92 1424.49 1346.39 178a 1214.62 1231.98 987.5 906.667 1524.8 1545.3 1160.25 1274.14 1195.75 1249.19 1572.71 178b 1169.94 1149.71 1118.17 1194 1615.1 1515.7 1326.11 1245.22 1308.75 1246.69 1751.57 178c 1179.79 1180.63 1129.75 1128.58 1507 1515.9 1242.98 1199.29 1288.33 1333.08 1492.29 193a 1105.36 1135 582.5 702.583 1439.2 1357.8 1141.46 1126.59 1089.44 1066.25 1423.18 193b 1104.86 1049.86 822.75 783 1200.6 1181.5 1174.22 1296.2 1088.94 1078.33 1280.31 195a 1329.41 1295.59 1155.67 1217 1247.5 1369.8 1177.22 1196.14 1148.33 1172.12 1317.49 195b 1154.51 1192 956 1076.5 1340.7 1335.6 1123.96 1264.31 1094.5 1134.81 1330.12 Note:—Dav V indicates diffusivity in Voxel; N/A, data not available.
Patient No. Age at Study Lac/Ch (BG) Lac/NAA (BG) NAA/Ch (BG) Cr/NAA (BG) Cr/Ch (BG) Lac/Ch (W/M) Lac/NAA (WM) NAA/Ch (WM) Cr/NAA (WM) 153a 2 d 0.58 1.26 0.46 0.88 0.41 MD MD MD MD 153b 6 d 0.65 1.89 0.34 0.97 0.33 MD MD MD MD 154a 2 d 0.14 0.20 0.72 0.69 0.49 0.47 0.67 0.71 0.51 154b 4 d 0.19 0.22 0.83 0.72 0.60 0.30 0.56 0.53 0.78 155a 1 d 0.17 0.22 0.79 0.60 0.47 0.39 0.63 0.62 0.62 155b 6 d 0.12 0.20 0.62 0.80 0.50 0.23 0.40 0.59 0.61 155c 8 d 0.07 0.10 0.72 0.80 0.57 0.12 0.25 0.47 0.73 162a 2 d 0.09 0.12 0.75 0.72 0.54 0.39 0.63 0.62 0.58 162b 7 d 0.04 0.06 0.68 0.55 0.37 0.11 0.19 0.56 0.38 162b 7 d 0.04 0.06 0.68 0.55 0.37 0.11 0.19 0.56 0.38 163a 1 d 0.99 1.73 0.57 0.95 0.54 1.11 1.94 0.57 0.86 163b 3 d 1.06 2.81 0.38 1.09 0.41 1.13 2.78 0.41 0.90 167a 1 d 0.16 0.17 0.93 0.52 0.49 0.13 0.19 0.69 0.61 167b 4 d 0.15 0.21 0.72 0.64 0.46 0.15 0.20 0.74 0.52 170a 2 d MD MD MD MD MD MD MD MD MD 170b 3 d MD MD MD MD MD MD MD MD MD 178a 1 d 0.15 0.25 0.60 0.59 0.35 0.28 0.34 0.80 0.48 178b 4 d 0.48 0.90 0.54 0.86 0.46 0.34 0.49 0.69 0.60 178c 8 d 0.23 0.35 0.66 0.85 0.56 0.20 0.37 0.55 0.66 193a 2 d 0.38 0.40 0.95 0.60 0.57 0.40 0.51 0.77 0.43 193b 7 d 0.43 1.17 0.37 0.86 0.32 0.49 1.38 0.35 0.69 195a 2 d 0.04 0.50 0.75 0.57 0.43 0.01 0.02 0.64 0.62 195b 14 d 0.00 0.00 0.91 0.54 0.49 0.01 0.02 0.87 0.37 Note:—Ch indicates choline; NAA, N-acetylaspartate; MD, missing data.
In this issue


Jump to section
Related Articles
Cited By...
- Effects of Tissue Temperature and Injury on ADC during Therapeutic Hypothermia in Newborn Hypoxic-Ischemic Encephalopathy
- Integrating neuroimaging biomarkers into the multicentre, high-dose erythropoietin for asphyxia and encephalopathy (HEAL) trial: rationale, protocol and harmonisation
- Neonatal Encephalopathy: Beyond Hypoxic-Ischemic Encephalopathy
- Temporal dynamics of functional networks in long-term infant scalp EEG
- Pediatric Acute Toxic Leukoencephalopathy: Prediction of the Clinical Outcome by FLAIR and DWI for Various Etiologies
- Advances in neonatal MRI of the brain: from research to practice
- Strabismus in children with white matter damage of immaturity: MRI correlation
- MRI and spectroscopy in (near) term neonates with perinatal asphyxia and therapeutic hypothermia
- MRI obtained during versus after hypothermia in asphyxiated newborns
- Brain Perfusion in Encephalopathic Newborns after Therapeutic Hypothermia
- Brain injury and development in newborns with critical congenital heart disease
- Brain Injury Patterns in Hypoglycemia in Neonatal Encephalopathy
- Anatomical patterns and correlated MRI findings of non-perinatal hypoxic-ischaemic encephalopathy
- Therapeutic Hypothermia for Neonatal Encephalopathy Results in Improved Microstructure and Metabolism in the Deep Gray Nuclei
- Impact of therapeutic hypothermia on MRI diffusion changes in neonatal encephalopathy
- Fetal MR Imaging Evidence of Prolonged Apparent Diffusion Coefficient Decrease in Fetal Death
- Early versus late MRI in asphyxiated newborns treated with hypothermia
- Is there a causal relationship between the hypoxia-ischaemia associated with cardiorespiratory arrest and subdural haematomas? An observational study
- Long-term outcome after neonatal hypoxic-ischaemic encephalopathy
- Efficiency of Fractional Anisotropy and Apparent Diffusion Coefficient on Diffusion Tensor Imaging in Prognosis of Neonates with Hypoxic-Ischemic Encephalopathy: A Methodologic Prospective Pilot Study
- Do Apparent Diffusion Coefficient Measurements Predict Outcome in Children with Neonatal Hypoxic-Ischemic Encephalopathy?
- Cerebral White Matter Injury: The Changing Spectrum in Survivors of Preterm Birth
- Does perinatal asphyxia impair cognitive function without cerebral palsy?