
Article Figures & Data
Figures
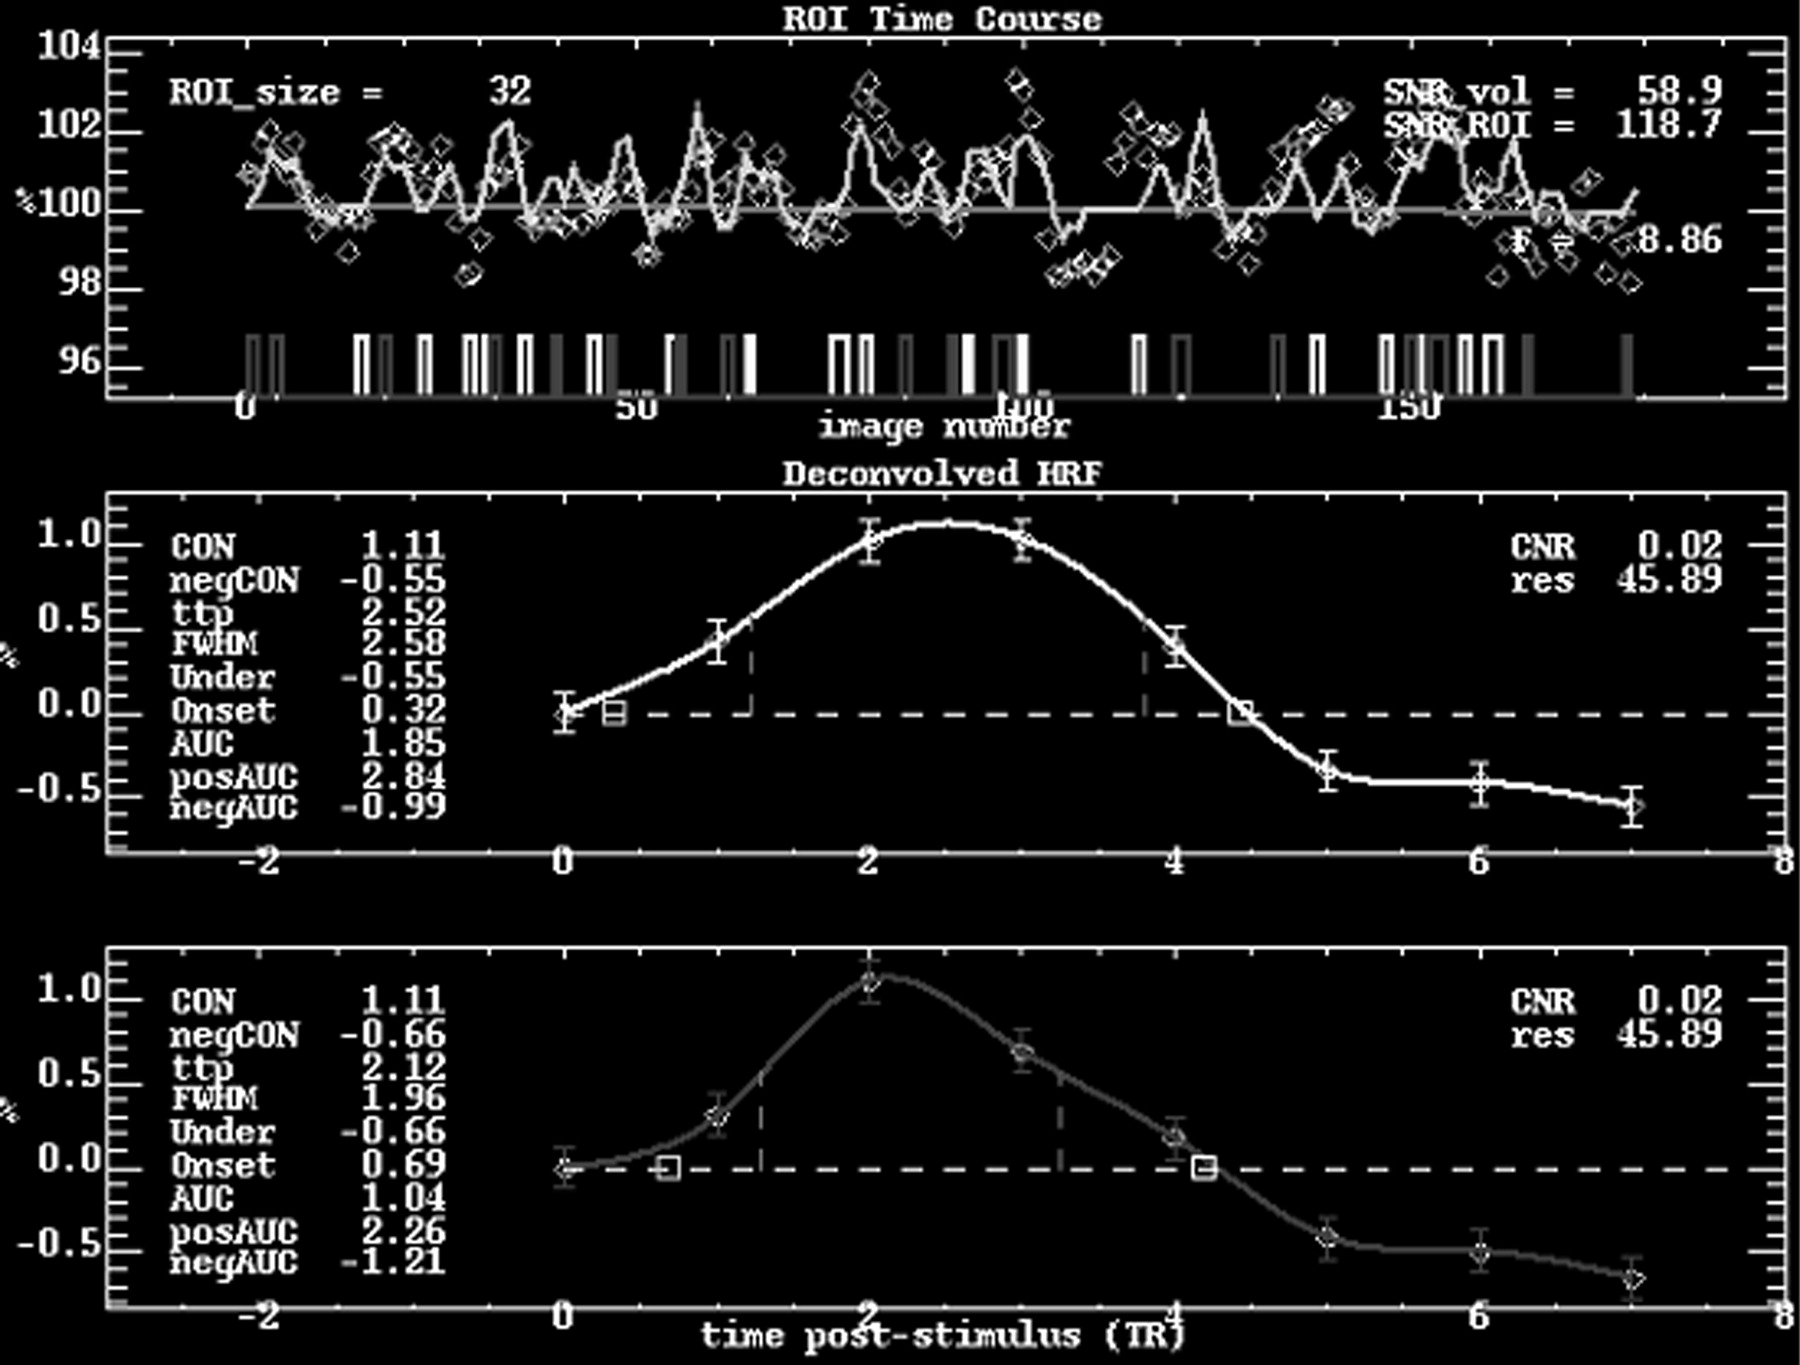
- Fig 1.
Time course analysis of the response in V1 to the M and P stimuli for a single subject. The average signal time course within V1 for the entire study is seen in the top graph, with the light boxes representing M stimulus onsets and the dark boxes representing P stimulus onsets. The average deconvolved HRFs of the M and P responses are depicted in the middle and bottom graphs, respectively. In this particular case, the P/M contrast ratio is 1.0, the TTP ratio is 0.84, and the FWHM ratio is 0.76.
- Fig 2.
Single subject activation maps to the M (red) and P (green) stimuli. The images are in radiologic convention (ie, left is right). The functional map is overlaid on a high resolution anatomic image. The regions showing overlapping M and P activity are yellow. Note that both stimuli generate robust activation of V1. The sections in the top picture depict active regions in the brain, and the bottom 2 sections show representative regions of activation. For the M stimulus response, V5 is activated. For the P stimulus, V4 is activated.
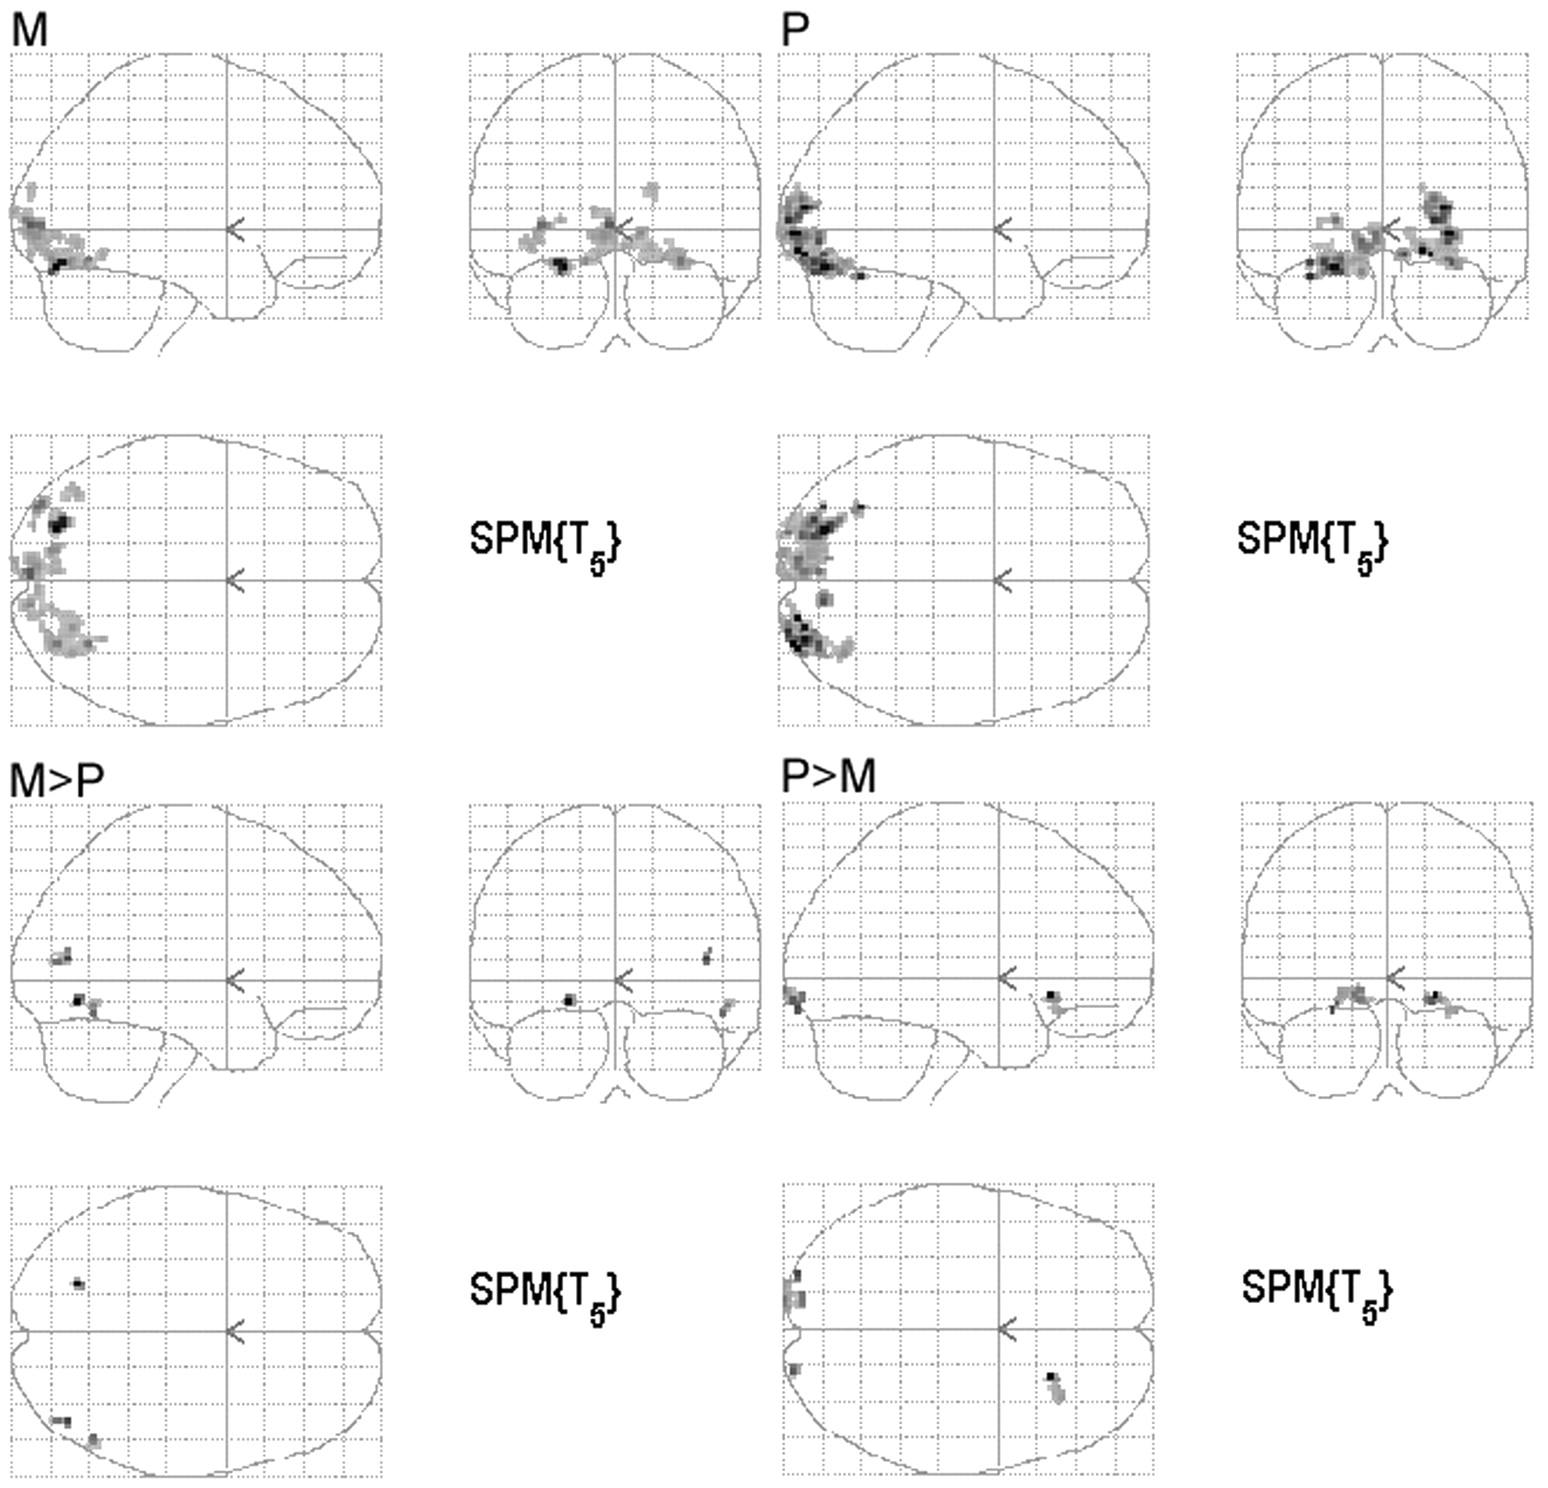
- Fig 3.
Group analysis of the 6 subjects. The images are in neurologic convention (ie, left is left). The SPMs for the response to the M and P stimulus compared with the rest condition as well as the SPMs of regions responding greater for one condition than the other (M>P and P>M) are shown. The maps are created with a threshold uncorrected for multiple comparison of P = .001 with an extent threshold of P < .05, corrected for multiple comparisons.
- Fig 4.
Regression analysis of the HRF metrics, with the M and P responses pooled together for the analysis. TTP versus percentage signal change (A) shows no statistically significant correlation, with r2 = 0.06408 and a slope that is not significantly different from 0 (slope = 0.453, P = .2557). The FWHM of the HRF is positively correlated with the percentage signal change (B), with r2 = 0.3114 and a slope that is significantly different from 0 (slope = 1.977, P = .0070). The FWHM of the HRF is also positively correlated with the TTP (C), with r2 = 0.2115 and a slope that is significantly different from zero (slope = 0.9105, P = .0313).


Tables
- Table 1:
Coordinates of significantly activated clusters of the group analysis of individual subjects
Stimulus Talariach Coordinates Cluster Size Brodmann Area x y z M −24 −78 −11 59 19 −2 −89 6 332 18 30 −63 −9 19 30 −78 −10 19 −34 −85 6 39 19 −26 −87 8 19 −36 −82 −1 18 −14 −80 −8 26 18 −40 −68 −3 20 19 16 −86 23 14 18 P 30 −91 3 301 18 18 −90 −4 17 28 −85 13 19 −24 −76 −11 363 19 −34 −78 −10 19 −20 −88 −7 18 −34 −61 −15 10 37 10 −78 −6 23 18 −22 −93 8 20 18 −30 −91 8 19 M > P −22 −68 −5 12 19 42 −71 13 13 39 50 −61 −10 11 37 P > M 22 23 −8 23 47 32 28 −15 47 −26 −92 −7 46 18 −14 −90 −4 17 −14 −97 0 20 −94 −5 9 17 Note:—M indicates magnocellular pathways; P, parvocellular pathways.
- Table 2:
Summary of hemodynamic response function metrics of the M and P responses within VI
Mean P/M Ratio SD P Value 95% Confidence Interval % Contrast 0.89 0.23 .16 0.74–1.05 TTP 0.88 0.11 .0037 0.81–0.95 FWHM 0.95 0.18 .36 0.82–1.07 Note:—V1 indicates primary visual cortex; TTP, time to peak; FWHM, full width at half maximum.


