Advertisement

Main menu

  • Home
  • Content
    • Current Issue
    • Accepted Manuscripts
    • Article Preview
    • Past Issue Archive
    • Video Articles
    • AJNR Case Collection
    • Case of the Week Archive
    • Case of the Month Archive
    • Classic Case Archive
  • Special Collections
    • AJNR Awards
    • Low-Field MRI
    • Alzheimer Disease
    • ASNR Foundation Special Collection
    • Photon-Counting CT
    • View All
  • Multimedia
    • AJNR Podcasts
    • AJNR SCANtastic
    • Trainee Corner
    • MRI Safety Corner
    • Imaging Protocols
  • For Authors
    • Submit a Manuscript
    • Submit a Video Article
    • Submit an eLetter to the Editor/Response
    • Manuscript Submission Guidelines
    • Statistical Tips
    • Fast Publishing of Accepted Manuscripts
    • Graphical Abstract Preparation
    • Imaging Protocol Submission
    • Author Policies
  • About Us
    • About AJNR
    • Editorial Board
    • Editorial Board Alumni
  • More
    • Become a Reviewer/Academy of Reviewers
    • Subscribers
    • Permissions
    • Alerts
    • Feedback
    • Advertisers
    • ASNR Home

User menu

  • Alerts
  • Log in

Search

  • Advanced search
American Journal of Neuroradiology

American Journal of Neuroradiology

ASHNR American Society of Functional Neuroradiology ASHNR American Society of Pediatric Neuroradiology ASSR
  • Alerts
  • Log in

Advanced Search

  • Home
  • Content
    • Current Issue
    • Accepted Manuscripts
    • Article Preview
    • Past Issue Archive
    • Video Articles
    • AJNR Case Collection
    • Case of the Week Archive
    • Case of the Month Archive
    • Classic Case Archive
  • Special Collections
    • AJNR Awards
    • Low-Field MRI
    • Alzheimer Disease
    • ASNR Foundation Special Collection
    • Photon-Counting CT
    • View All
  • Multimedia
    • AJNR Podcasts
    • AJNR SCANtastic
    • Trainee Corner
    • MRI Safety Corner
    • Imaging Protocols
  • For Authors
    • Submit a Manuscript
    • Submit a Video Article
    • Submit an eLetter to the Editor/Response
    • Manuscript Submission Guidelines
    • Statistical Tips
    • Fast Publishing of Accepted Manuscripts
    • Graphical Abstract Preparation
    • Imaging Protocol Submission
    • Author Policies
  • About Us
    • About AJNR
    • Editorial Board
    • Editorial Board Alumni
  • More
    • Become a Reviewer/Academy of Reviewers
    • Subscribers
    • Permissions
    • Alerts
    • Feedback
    • Advertisers
    • ASNR Home
  • Follow AJNR on Twitter
  • Visit AJNR on Facebook
  • Follow AJNR on Instagram
  • Join AJNR on LinkedIn
  • RSS Feeds

AJNR Awards, New Junior Editors, and more. Read the latest AJNR updates

  • Getting new auth cookie, if you see this message a lot, tell someone!
  • Getting new auth cookie, if you see this message a lot, tell someone!
Research ArticleBrain

Quantitative Proton MR Spectroscopy Findings in the Corpus Callosum of Patients with Schizophrenia Suggest Callosal Disconnection

K. Aydin, A. Ucok and S. Cakir
American Journal of Neuroradiology November 2007, 28 (10) 1968-1974; DOI: https://doi.org/10.3174/ajnr.A0691
K. Aydin
  • Find this author on Google Scholar
  • Find this author on PubMed
  • Search for this author on this site
A. Ucok
  • Find this author on Google Scholar
  • Find this author on PubMed
  • Search for this author on this site
S. Cakir
  • Find this author on Google Scholar
  • Find this author on PubMed
  • Search for this author on this site
  • Article
  • Figures & Data
  • Info & Metrics
  • Responses
  • References
  • PDF
Loading

Article Figures & Data

Figures

  • Tables
  • Fig 1.
    • Download figure
    • Open in new tab
    • Download powerpoint
    Fig 1.

    A and B, MR images showing the MR spectroscopy voxel placement. A, Midline sagittal T2-weighted MR image (TR/TE/NEX, 6790/103 ms/4) of a first-episode patient shows the 1H-MR spectroscopic voxel placement. The maximal anteroposterior length (L) of the corpus callosum is identified (between points a’ and p’). The line drawn perpendicular to the a’p’ line at the anterior one-third point (point t) constitutes the posterior border of posterior genu region (separates the posterior genu from anterior midbody region). The horizontal line (line ac) drawn from the most anterior point of the corpus callosum (point a) to the “crook” of the genu (point c) separates the superior genu above and the inferior genu (open white arrow) below. The 1H-MR spectroscopic voxel (black arrow) is placed into the superior and posterior genu of the corpus callosum. B, Coronal T1-weighted MR image (TR/TE/NEX, 530/30 ms/2) demonstrates the voxel placement into the genu of the corpus callosum.
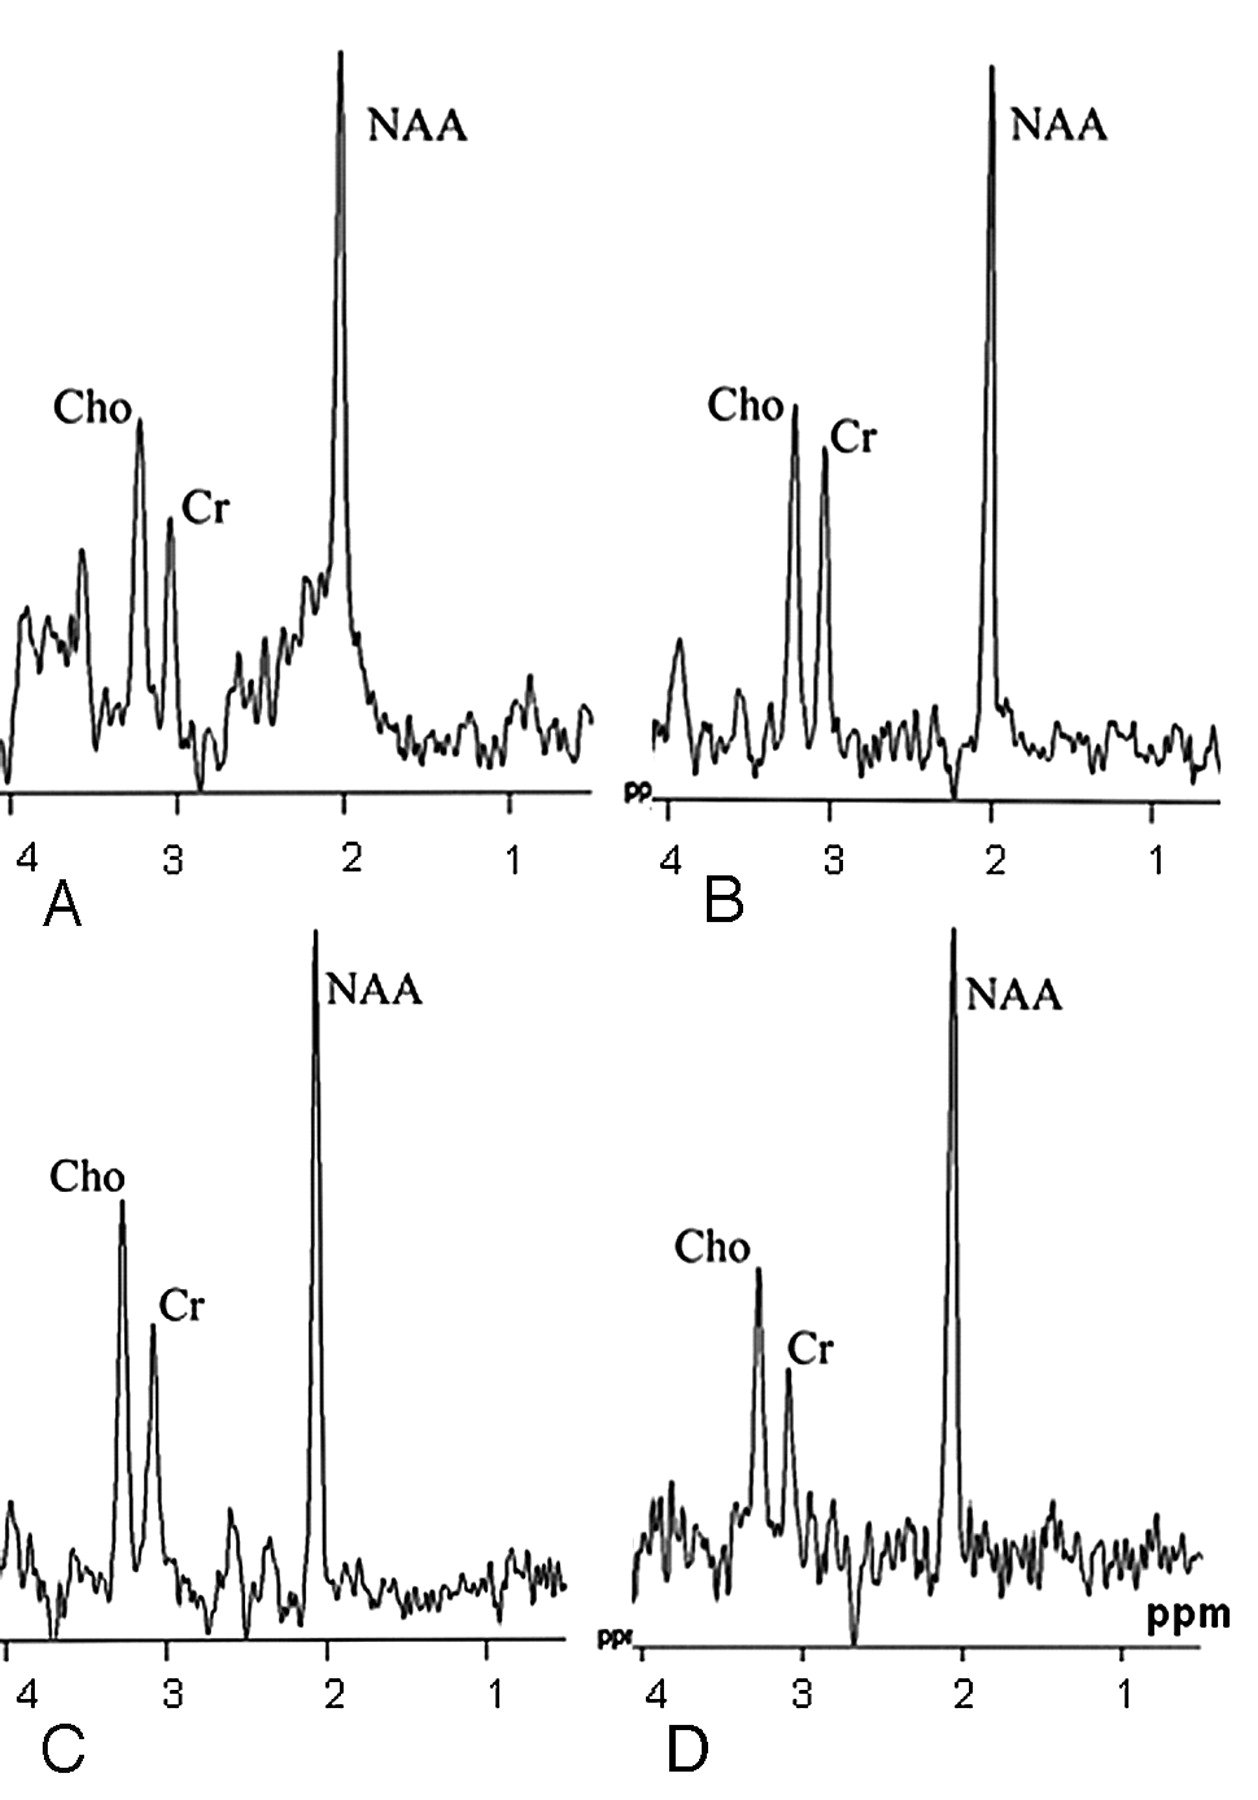
  • Fig 2.
    • Download figure
    • Open in new tab
    • Download powerpoint
    Fig 2.

    A–D, The proton MR spectra (STEAM, TR = 3.5 seconds) obtained from a first-episode patient with different TE values (TE = 30, 65, 135, and 300 ms, respectively) show the major neurometabolite peaks (NAA at 2.02 ppm, Cr at 3.02 ppm, and Cho at 3.22 ppm).

  • Fig 3.
    • Download figure
    • Open in new tab
    • Download powerpoint
    Fig 3.

    The box-plot graph demonstrates the distribution of NAA concentrations around the median values of all patients (P) and of the control subjects (C). The horizontal lines dividing the boxes represent the median values. The upper and lower edges of the boxes represent the upper and lower quartiles (medians of the upper and lower 50% of the values), respectively. The vertical lines (whiskers) are 1.5 times the inner quartile spread in length, which is measured from the median.

  • Fig 4.
    • Download figure
    • Open in new tab
    • Download powerpoint
    Fig 4.

    A–C, The scatter plots show the relationships between the NAA concentrations (mmol/kg brain) of all patients and the severity of symptoms. The lines between the 95% confidence curves represent linear regression lines. A, The negative correlation between the NAA concentrations and BPRS scores (r = −0.59, P = .001). B, The relationship between the NAA concentrations and severity of negative symptoms (SANS scores) (r = −0.68, P < .001). C, The association (r = −0.41, P = .028) of NAA concentrations with the severity of positive symptoms (SAPS scores).

Tables

  • Figures
    • View popup
    Table 1:

    Clinical and demographic characteristics of the patients and control subjects*

    FE GroupChronic GroupCombined Group
    FE Patients (n = 12)Controls (n = 14)Chronic Patients (n = 16)Controls (n = 14)All Patients (n = 28)All Controls (n = 28)
    Age (y)25.50 ± 5.7625.16 ± 5.3529.31 ± 11.4128.93 ± 10.2427.65 ± 9.4627.32 ± 8.58
    Male/Female8/49/511/59/519/918/10
    Education (y)10.33 ± 4.4710.33 ± 3.8911.00 ± 3.6511.00 ± 3.4010.71 ± 3.9610.71 ± 3.56
    Age at onset (y)24.83 ± 5.3022.37 ± 8.7223.35 ± 7.13
    No. of hospitalizations–4.30 ± 3.90–
    DUP (months)11.20 ± 10.20––
    Duration of illness (months)–83.25 ± 68.65–
    Psychopathology scores
        BPRS58.75 ± 8.6067.56 ± 11.1863.92 ± 10.96
        SANS40.00 ± 17.6250.37 ± 26.9345.92 ± 23.60
        SAPS36.58 ± 17.1143.87 ± 15.8940.75 ± 16.52
    • Note:—FE indicates first-episode; –, data not available.; DUP, duration of untreated psychosis; BPRS, Brief Psychiatric Rating Scale; SANS, Scale for the Assessment of Negative Symptoms; SAPS, Scale for the Assessment of Positive Symptoms.

    • * Data are given as mean ± SDs except where indicated.

    • View popup
    Table 2:

    The metabolite concentrations and T2B values of the patients and control subjects*

    SubjectsMetabolite Concentrations (mmol/kg brain)T2B Values (ms)
    N-acetylaspartateCreatineCholine
    First-episode group
        Patients (n = 12)8.97 ± 0.823.63 ± 0.231.21 ± 0.0876.17 ± 12.26
        Controls (n = 14)10.41 ± 0.453.56 ± 0.271.18 ± 0.0757.93 ± 6.85
        SignificanceP < .001P = .54P = .39P < .001
    Chronic group
        Patients (n = 16)8.86 ± 0.893.68 ± 0.351.22 ± 0.0978.03 ± 12.09
        Controls (n = 14)10.40 ± 0.443.72 ± 0.251.26 ± 0.1060.57 ± 7.85
        SignificanceP < .001P = .66P = .99P < .001
    Combined group
        Patients (n = 28)8.91 ± 0.843.65 ± 0.301.24 ± 0.1177.23 ± 11.97
        Controls (n = 28)10.40 ± 0.443.64 ± 0.271.22 ± 0.1059.25 ± 7.35
        SignificanceP < .001P = .84P = .45P < .001
    • * Data are given as mean ± SD.

PreviousNext
Back to top

In this issue

American Journal of Neuroradiology: 28 (10)
American Journal of Neuroradiology
Vol. 28, Issue 10
November 2007
  • Table of Contents
  • Index by author
Advertisement
Print
Download PDF
Email Article

Thank you for your interest in spreading the word on American Journal of Neuroradiology.

NOTE: We only request your email address so that the person you are recommending the page to knows that you wanted them to see it, and that it is not junk mail. We do not capture any email address.

Enter multiple addresses on separate lines or separate them with commas.
Quantitative Proton MR Spectroscopy Findings in the Corpus Callosum of Patients with Schizophrenia Suggest Callosal Disconnection
(Your Name) has sent you a message from American Journal of Neuroradiology
(Your Name) thought you would like to see the American Journal of Neuroradiology web site.
CAPTCHA
This question is for testing whether or not you are a human visitor and to prevent automated spam submissions.
Cite this article
K. Aydin, A. Ucok, S. Cakir
Quantitative Proton MR Spectroscopy Findings in the Corpus Callosum of Patients with Schizophrenia Suggest Callosal Disconnection
American Journal of Neuroradiology Nov 2007, 28 (10) 1968-1974; DOI: 10.3174/ajnr.A0691

Citation Manager Formats

  • BibTeX
  • Bookends
  • EasyBib
  • EndNote (tagged)
  • EndNote 8 (xml)
  • Medlars
  • Mendeley
  • Papers
  • RefWorks Tagged
  • Ref Manager
  • RIS
  • Zotero
0 Responses
Respond to this article
Share
Bookmark this article
Quantitative Proton MR Spectroscopy Findings in the Corpus Callosum of Patients with Schizophrenia Suggest Callosal Disconnection
K. Aydin, A. Ucok, S. Cakir
American Journal of Neuroradiology Nov 2007, 28 (10) 1968-1974; DOI: 10.3174/ajnr.A0691
del.icio.us logo Twitter logo Facebook logo Mendeley logo
  • Tweet Widget
  • Facebook Like
  • Google Plus One
Purchase

Jump to section

  • Article
    • Abstract
    • Methods
    • Results
    • Discussion
    • References
  • Figures & Data
  • Info & Metrics
  • Responses
  • References
  • PDF

Related Articles

  • No related articles found.
  • PubMed
  • Google Scholar

Cited By...

  • No citing articles found.
  • Crossref
  • Google Scholar

This article has not yet been cited by articles in journals that are participating in Crossref Cited-by Linking.

More in this TOC Section

  • Progression of Microstructural Damage in Spinocerebellar Ataxia Type 2: A Longitudinal DTI Study
  • SWI or T2*: Which MRI Sequence to Use in the Detection of Cerebral Microbleeds? The Karolinska Imaging Dementia Study
  • Statin Therapy Does Not Affect the Radiographic and Clinical Profile of Patients with TIA and Minor Stroke
Show more Brain

Similar Articles

Advertisement

Indexed Content

  • Current Issue
  • Accepted Manuscripts
  • Article Preview
  • Past Issues
  • Editorials
  • Editor's Choice
  • Fellows' Journal Club
  • Letters to the Editor
  • Video Articles

Cases

  • Case Collection
  • Archive - Case of the Week
  • Archive - Case of the Month
  • Archive - Classic Case

More from AJNR

  • Trainee Corner
  • Imaging Protocols
  • MRI Safety Corner
  • Book Reviews

Multimedia

  • AJNR Podcasts
  • AJNR Scantastics

Resources

  • Turnaround Time
  • Submit a Manuscript
  • Submit a Video Article
  • Submit an eLetter to the Editor/Response
  • Manuscript Submission Guidelines
  • Statistical Tips
  • Fast Publishing of Accepted Manuscripts
  • Graphical Abstract Preparation
  • Imaging Protocol Submission
  • Evidence-Based Medicine Level Guide
  • Publishing Checklists
  • Author Policies
  • Become a Reviewer/Academy of Reviewers
  • News and Updates

About Us

  • About AJNR
  • Editorial Board
  • Editorial Board Alumni
  • Alerts
  • Permissions
  • Not an AJNR Subscriber? Join Now
  • Advertise with Us
  • Librarian Resources
  • Feedback
  • Terms and Conditions
  • AJNR Editorial Board Alumni

American Society of Neuroradiology

  • Not an ASNR Member? Join Now

© 2025 by the American Society of Neuroradiology All rights, including for text and data mining, AI training, and similar technologies, are reserved.
Print ISSN: 0195-6108 Online ISSN: 1936-959X

Powered by HighWire