
Abstract
BACKGROUND AND PURPOSE: The cross-sectional rate of whole-brain N-acetylaspartate (NAA, a neuronal cell marker) loss in clinically similar relapsing-remitting multiple sclerosis (RRMS) patients has recently been shown to fall into 3 distinct decline rate strata. Our goal was to test the reproducibility of this observation in a new cohort of RRMS patients.
MATERIALS AND METHODS: Sixteen serial patients (12 women, 4 men, median age 38 [27–55] years) with clinically definite RRMS for an average of 5 (0.3–18) years’ disease duration and a mean Expanded Disability Status Score of 2.0 (0–6) were studied, once each. Their whole-brain NAA (WBNAA) amounts, obtained with proton MR spectroscopy, were divided by brain volumes (segmented from MR imaging) to yield concentrations suitable for cross-sectional comparisons.
RESULTS: Three distinct strata of cross-sectional NAA decline rates were found: −0.031, −0.32, and −1.71 mmol/L/y when disease duration was estimated from confirmed diagnosis, or −0.057, −0.20, and −1.38 mmol/L/y when measured from the first clinical symptom. These rates and their corresponding fractions of the study population were indistinguishable from those reported previously in a different group of 49 clinically similar (mean Expanded Disability Status Score also 2.0) RRMS patients.
CONCLUSION: Reproducing the previous cohort’s cross-sectional WBNAA decline characteristics in this new group of clinically similar RRMS patients indicates that 3 WBNAA loss strata may be a general attribute of MS. Consequently, WBNAA could serve as a surrogate marker for the global load of neuronal and axonal dysfunction and damage in this disease.
Multiple sclerosis (MS), the most prevalent demyelinating neurologic disorder, is the primary cause of nontraumatic disability in young and middle-aged adults, affecting more than 350,000 Americans.1 Although MS is incurable at present, several disease-modifying drugs are now available for its treatment.2 Given the cost and side effects of these drugs, as well as the widely variable course of this disease, an ability to predict the outcome of MS from factors accessible early in its course could influence therapeutic decisions, the planning and interpretation of clinical trials.
Studies on the natural history of MS have focused on identifying early clinical indicators of relative risk for rapid progression.3–7 Based on some parameters (eg, frequency of relapses in the first 2 years; interval between the first and the second relapses; and time to reach moderate, level 3 on the Kurtzke Disability Status Scale), it has been possible, to some extent, to distinguish patients with “benign” disease from those with “moderate” or “rapidly progressive” disease. For example, Confavreux et al found that the mean duration between the first and second relapse among 349 patients was about 6 years in benign and intermediate disease versus 0.9 years in “hyper acute” MS and 2.4 years in “acute” MS.8 However, extensive interindividual variations in disability accumulation rates and the fact that exacerbations most often do not result in permanent disability preclude accurate prediction of the clinical course of MS.6
Because the irreversible neurologic deficits of MS are thought to be caused by neuronal cell loss,9–11 surrogate markers specific for the degeneration and dysfunction of these cells correlate better with clinical disability12 and might better predict outcome.12 Key among these markers is N-acetylaspartate (NAA), the second most abundant amino acid in the mammalian brain.13–16 Being almost exclusive to neurons and their processes, NAA is widely considered a specific marker for their health and concentration,17–19 and its noninvasive acquisition renders it the most frequently examined brain metabolite.20 With the sole known exception of Canavan disease,21 NAA concentration has been reported to decline in all neurodegenerative disorders.14,22
In a previous study we have shown 3 differential strata of whole-brain NAA (WBNAA) decline rates,23 which probably reflect axonal dysfunction, in 49 clinically similar relapsing-remitting (RR) MS patients. Based on their cross-sectional rates of NAA decline—which comprised one WBNAA measurement per patient combined with the assumption that when they were diagnosed, their WBNAA levels were at the “normal” level—these strata were “stable” (exhibiting level WBNAA), “moderate” (sustaining 2.7% annual NAA loss), and “rapid” (suffering a 10-fold faster decline).23 The goal of the present study was to examine whether these findings are reproducible (ie, constitute a general characteristic of the disease) in another cohort of clinically similar RR MS patients. This was done by analyzing their WBNAA concentrations in patients with the same protocol as in the original study.23
Methods
Patients
Sixteen RRMS patients (12 women, 4 men, median age 38 [27–55] years) were recruited serially based on 4 criteria: 1) clinically definite (CD) disease,24 2) MS of less than 12 years’ duration, 3) no relapse experienced in the last 3 months, and 4) no contraindications to MR imaging. Their age, sex, disease duration, Expanded Disability Status Scale (EDSS) scores, and medications are shown in Table 1. All patients were briefed on the procedure they were to undertake and gave their Institutional Review Board–approved written consent.
Cohort details
Because months and even years may elapse between the 2 clinical events that confirm MS diagnosis,24 we defined 2 disease durations: ΔY1, the time from the second (confirming) event:  1)
1)
and ΔY2, the time from the first symptom (FS), which better approximates true disease duration:  2)
2)
MR Imaging and Brain Volume
Patients’ brain volumes (VB) were segmented from their T1-weighted sagittal magnetization-prepared rapid acquisition of gradient-echo images (TE/TR/TI of 7.0/14.7/300 ms, 128 sections 1.5 mm thick, 2562 matrix, 210 × 210 mm2 FOV) by using the MIDAS package.25 Specifically, a “seed” region was placed in periventricular white matter. Following selection of all pixels at or above the gray matter intensity, a brain mask was constructed in 3 steps: 1) morphologic erosion, 2) recursive region growth-retaining pixels connected to the seed region, and 3) morphologic inflation to reverse the erosion. The masks were truncated at the foramen magnum to incorporate the brain stem and cerebellum but not the cord, and VB was obtained by multiplying the number of pixels in the mask by their volume.
MR Spectroscopy and WBNAA Quantification
The amount of WBNAA, QNAA, was obtained in the same session. Following auto-shimming that yielded consistent 15 ± 3-Hz full-width-at-half-maximum head water linewidth, a nonlocalizing, nonecho (TR/TE of 10.0/0.0 seconds) 1H-MR spectroscopy sequence yielded the whole-head NAA signal intensity.26–28 Absolute quantification was done against a reference 3-L sphere of 1.5 × 10⁻² moles NAA in water. Patient and reference NAA peak areas, SP and SR, were integrated and QNAA was estimated:  3) where VR180° and VS180° are the voltages into 50 Ω of radiofrequency power needed for nonselective 1-millisecond, 180° inversion on the reference and patient, reflecting their relative receive sensitivities.
Finally, to account for natural variations in brain size, QNAA from Equation (3) was divided by the patient’s VB to obtain the WBNAA concentration:  4) which is independent of brain size and is therefore suitable for cross-sectional comparison. The intra- and interpatient variability of such concentrations in healthy adults have been shown to be approximately ±0.6 mmol/L.26,29
WBNAA Decline Rate Estimates and Group Partitioning
The original study estimated individual WBNAA decline rates with only one measurement by using 3 assumptions: 1) The second time point can be obtained by assuming each patient’s WBNAA to be the average of healthy controls (13.2 mmol/L)23,26 before disease onset. 2) NAA loss begun at either CD or FS (ie, its duration, ΔY1 or ΔY2) is known. 3) WBNAA changes during ΔY1 or ΔY2 were linear. Consequently, the decline rate for the ith patient from either CD (R1i) or FS (R2i) was23  5a) or
  5b)
5b)
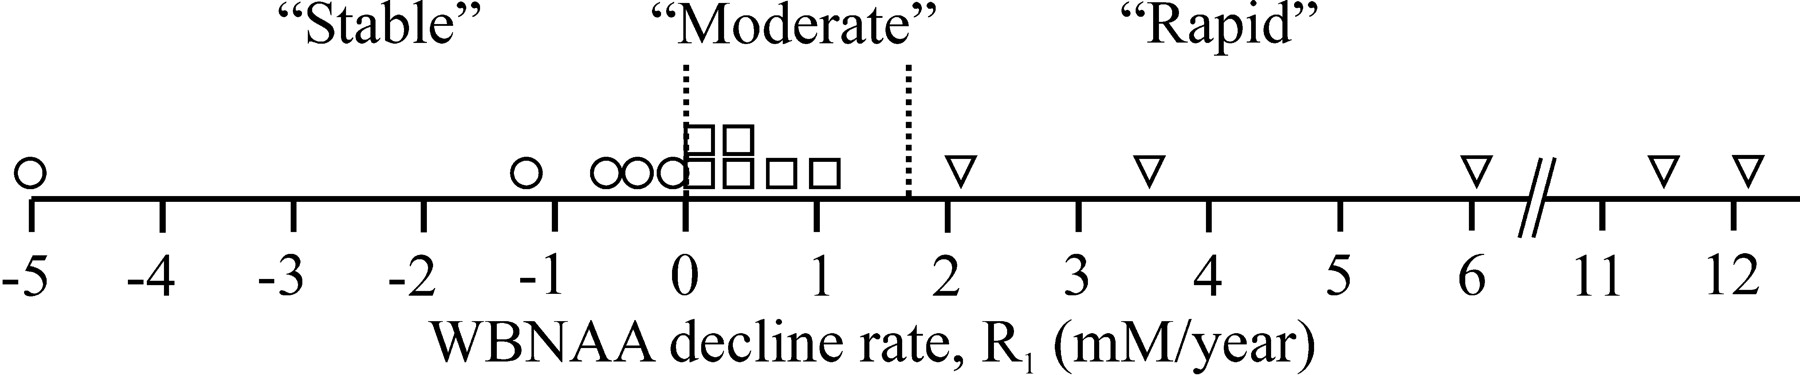
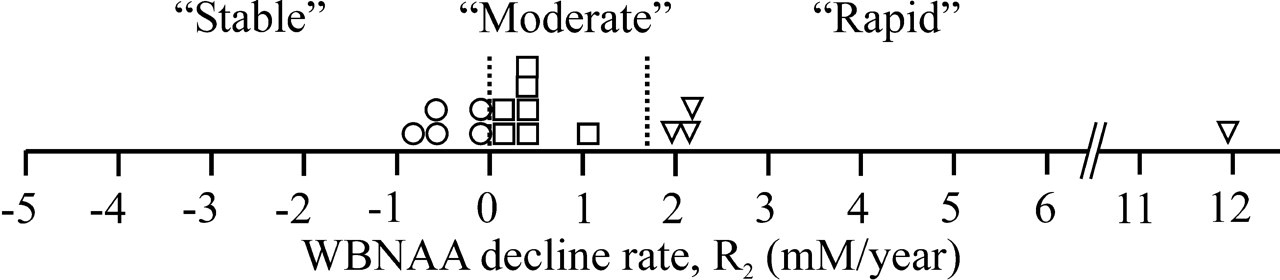
Patients were classified as stable if their R was less than 0 mmol/L/y, moderate if between 0 and 1.7 mmol/L/y, and rapid if greater than 1.7 mmol/L/y, as shown in Figs 1 and 2.23

Dot-plot distribution of individual patients as a function of average rate of WBNAA decline per year of CD disease duration (R1), as defined by Equations (1) and (5a). The vertical dotted lines at R1 = 0 and 1.7 mmol/L/y partition the cohort into stable (○), moderate (□), and rapid (▿) according to criteria defined in the text.23

Same as Fig 1, except that the average individual rates of WBNAA decline per year, R2, were estimated for disease duration from FS, ΔY2, as defined by Equations (2) and (5b). The vertical dotted lines at R1 = 0 and 1.7 mmol/L/y partition the cohort into stable (○), moderate (□), and rapid (▿) decline rates according to criteria defined in the text.23
Statistical Analyses
Constrained least-squares regression was used to construct a model to predict WBNAA as a linear function of elapsed time from either CD or FS, subject to the first assumption above; that is, that at either time point of CD or FS, the WBNAA level was within the normal range of 13.2 ± 3 SD, 3 × 0.6 mmol/L.26,29,30 This cutoff was chosen to ascertain 99% likelihood that a given patient was outside the normal WBNAA range. Comparison of 2 independent binomial proportions was used to calculate the similarity of group distributions between the current and previous datasets.
Results
Individual WBNAA decline rates were derived according to Equation (5). Based on the previous group assignment rules outlined above,23 for disease duration from CD, ΔY1, 5 of the 16 patients were classified as stable, 7 as moderate, and 4 as rapid, as shown in Fig 1. For ΔY2, 5 patients were classified as stable, 6 as moderate, and 5 as rapid, as shown in Fig 2.
Cross-sectional rates of WBNAA decline derived from constrained linear regression in each of these subgroups (stable, moderate, and rapid, respectively) were −0.031, −0.32, and −1.71 mmol/L/y when based on ΔY1 and −0.057, −0.20, and −1.38 mmol/L/y when based on ΔY2. The individual WBNAA values versus ΔY1 and ΔY2 are plotted in Figs 2 and 4, respectively, which are overlaid with the current regression (solid) lines and the 95% confidence intervals for the regressions of these subgroups in the original study.23 The slopes of the current regression lines were not different from those in the original study (P > .05). Summary statistics of the previous and current cohorts are compared in Table 2.
Comparison between present and previous cohorts
Discussion
This study reproduced the 3 key findings of the original report.23 Specifically, 1) both clinically similar (ie, mean EDSS score of 2.0) patient cohorts were readily subdivided into 3 distinct groups of cross-sectional WBNAA decline rates, 2) these decline rates were statistically similar to their respective counterparts, and 3) each subgroup’s percentage of the entire cohort population was statistically indistinguishable from that of the original study.
Number of Decline Subgroups.
Because any unconstrained number of data points can be divided into separate groups, no statistical methodology can objectively determine an optimal number of subgroups. Visual inspection of individual WBNAA levels plotted against disease duration for either ΔY1 or ΔY2 in Figs 3 and 4, however, readily reveals 3 such subgroups. This determination is bolstered by the resulting regression lines that so closely match the respective ones from the original study on a different patient cohort.

Individual WBNAA levels as a function of ΔY1 (from clinical diagnosis) of Equation (1) (labeled according to Fig 1). Solid lines are the regressions calculated for each subgroup. The dashed lines are the ±95% confidence intervals calculated for the subgroups of the previous cohort.23 Note how well the current regressions fit into the previous cohort’s confidence intervals.23

Individual WBNAA levels as a function of ΔY2 (from fist symptom) of Equation (2) (labeled according to Fig 2). Solid lines are regressions for each subgroup. The dashed lines are the ±95% confidence intervals calculated for the subgroups of the previous cohort.23 Note how well the regression lines for the current patients fit into the previous cohort’s confidence intervals.23
Subgroup Cross-Sectional Decline Rates.
For each subgroup, the linear prediction models derived from the current data fall within the 95% confidence intervals of the previous patients’ data (Figs 3 and 4). Accordingly, a test of 2 binomial proportions determined that the group WBNAA decline rates were not different from those in the original study (P > .05).
Subgroup Populations as Fraction of Total Cohort.
A test of 2 binomial proportions determined that the group size percentages of the current and previous cohorts, shown in Table 2, are indistinguishable, despite the smaller sample size in this study. In the CD groups, most patients are defined as moderate, with fewer being found in the stable and rapid groups. Although the partitioning from FS is more uniform, its similarity to the group distribution percentage of the original data is nonetheless statistically significant.
These observations are bolstered by the known epidemiology of MS (eg, as described by Weinshenker), which supports the notion of 3 levels of severity: “benign,” “intermediate,” and “acute”.31 Ascertaining these levels for individual patients, however, is currently possible only retrospectively, years after diagnosis. This delay poses serious limitations for several reasons. First, substantial WBNAA losses (exceeding 22%) were observed in monosymptomatic patients only suspected of having MS, indicating, together with irreversible tissue loss, that early widespread damage occurs even before a confirmed diagnosis of MS.30,32,33 Second, early drug treatment after the first clinical symptom has been shown to delay conversion to CD MS,32,34 underscoring the need to triage patients for treatment based on some surrogate marker, especially considering the absence of a clinical indicator. Third, since the administration and pace of treatment (type, dose, and frequency of administration) must be weighed versus cost and side effects, the a priori knowledge of future disease course could identify patients who would benefit most from therapy and help determine its level. Finally, recruiting patients who exhibit the most common form of the disease (as opposed to its mild or virulent forms) is important in setting up clinical drug trials. Identification of such patients could help avert errors of the kind where an ineffective drug is assumed efficacious due to the influence of “stable” patients (a type I statistical error) or when an effective drug is judged to be a failure because of the undue influence of rapidly declining patients (a much more expensive type II error).
Note that although 3 assumptions were used for the analyses above, we argue that these assumptions are reasonable. First, that the WBNAA decline started from approximately the average level of healthy controls (13.2 mmol/L)26,29,30 is easily justified by the low variability in the latter (±6%–7%).26,29,30 The second assumption, that disease duration is known (either ΔY1 or ΔY2), is more equivocal; that is, because MS etiology is unknown, so is its true time of onset. Nevertheless, since ΔY2 approximates disease duration better than does ΔY1, the minimal changes in subgroup traits based on either one (only one patient [no. 7] in Table 1 switched assignment) indicate that either is sufficient. The fact that the moderate and rapid subgroup regression lines do not intersect the normal range at t = 0 (ie, we take this intercept to be the “true” time of disease onset) is just an overall indicator of the “softness” of the approximation that the disease started at CD or FS. Furthermore, the distinction between ΔY1 and ΔY2 continues to diminish as radiologic criteria to confirm MS after a single clinical episode become ubiquitous.35–37 Finally, the assumption that the WBNAA decline was linear over ΔY1 or ΔY2, though the least robust of the 3 assumptions, is still reasonable. Although De Stefano et al reported that NAA declines fastest early in the course of the disease and slows down with the transition from RR into the secondary progressive form,12 that process may, in most patients, take many years, even decades. A linear approximation initially, therefore, is reasonable when patients are younger, when the future course of their disease is least well known, and when they are more likely to benefit from treatment.
Importantly, although this study estimates rates of decline based on the above-mentioned assumptions, these rates can only be validated in a longitudinal study. In such a study, each patient would be assigned an estimated rate category based on his or her WBNAA at entry, and his or her true individual WBNAA decline rate would then be measured over time. Although clearly important, such a study would require much more time and a larger cohort to establish statistical power of prediction. It would be even more interesting if the estimated WBNAA decline rate predicted initially would not only be validated longitudinally, but would also be correlated with the clinical disability accumulated by these patients over time.
Conclusion
This study successfully reproduced the partitioning of a population of clinically similar RRMS patients into 3 separate cohorts of cross-sectional WBNAA decline. This supports the premise that the existence of different subgroups of NAA decline rates is probably a general characteristic of RRMS. Because decreased NAA has been demonstrated in MS lesions, and its decline is associated with neuronal dysfunction and subsequent clinical disability, these 3 distinct rates of WBNAA dynamics are likely to correlate with disease progression.11,38–40 If validated in a longitudinal study, WBNAA could be used as a marker to predict each patient’s future disease course, a forecast for which the current laboratory and clinical markers are still inadequate.
Footnotes
This work was supported by NIH grants EB01015, NS050520, and NS29029 and by the Martin S. Davis Research Fellowship Endowment from the National Multiple Sclerosis Society.
References
- Received January 2, 2006.
- Accepted after revision March 22, 2006.
- Copyright © American Society of Neuroradiology


