
Abstract
BACKGROUND AND PURPOSE: To evaluate interobserver reliability of obtaining CT perfusion (CTP) data for qualitative identification of perfusion abnormality and quantitative assessment through regions-of-interest (ROIs) placement.
MATERIALS AND METHODS: Six observers participated in the study (neuroradiology attending physician, neurology attending physician, neuroradiology fellow, radiology resident physician, senior and junior CT technologists). After a brief training session, each observer evaluated 20 CTP datasets for qualitative identification of a right- or left-sided perfusion abnormality or symmetric perfusion. Observers also placed a single ROI of standard size to obtain quantitative data on the most severely hypoperfused region. An additional 10 ROIs were placed on the cortex to quantitatively evaluate global cortical perfusion. Mean quantitative cerebral blood flow (CBF), cerebral blood volume (CBV), and mean transit time (MTT) values were analyzed.
RESULTS: The κ values for qualitative assessment of a perfusion abnormality ranged from 0.55 to 1.0. Coefficients of variation for quantitative assessment of ischemia/infarct region were 27.10% for CBF, 13.33% for CBV, and 4.66% for MTT. Coefficients of variation for quantitative assessment of global cortical perfusion were 11.88% for CBF, 13.66% for CBV, and 3.55% for MTT. The junior CT technologist and neuroradiology fellow showed significant differences compared with other observers for the ischemia/infarct region and global cortical perfusion, respectively.
CONCLUSION: Overall, quantitative differences seen in this study would not necessarily affect quality of interpretation of ischemia/infarct region or global cortical perfusion. Therefore, obtaining qualitative and quantitative CTP data can reliably be performed in the clinical setting among observers with various levels of skill and experience when using a uniform and standard technique.
CT perfusion (CTP) imaging has been gaining recognition in the clinical setting for evaluation of patients with cerebrovascular diseases. However, the role of CTP in patients with acute stroke has not yet been determined. CTP is an attractive technique to implement in the acute setting because of its widespread availability, its minimal patient risk, and its ability to acquire data promptly. Additional advantages include its ability to provide both qualitative and quantitative information of cerebral blood flow (CBF), cerebral blood volume (CBV), and mean transit time (MTT). This information is derived from postprocessing the axial source images obtained from continuous rapid scanning through a fixed level in the brain during the intravenous injection of a small contrast bolus. CTP can be postprocessed using commercially available software programs to generate the CBF, CBV, and MTT maps. Postprocessing of data is performed by people with various levels of skill and experience, ranging from radiology attending physicians to CT technologists. Our previous work has shown that the quantitative values of CBF, CBV, and MTT obtained from postprocessing CTP datasets are reproducible among different observers when establishing a uniform and standard postprocessing technique.1 Now it becomes important to evaluate the variability that may also exist among different observers to qualitatively identify a perfusion abnormality and the variability in obtaining quantitative data by region-of-interest (ROI) placement.
The purpose of this study is to evaluate the interobserver reliability of qualitatively and quantitatively obtaining CTP data among different observers with varying levels of skill and experience.
Materials and Methods
Patients
The CTP axial source images acquired from 20 patients were used as the standard dataset in this study; consisting of inpatients and outpatients who presented to our institution during a 4-month period from July through November 2004. Sixteen patients had asymmetric perfusion deficits corresponding to various degrees of ischemia/infarct, and 4 patients had symmetric perfusion. Eight men and 12 women were included in the study. The mean age was 63 years and the range was 31–81 years. The clinical indications for performing CTP in this study population included work-up for acute stroke, vasospasm, and chronic cerebral ischemia. Institutional Review Board (IRB) approval was obtained for this study protocol.
CT Perfusion Scanning Protocol
Patient preparation included removing metallic hardware from dental and hair prosthetics to minimize distortion artifact and placing an 18- or 20-gauge peripheral intravenous catheter for contrast injection. Central venous catheters may be used in selected patients according to departmental policy only if peripheral access is not available.2 There is a standard protocol for performing CT perfusion at our institution using a deconvolution-based method with cine scanning mode (cine 4i) on the LightSpeed or Pro-16 scanners (General Electric Medical Systems, Milwaukee, Wis). The kVp/mA is set at 80/190 and power injection of 45 mL of nonionic contrast (300 mg iodine/mL) at 4.0 mL/s is performed using a 5-second delay. The gantry angle is parallel to and above the orbital roof to avoid radiation exposure to the lens. The total scan time is 45 seconds. Low or iso-osmolar contrast is preferred to minimize the risk of adverse reactions. The acquired source images are then transferred to an Advantage Windows workstation (General Electric) for postprocessing of the parametric maps of CBF, CBV, and MTT using a commercially available software package (CT Perfusion Version 3.0; General Electric).
Study Design
Interobserver Reliability.
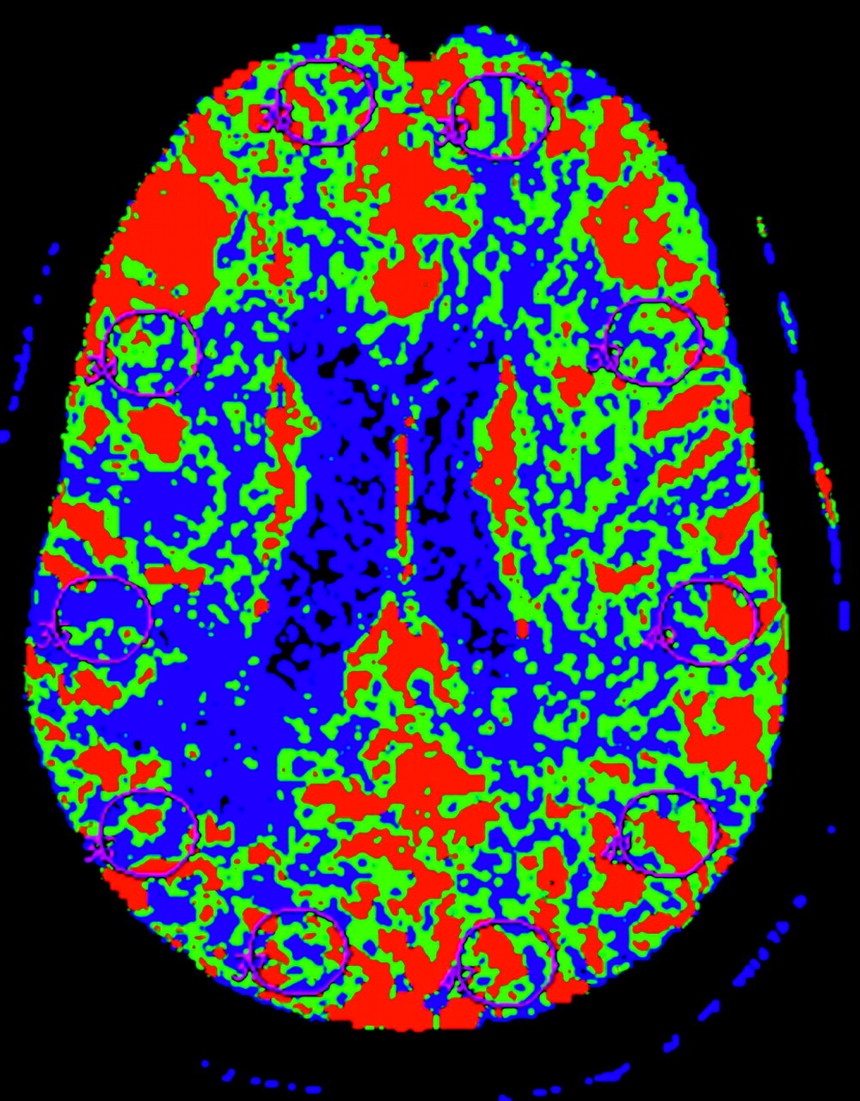
Six observers with various levels of skill participated in the study, including a junior CT technologist, a senior CT technologist, a 3rd-year radiology resident physician, a neuroradiology fellow, a neurology attending physician, and a neuroradiology attending physician (Table 1). To maintain anonymity, each observer was assigned an identification number randomly to use on all data collection and analysis. All observers received the same 30-minute training session from a neuroradiology attending physician who was not among the observers. The training session was to provide a general working knowledge of the postprocessing software program and an understanding of selection of the user-defined parameters based on previously published recommended guidelines.3 Emphasis was placed on appropriate placement of the ROI to obtain quantitative data of CBF, CBV, and MTT. First, the observers were instructed to perform qualitative analysis by comparing the hemispheres of the brain to identify an ischemia/infarct abnormality. The possible findings the observers recorded were 1 for a right hemisphere abnormality, 2 for a left hemisphere abnormality, and 3 for symmetric perfusion. The observers also placed a single ROI in the region of the identified abnormality, representing the most severely hypoperfused region in the perfusion abnormality. To assess global cortical perfusion, the observers placed 10 additional ROIs sampling the following brain regions: 1 ROI in the right anterior cerebral artery (ACA) territory, 3 ROIs in the right middle cerebral artery (MCA) territory, 1 ROI in the right posterior cerebral artery (PCA) territory, 1 ROI in the left ACA, 3 ROIs in the left MCA, and 1 ROI in the left PCA (Fig 1). The observers were instructed to avoid the major vascular structures in the Sylvian fissure when placing ROIs to represent the MCA territory. To limit performance bias, each observer had 10 practice cases to postprocess in a single day that were not included in the data analysis. Upon completion of the practice cases, there was a 14-day waiting period to minimize the potential bias of recent instruction. The observers were then given the standard 20 CTP dataset to analyze in a 5-day period.

Cerebral blood flow map demonstrates placement of the standard region-of-interest (ROI) sampling global cortical perfusion with ROI in the bilateral anterior, middle, and posterior cerebral artery territories.
Experience level of observers
Intraobserver Variability.
Each observer repeated postprocessing a standard subset of 10 cases from the original 20 CTP dataset to evaluate intraobserver reproducibility. To limit recall bias, at least a 14-day waiting period occurred between postprocessing the 2 datasets for each observer. The same instructions were applied for this section of the study protocol, as above.
Data Analysis
A neuroradiologist who was not included as an observer created a template of a single ROI to replicate identical size and shape for each observer to apply when obtaining the quantitative information. Mean quantitative values of CBF, CBV, and MTT on all 4 CTP section locations for all patients were used in the statistical analysis. Descriptive statistics, including mean, SD, and range, were calculated. The agreement rate for the observers to detect qualitative perfusion abnormality was assessed by κ statistic. Coefficient of variation was used to assess the degree of variability in the quantitative data generated from the different observers, representing the measurement error made based solely on different observers selecting ROI placement. One-way analysis of variance (ANOVA) statistical analysis was used to detect significant differences in the mean quantitative values of CBF, CBV, and MTT among the different observers’ results for the identified ischemia/infarct region, as well as for all 10 ROIs placed in the brain sampling global cortical perfusion. Further analysis with pairwise comparison of the observers was performed using Bonferroni correction to detect which observers had significantly different quantitative values. Pearson correlation coefficient to assess the agreement in the quantitative values among the varying skill levels of the observers was used for all possible observer pairings.
Results
20 CTP datasets were included in the study with a total of 1440 parametric CT perfusion maps processed from the 6 different observers. A total of 13,200 standard ROI placements were included in the data analysis from the ischemic/infarct region, as well as all ROI placements sampling the cortex.
Qualitative Assessment of Ischemia/Infarct
Each observer performed qualitative evaluation of the CTP maps by comparing the hemispheres to identify asymmetric areas of decreased perfusion, representing ischemia/infarct. The observers recorded the presence of a right- or left-sided abnormality, or symmetric perfusion for each patient. Sixteen of the 20 patients had a unilateral perfusion abnormality, and the remaining 4 patients had symmetric perfusion. κ statistic was used to assess the agreement rate among all observers (Table 2). Overall, the κ values among all possible pairings of observers range from 0.55 to 1.0, representing agreement rates in the good to excellent range. The neurology attending physician had the lowest agreement rates with the other 5 observers but still performed in a moderately good range. In contrast, the senior CT technologist had the highest agreement rates. The κ value among all observers for a right-sided perfusion abnormality was 0.76 and a left-sided perfusion abnormality was 0.82.
Qualitative assessment of ischemia/infarct (κ statistics)
Quantitative Assessment of Ischemia/Infarct
Our previous work has shown reproducibility among these same observers postprocessing these 20 CTP datasets.1 Comparison of the mean quantitative CBF, CBV, and MTT values for the different observers showed no significant differences in the standard ROI sampling of the ischemia/infarct region, cortex, and white matter.1
Of the 20 patients, 16 had asymmetric perfusion abnormalities representing various degrees of ischemia/infarct. The 5 observers placed a single ROI of standard size and shape in the most severely hypoperfused region of the perfusion abnormality. The neurology attending physician did not participate in this section of the study because ROI sampling of the ischemia/infarct region was not performed. The mean quantitative CBF, CBV, and MTT for the ROI sampling of the ischemia/infarct region of all patients was calculated for each observer (Table 3). The coefficients of variation among all observers for the mean CBF, CBV, and MTT were 27.10%, 13.33%, and 4.66% (Table 4). Comparison of mean CBF in the ischemia/infarct region for all observers showed a significant difference when using one-way ANOVA (F4,74, P = .0036). However, comparison of the mean CBV and MTT revealed that these mean quantitative values in the ischemia/infarct region were the same among the 5 observers. Further analysis of the mean CBF values with pairwise comparison of the observers using Bonferroni correction showed significant differences between the junior CT technologist and the neuroradiology attending physician and radiology resident physician, separately. Pearson correlation coefficients were also performed using all possible pairings with the observers, ranging from r = 0.74–0.95. Stronger positive associations (r = 0.95; P < 0.05) were seen with the pairing of the neuroradiology attending physician and radiology resident physician. Weaker associations (r = 0.74–0.75; P < 0.05) were seen with the pairings of the junior CT technologist with the neuroradiology attending physician and radiology resident physician, separately. These findings may be explained by the similar training backgrounds and skill set of the neuroradiology attending physician and radiology resident physician in being able to identify the most severely hypoperfused region. However, the junior CT technologist differed most with these observers, possibly a reflection of the lack of training, experience, and confidence in evaluating imaging studies for pathologic conditions.
Quantitative assessment of ischemia/infarct (mean quantitative values)
Coefficient of variation (%) among all observers (interobserver variability)
Quantitative Assessment of Global Cortical Perfusion
All 20 CTP datasets had 10 ROIs placed in both cerebral hemispheres to assess global cortical perfusion. The 6 observers placed ROIs of standard size and shape in the cerebral hemispheres to sample the anterior, middle, and posterior cerebral arterial territories using a systematic approach. The mean quantitative CBF, CBV, and MTT for the 10 ROIs sampling the cortical region of all arterial territories was calculated using all patients for each observer (Table 5). The coefficients of variation among all observers for the mean CBF, CBV, and MTT were 11.88%, 13.66%, and 3.55% (Table 4). Comparison of mean CBF and CBV for global cortical perfusion showed significant differences among all observers using one-way ANOVA (F5,113, P < .05). However, comparison of the mean MTT revealed that the mean quantitative values were the same among the 6 observers. Further analysis with pairwise comparison of the observers using Bonferroni correction showed significant differences between the neuroradiology fellow with the neuroradiology attending physician, radiology resident physician, and senior CT technologist, separately. Pearson correlation coefficients were also performed by using all possible pairings with the observers, ranging r = 0.86–0.97. Stronger positive associations (r = 0.97; P < 0.05) were seen with the pairings of the neuroradiology attending physician and radiology resident physician, as well as the junior CT technologist and senior CT technologist. The weakest associations (r = 0.86–0.94; P <0.05) were seen with the pairings of the neuroradiology fellow with the other 5 observers.
Quantitative assessment of global cortical perfusion (mean quantitative values)
Intraobserver Variability
The coefficient of variation was calculated for the 6 observers, representing the measurement error introduced from each observer repeating the ROI analysis for obtaining quantitative CBF, CBV, and MTT values (Table 6). The neuroradiology attending physician and radiology resident physician had the lowest intraobserver variability. The neurology attending physician and neuroradiology fellow had the greatest variability in the quantitative values. Overall, all 6 observers had low intraobserver variability, measuring less than 9%.
Coefficient of variation (%) for each observer (intraobserver variability)
Discussion
As the clinical applications of CT perfusion imaging continue to gain widespread recognition, there will be greater demand on radiologists to postprocess CTP data before interpretation. Some clinical practices may turn to training fellows, residents, or CT technologists to postprocess CTP data and also obtain the appropriate quantitative information for interpretation by the radiologist. This raises concern regarding the variability that may exist in ROI sampling of the ischemia/infarct region or global cortical perfusion among different observers that could potentially affect the quality of the interpretation. The reproducibility of CT perfusion data within individual observers has been studied, demonstrating little variability in the quantitative CBF measurements when performed on 2 separate occasions within a 24-hour period.4
Prior studies have shown that there is a high degree of correlation for CBF, CBV, and MTT maps postprocessed by different CT technologists; however, the level of agreement may be insufficient to incorporate quantitative values into clinical decision making.5 The quantitative differences were not infrequently manifested as significant differences in the qualitative appearance of the CBF maps,5 thereby raising concern for its widespread use. Our previous work has been focused on establishing the reproducibility of postprocessing CTP datasets between experienced and inexperienced radiologists, as well as between radiologists and technologists.1 We have shown that the quantitative CBF, CBV, and MTT data obtained from postprocessing CTP datasets are reproducible among observers with various levels of skill and experience when using a uniform and standard postprocessing technique to select the user-defined parameters.1 After a brief training session, postprocessing CTP datasets can reliably be performed by radiologists, neurologists, resident physicians, and CT technologists.1 This study was designed as a sequel to evaluate the variability among different observers in obtaining both qualitative and quantitative CTP data. Different observers with various levels of skill and experience were selected to represent the potential medical staff that may be responsible for postprocessing CTP data at different institutions, including radiologists, neurologists, fellows, resident physicians, and CT technologists.
In the qualitative assessment of a right- or left-sided perfusion abnormality or symmetric perfusion, there are good to excellent agreement rates among all observers, with κ statistics ranging from 0.55 to 1.0. Lower agreement rates were seen with the neurology attending physician, possibly reflecting the nonimaging training background of this observer's specialty, leading to a different sensitivity in detecting subtle abnormalities. Quantitative analysis of the ROI sampling of the ischemia/infarct region showed a low degree of variability, ranging from 4.66 – 27.10% (Table 4), in the quantitative values of CBF, CBV, and MTT generated from the different observers selecting the most severely hypoperfused region in the perfusion abnormality. The greatest variability is seen in the CBF values sampling of this region, resulting in a significant statistical difference among the observers (P = .0036). However, the mean CBV and MTT values for the ischemia/infarct region were the same among the different observers. Using a clinical CBF threshold definition of 17 to 18 mL/100 g/min for the ischemia/infarct region,6–8 the neuroradiology fellow and junior CT technologist could potentially have misclassified this region with slightly higher mean CBF values of 20.87 and 25.96 mL/100 g/min, respectively. Despite this, these mean CBF values are markedly reduced and considered abnormal hypoperfused regions. In the clinical setting, interpretation of CTP data includes evaluation of MTT and CBV in conjunction with CBF values. The markedly elevated MTT values support the clinical interpretation of ischemia/infarct region for all observers. Pairwise comparison showed that a single observer, the junior CT technologist, had significant differences in mean CBF values compared with several other observers. Review of the ROI placements on the CTP maps selected by the junior CT technologist revealed that the ROIs were consistently placed on cortical regions neighboring the perfusion abnormality, not necessarily sampling the most severely hypoperfused region in the white matter. The instructions in the training session included to place a single ROI in the most severely hypoperfused region in the identified perfusion abnormality, regardless of its location in the cortex or white matter. These differences in the ROI placements made by the junior CT technologist can be easily recognized during interpretation of the CTP data, thereby allowing for adjustments to be made for further clarification of the ischemia/infarct region. Additional training and practice with this individual observer might result in more accurate ROI sampling. Clear and descriptive instructions are valuable in maintaining a standard technique for obtaining quantitative data from CTP maps.
In the quantitative assessment of global cortical perfusion, there was a low degree of variability in the CBF, CBV, and MTT values, ranging from 3.55 to 13.66% (Table 4), among the 6 observers placing 10 ROIs on the cerebral hemispheres. The greatest variability is seen in the CBV values. However, there were significant statistical differences in the CBF and CBV values among the observers (P < .05). Pairwise comparison showed that a single observer, the neuroradiology fellow, had significant differences in mean CBF and CBV values compared with several other observers. However, these quantitative differences did not manifest as clinically significant differences because the CBF and CBV values are in the normal range for global cortical perfusion. Review of ROI placements on the CTP maps selected by the neuroradiology fellow showed that several CTP datasets had occasional ROIs that partially included regions of white matter, skull, and artifact. The instructions in the training session included to place the 10 ROIs on the cortex without including white matter and avoiding the skull, CSF, and artifact from surgical clips. Attentive and meticulous placement of the ROIs is important in obtaining reproducible quantitative CTP data.
The variability that exists as a result of different observers obtaining qualitative and quantitative CTP data is due in part to the observers’ knowledge and understanding of postprocessing CT perfusion. In our study, all observers were trained by a single neuroradiologist to use a standard technique in obtaining CTP data. This training session was performed in an attempt to achieve uniform knowledge and understanding in qualitatively identifying abnormal perfusion regions, as well as quantitatively sampling ischemia/infarct region and global cortical perfusion. Clear and descriptive instructions are valuable to standardize ROI placement for obtaining quantitative CTP data. Attentive and meticulous ROI placement for global cortical sampling is needed to avoid volume averaging with white matter, CSF, skull, or artifact. Establishing a uniform and standard method for obtaining quantitative CTP data through ROI sampling is important for maintaining reliability.
The limitations of the study include that the postprocessing of all CTP datasets were performed using a single commercially available software program that employs a deconvolution method to generate the quantitative CTP maps. It is possible that other software programs yield different degrees of variability. Future studies can be performed to determine the reliability for obtaining quantitative CTP data by using software programs that use a different mathematical method.
Conclusion
Although some variability exists in obtaining qualitative and quantitative CTP data among different observers, there is potential for maintaining good interobserver reliability by using a uniform and standard technique. A brief training session with clear and descriptive instructions is valuable to provide observers with uniform knowledge and understanding. Using attentive and meticulous technique in ROI placement is important for maintaining reproducibility of quantitative CTP data. Overall, the quantitative differences seen in this study among the different observers would not necessarily affect the quality of interpretation of the ischemia/infarct region or global cortical perfusion in the clinical setting. Therefore, obtaining qualitative and quantitative CTP data can reliably be performed in the clinical setting by radiologists, neurologists, fellows, resident physicians, and CT technologists. However, close inspection of the ROI placements is advised to ensure accurate sampling of the ischemia/infarct region and global cortical perfusion as well as to sustain a uniform and standard technique. Identification of observers performing systematic errors can be addressed with additional individual training and practice.
Footnotes
This investigation was supported (in part) by a GE-AUR Research Award.
References
- Received September 23, 2005.
- Accepted after revision June 29, 2006.
- Copyright © American Society of Neuroradiology


