
Abstract
BACKGROUND AND PURPOSE: Most previous neuroimaging studies of attention-deficit/hyperactivity disorder (ADHD) rely on the manual delineation of the region of interest, which is subjective and lacks reproducibility. The purpose of this study was to use an automated method to assess whether there are abnormalities in the brains of patients with ADHD. In view of findings from previous imaging and neuropsychologic studies, we predicted that we would detect abnormalities in many brain regions of patients with ADHD.
MATERIALS AND METHODS: Twelve boys with ADHD and 12 control subjects underwent MR imaging assessments. Statistically significant changes in regional volume were analyzed by using deformation based morphometry (DBM). This technique derived a voxel-wise estimation of regional tissue volume change from the deformation field required to warp subject to the template image. Morphologic differences between groups were estimated at each voxel, applying a threshold (P < .001) to the resulting voxel statistic maps to generate clusters of spatially contiguous suprathreshold voxels,
RESULTS: The statistical results reveal some pronounced volume alterations in the brains of ADHD. Volume reductions are mainly localized in right prefrontal (Talairach 48, 20, 31), right medial temporal (Talairach 59, −52, 13), left parietal lobe (Talairach −32, −61, 41), and right basal ganglia (especially right putamen) (Talairach 21, 1, 11); the regions of volume enlargement in the brains of ADHD are observed in the right occipital lobe (Talairach 20, −86, 29) and in the left posterior lateral ventricle (Talairach −23, −40, 15).
CONCLUSION: Our findings confirm that there are widespread abnormalities in volume of boys with ADHD.
Attention-deficit/hyperactivity disorder (ADHD) is thought to affect 3%–5% of all school-aged children in the United States.1 A large amount of research has been devoted to this disorder, and great progress has been made. Several MR neuroimaging studies have reported smaller anatomic volumes in children with ADHD in regions of the right frontal hemisphere2–6 and temporal and basal ganglia.5,6 However, most previous volumetric analysis methods rely on the manual delineation of regions of interest, which is subjective and lacks reproducibility.7
As a useful tool for the examination of brain morphology from MR imaging, the deformation-based morphometry (DBM) method provides an unbiased automated analysis of the whole brain with high regional sensitivity.7,8 Here, we have sought to address the above concerns in boys with ADHD through the application of DBM on the whole brain, which quantified local volumetric differences between groups. We first undertook a high-dimension registration algorithm that is able to provide highly accurate and reasonable anatomic correspondences between very different subjects. After registration, Jacobian value (a measure of regional tissue volume change) was extracted from the deformation fields. Morphologic differences between groups were estimated at each voxel in standard space, applying a threshold (P < .001) to the resulting voxel statistic maps to generate clusters of spatially contiguous suprathreshold voxels.
The purpose of this study was to assess, using DBM, whether there are abnormalities in brains of patients with ADHD. In view of findings from previous imaging and neuropsychologic studies, we predicted that we would detect abnormalities in many brain regions of patients with ADHD.
Materials and Methods
Subjects
We selected boys with ADHD from a larger group who met DSM-IV (Diagnostic and Statistical Manual of Mental Disorders, 4th ed) diagnostic criteria for the disorder and had adequate brain imaging data for these analyses. A child neurologist confirmed the diagnosis using a structured diagnostic interview. We excluded patients with movement disorders or with IQ below 80 or above 130. Patients with a history of substance abuse, recurrent depressive disorder, schizophrenia, or any other neurologic condition were also excluded.
Children included as control subjects were deemed free of ADHD if they did not meet criteria on all rating scales/questionnaires administered. We excluded control subjects from participation if they had a history of concussion, seizure disorder, or developmental delay based on the outcome of a structured diagnostic interview.
In total, 12 children with ADHD and 12 control subjects were used in this study. Sex-based differences in structural MR imaging findings9 and brain activity10 have been reported in ADHD. We therefore chose to reduce variance by limiting the study to boys who were right-handed. The mean age of the ADHD children was 13.4 years (SD 0.9 years), and that of the healthy children was 13.5 years (SD 0.4 years). The mean IQ scores for patients and for control subjects were 103 (SD 18) and 114 (SD 13), respectively. Although there was a trend, the IQ for the ADHD subjects and the control groups did not differ significantly (P = .07).
The study was approved by the local IRB committee. Written informed consent by the parents was obtained before the experimental investigation, and interviews were fully explained to the parents and children.
MR Imaging Acquisition
All subjects were scanned on a 3T scanner (Siemens, Erlangen, Germany) with a receive-only whole head coil for signal intensity amplification in the Beijing Magnetic Resonance Center. A series of T1-weighted 3D structural images (spoiled gradient-recalled echo in a steady state; TR, 1700 ms; TE, 3.92 ms; flip angle, 12; FOV, 256 × 256; section thickness, 1.0 mm) were acquired.
MR Imaging Data Analysis
The first step in data analysis was image preprocessing. The skull, scalp, and other extracranial tissues were removed from each subject using an automated skull-stripping procedure (brain extraction tool).11 In most cases, the software performed perfectly and extracted the brain without error. In several cases, however, additional manual editing was required to remove retained extracranial tissue. Then every image volume was normalized to the template by an affine transformation with 12 parameters,12 which reduced the variability attributable position, orientation, and size of the anatomy.
The second step in analysis was nonrigid registration, which captures the deformation field that maps each point in the anatomy of the template to the corresponding point in the anatomy of the subject. However, we found that the general free-form volume registration model13 has some disadvantages. Because the transformation is modeled with a linear combination of cubic B-splines placed on a regular grid, it strictly limits the parametric solid to a regular parallelepiped with uniform division. This reduced the flexibility of the method and thus increased computation time. Hellier et al14 demonstrated that the quality of the registration is directly related to the transformation's degrees of freedom. To get more flexibility and accuracy, we introduced nonuniform rational B-splines (NURBS) to nonrigid registration, because NURBS has strict local support, like B-spline, and the knot vectors and control points are no longer constrained to a regular initial spacing. It also provides the weight, which can be seen as the fourth component of the control point. NURBS is integrated into free-form deformation, and the hyperpatch can be expressed as:  1) where Bi,l(u) ⊓ Bj,m (v) and Bx,n (w) represent the lth, mth, and nth B spline basis functions, respectively. Here we used cubic B spline, which can be calculated by deBoor-Cox iteration. p, q, r is the number of divisions through 3 orthogonal directions within the control lattices. Each control point Pi,j,k has an associated number called weight Wi,,j,,k. Between moving control points and adjusting their weights, NURBS provide a much more flexible tool than uniform B-splines.
As a result of registration, we obtained deformation fields for each subject that defined the transformations required to map the voxel (x, y, z) of the template onto its corresponding position in (x + ux (x, y, z), y + uy (x, y, z), z + uz (x, y, z)) of the subject. The deformation fields were smoothed with a Gaussian kernel with full width at half maximum of 8 mm to improve delineation of patterns of shape difference.
Here, we have chosen to focus our attention on local volume differences between 2 groups. The Jacobian value for any given location in the reference coordinate system provided an estimate of the point-wise volume change of that individual, which has been examined previously by some studies.15 The Jacobian value, j (x, y, z), is defined point-wise as:  2) j (x, y, z) describes the point-wise volume change induced by the transformation. Values above 1 indicate tissue expansion, values below 1 indicate tissue contraction, values below 0 indicate folding, and infinite values indicate tearing.
The third step in data analysis was statistical analysis. After the image processing steps were done for every patient and control, we created statistical maps of differences between groups. Because the Jacobian value for each subject is derived with respect to the same template, all subject brains may be compared with each other, voxel by voxel, regardless of their shapes. This property allows us to calculate point-wise statistics and create statistical parametric maps. Here, we perform a means test between the 2 groups under the null hypothesis that the means are equal and with the assumption that the variances of j (x, y, z) within the 2 groups are equal. For each pixel, we calculate a t score.  3)
3)  4) Here, J̄xC and J̄xA are the mean Jacobians for control and patient at the voxel x, respectively. σC and σA are the standard deviations of J (x) for control and patient. Nc and NA are the number of subjects in the control group and patient group. The t score is bidirectional, meaning that positive values signify larger mean Jacobian in the control group, whereas negative values suggest the opposite. Voxels that had a t value greater than 3.51 (P < .001) and were part of a spatially contiguous cluster size of 100 voxels or greater were considered to be significantly different between groups.
Results
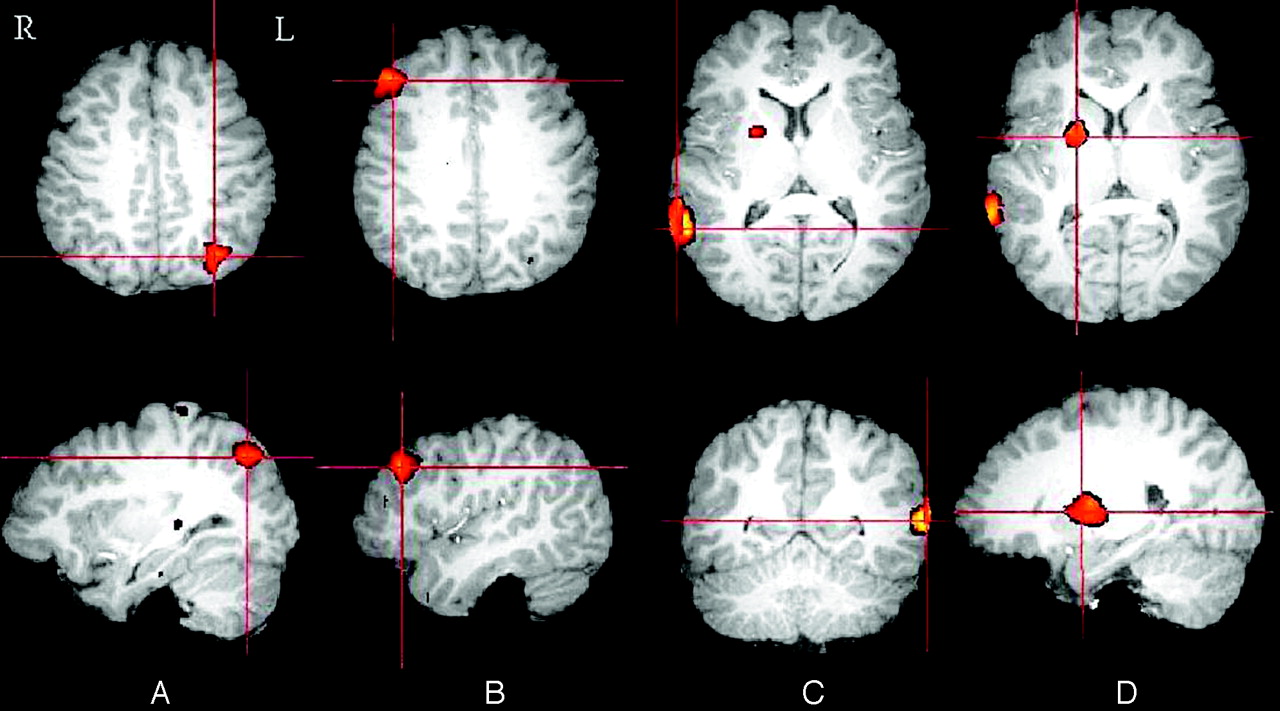
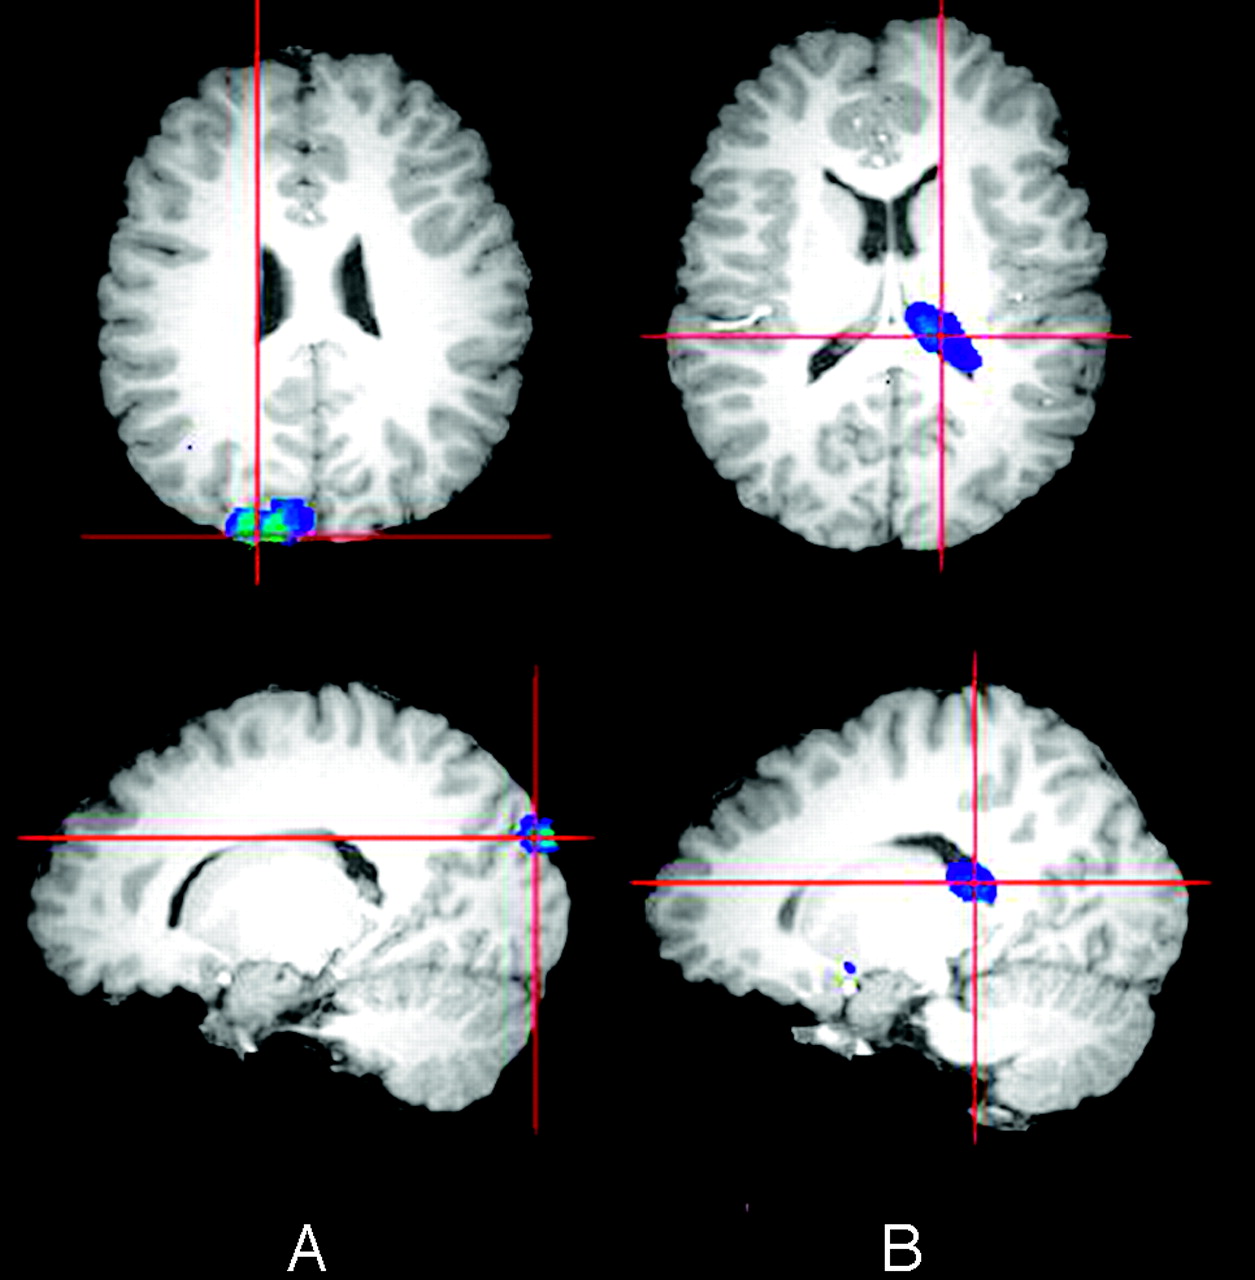
The Table lists all regions of localized clusters with significant group differences. To aid in viewability, the resulting p maps with statistically significant group differences were divided into 2 figures, one showing the differences caused by volume reduction in brains of patients with ADHD (Fig 1) and another showing the opposite (Fig 2). The statistical results are superimposed on the template image. Statistical comparison between the 2 groups reveals some pronounced and fairly localized group differences. In particular, volume reductions are mainly localized in right prefrontal (Talairach 48, 20, 31), right medial temporal (Talairach 59, −52, 13), left parietal lobe (Talairach −32, −61, 41), and right basal ganglia (especially right putamen) (Talairach 21, 1, 11); the regions of volume enlargement in the brains of ADHD patients are observed in the right occipital lobe (Talairach 20, −86, 29) and in the left posterior lateral ventricle (Talairach −23, −40, 15).

Visual summary of the statistical map in which the local volumetric reduction presented statistically significant differences between boys with and without ADHD: left parietal lobe (A), right prefrontal lobe (B), right medial temporal lobe (C), right basal ganglia (especially right putamen) (D).

Visual summary of the statistical map in which the local volumetric enlargement presented statistically significant differences between boys with and without ADHD: right occipital lobe (A), left posterior lateral ventricle (B).
Summary of the clusters with significant group differences, obtained by voxel-wise statistical analysis of the Jacobian maps of ADHD brains and healthy control brains
Discussion
We have applied an automated computational image analytic technique for regional morphometric analysis on boys with ADHD and control subjects who were group-matched by age and handedness. The statistical results reveal some pronounced volume alterations in the brains of patients with ADHD.
Findings of reduced size in the right prefrontal lobe were predicted by some MR imaging studies.3,5,6 Consistent with these previous studies, we found that, compared with age-matched control subjects, boys with ADHD had smaller right prefrontal lobe volumes. For instance, our finding of reductions in prefrontal cortexes is generally consistent with that of Filipek et al,3 who reported reduced volume of the right anterior-superior (frontal) region in boys with ADHD. Our results also accord with those of functional MR imaging (fMRI) studies showing activation abnormalities in the frontal lobe in boys with ADHD during tasks that need response inhibition.16,17 The specificity of prefrontal alteration is consistent with neuropsychologic studies that have identified ADHD-related deficits in executive function.18
Smaller basal ganglia volumes were also reported by previous MR imaging studies,5,19 showing abnormalities of the caudate, including a significantly smaller size on right side. Our findings are consistent with these studies. The caudate, putamen, and globus pallidus (ie, the pallidum) are part of a number of discrete, somatotopically distributed circuits essential for executive functions. It is well known that the frontal cortex interact closely with the basal ganglia as part of a series of feedback loops, to regulate a broad spectrum of functions from executive to motor to affective.20 Heilman et al21 proposed that the pathophysiology of ADHD derives from right-sided frontal-striatal dysfunction in combination with an impairment of the mesocortical dopamine system. Furthermore, Durston et al22 have shown that during a task taxing cognitive control, children with ADHD do not engage frontostriatal systems to the same degree as normally developing children. This different pattern of activation may represent compensatory mechanisms, in response to aberrant or delayed development of ventral frontostriatal circuitry associated with poor cognitive control in this disorder.
In our study, the most significant result was observed in the right medial temporal lobe. The decreased volume of temporal lobe is to some extent consistent with results of the largest existing imaging study of children with ADHD,2 which found temporal lobe gray matter was the most significantly reduced of all gray-matter regions studied. The temporal regions are thought to subserve the binding of low-level encoding visual stimuli from primary visual and early visual association cortices into unitary, higher visual percepts.23 Zametkin et al24 used positron-emission tomography (PET) and fluorine-18 fluorodeoxyglucose to study cerebral glucose metabolism in children with ADHD as they performed an auditory-attention task. Glucose utilization was reported decreased in right (but not left) temporal regions of boys (but not girls). Another study also found abnormal metabolism in this region.16
Furthermore, we found reduced volume in the left parietal lobes. Decreased volume of parietal cortices was reported by Castellanos et al.2 The parietal regions have been shown repeatedly to participate in processes that need sustained visual attention.25 Seitz et al26 studied the cerebral areas activated during kinematic processing of movement trajectories and concluded that the parietal region may subserve attentive sensory movement control and whole-field visuospatial processing during automatic performance. In the PET study of children with ADHD, Zametkin et al24 found glucose utilization decreased on the left side only in boys.
Interference suppression in children with ADHD was characterized by reduced engagement of a frontal-striatal-temporal-parietal network that subserved healthy performance.27 The present analysis yielded findings consistent with this fMRI study. Here we have shown that all of these anatomically interconnected areas demonstrate significant reduced volume in boys with ADHD. It is well known that role of the prefrontal cortex concerns the realm of “executive” functioning, namely the intimately associated processes involved in decision making, attentional control, response inhibition, and working memory. The parietal and temporal regions are polymodal sensory convergence areas that provide a representation of extrapersonal space. They play an important role in focusing on and selecting a target stimulus. The prefrontal, temporal, and parietal cortices are heteromodal association cortices in which information from lower order sensory systems is integrated into higher order percepts and functions. These regions together are thought to form a broadly distributed action-attentional system that supports the maintenance of attentional focus and successful inhibitory control of unwanted impulses, which suggests that this action-attentional network is anatomically disrupted in children with ADHD.
One region of volume enlargement in the brain of ADHD patients was located in the right occipital lobe. It is to some extent consistent with the results of a study by Sowell et al,6 in which increases in gray matter attenuation were significant in the right occipital lobe. The occipital regions are areas associated with visual processing. Activation of the occipital cortex supports its supplementary role in attention but could also be related to an increasing difficulty in maintaining visual focus on the screen in severely hyperactive children.28 In a single-photon emission CT study by Lou et al,29 increased perfusion of the occipital lobes of subjects with ADHD (at rest) was consistently observed. Zametkin et al24 also reported glucose utilization in the occipital lobes increased in ADHD boys but not in ADHD girls.
Expansion in the left lateral posterior ventricle was also recorded in our study. One study30 reported that posterior but not anterior lateral ventricle volume was increased in children with ADHD. Bergstrom and Bille31 showed dilation of the left lateral ventricle and fissure of Sylvius. A study reported that patients with anorexia nervosa showed enlarged CSF spaces.32 Ventricular enlargement may be associated with a poorer outcome and increased cognitive and negative symptoms. The relationship between psychiatric symptoms and neuropsychologic functioning and the presence of ventricular enlargement will need to be investigated in future studies of patients with ADHD.
Because DBM is relatively novel, it is important to consider the validity of this new method. A problem associated with DBM is preventing registration from producing transformations that are physically incorrect. Rueckert et al13 used a method to optimize the similarity measure while regularizing the displacement fields by minimizing its second derivative. Although this technique can reduce folding artifacts, it cannot guarantee the positive definiteness of the Jacobian of the transformation. Rohde et al33 studied relation of the deformation field and topology, and derived bounds for coefficients of the basis functions. Here, we used Rohde's rule to regularize transformations that are topologically correct.
Another issue with DBM is the choice or construction of the reference space to which all subjects in the group are registered. Boardman et al34 reported that the results obtained using DBM are largely independent of the choice of the reference space. Davatzikos et al15 also showed that analysis of deformation filed was robust to the particular reference used. We therefore have chosen to use a single-subject reference MR imaging (a 15-year-old healthy subject with a median ventricle size and relatively regular shape) as opposed to an averaged and blurred one.
The DBM is unbiased and objective and is thus potentially reproducible by different operators. However, there are several limitations to this study. First, the study is limited by its small sample size, though we included only stringently screened participants (for example, right-handed boys with narrow age ranges), and the findings require replication in a larger series of subjects. Second, a possible limitation of voxel-wise analysis is the problem of multiple comparisons and the increased risk of a type I error. To limit this problem, we used a conservative cluster size to examine differences between patients and control subjects of more than 100 voxels at a statistical threshold of P < .001, similar to what has been reported in another study.35 Finally, we didn’t address issues of subtyping because of the relatively small sample, though this disorder is almost certainly one of heterogeneous causes that have correspondingly heterogeneous neuroanatomic underpinnings.
Conclusions
In this article we used high-resolution MR imaging and DBM to studying the shape of brain structures in boys with ADHD. We confirm that there are widespread abnormalities in volume of boys with ADHD, which may help better account for the neurobiologic mechanisms involved in ADHD.
Footnotes
This work was partially supported by Natural Science Foundation of China Grants 30425004, 30570509, and 60121302, and the National Key Basic Research and Development Program (973) Grant 2003CB716100.
References
- Received April 3, 2006.
- Accepted after revision June 11, 2006.
- Copyright © American Society of Neuroradiology


