Advertisement

Main menu

  • Home
  • Content
    • Current Issue
    • Accepted Manuscripts
    • Article Preview
    • Past Issue Archive
    • AJNR Case Collection
    • Case of the Week Archive
    • Classic Case Archive
    • Case of the Month Archive
  • Special Collections
    • Spinal CSF Leak Articles (Jan 2020-June 2024)
    • 2024 AJNR Journal Awards
    • Most Impactful AJNR Articles
  • Multimedia
    • AJNR Podcast
    • AJNR Scantastics
    • Video Articles
  • For Authors
    • Submit a Manuscript
    • Author Policies
    • Fast publishing of Accepted Manuscripts
    • Graphical Abstract Preparation
    • Manuscript Submission Guidelines
    • Imaging Protocol Submission
    • Submit a Case for the Case Collection
  • About Us
    • About AJNR
    • Editorial Board
  • More
    • Become a Reviewer/Academy of Reviewers
    • Subscribers
    • Permissions
    • Alerts
    • Feedback
    • Advertisers
    • ASNR Home
  • Other Publications
    • ajnr

User menu

  • Alerts
  • Log in

Search

  • Advanced search
American Journal of Neuroradiology

American Journal of Neuroradiology

ASHNR American Society of Functional Neuroradiology ASHNR American Society of Pediatric Neuroradiology ASSR
  • Alerts
  • Log in

Advanced Search

  • Home
  • Content
    • Current Issue
    • Accepted Manuscripts
    • Article Preview
    • Past Issue Archive
    • AJNR Case Collection
    • Case of the Week Archive
    • Classic Case Archive
    • Case of the Month Archive
  • Special Collections
    • Spinal CSF Leak Articles (Jan 2020-June 2024)
    • 2024 AJNR Journal Awards
    • Most Impactful AJNR Articles
  • Multimedia
    • AJNR Podcast
    • AJNR Scantastics
    • Video Articles
  • For Authors
    • Submit a Manuscript
    • Author Policies
    • Fast publishing of Accepted Manuscripts
    • Graphical Abstract Preparation
    • Manuscript Submission Guidelines
    • Imaging Protocol Submission
    • Submit a Case for the Case Collection
  • About Us
    • About AJNR
    • Editorial Board
  • More
    • Become a Reviewer/Academy of Reviewers
    • Subscribers
    • Permissions
    • Alerts
    • Feedback
    • Advertisers
    • ASNR Home
  • Follow AJNR on Twitter
  • Visit AJNR on Facebook
  • Follow AJNR on Instagram
  • Join AJNR on LinkedIn
  • RSS Feeds

Welcome to the new AJNR, Updated Hall of Fame, and more. Read the full announcements.


AJNR is seeking candidates for the position of Associate Section Editor, AJNR Case Collection. Read the full announcement.


Research ArticleBRAIN

Serial Changes in CT Cerebral Blood Volume and Flow after 4 Hours of Middle Cerebral Occlusion in an Animal Model of Embolic Cerebral Ischemia

B.D. Murphy, X. Chen and T.-Y. Lee
American Journal of Neuroradiology April 2007, 28 (4) 743-749;
B.D. Murphy
  • Find this author on Google Scholar
  • Find this author on PubMed
  • Search for this author on this site
X. Chen
  • Find this author on Google Scholar
  • Find this author on PubMed
  • Search for this author on this site
T.-Y. Lee
  • Find this author on Google Scholar
  • Find this author on PubMed
  • Search for this author on this site
  • Article
  • Figures & Data
  • Info & Metrics
  • Responses
  • References
  • PDF
Loading

Article Figures & Data

Figures

  • Tables
  • Fig 1.
    • Download figure
    • Open in new tab
    • Download powerpoint
    Fig 1.

    Time attenuation curves from CT perfusion study of a rabbit showing enhancement (above baseline value) of various regions over the 99 sequential images acquired. Arterial and venous time-attenuation curves (A) and tissue time-attenuation curves (B) for 9-mm2 regions of interest in the ischemic hemisphere and contralateral hemisphere.

  • Fig 2.
    • Download figure
    • Open in new tab
    • Download powerpoint
    Fig 2.

    Serial CBF and CBV images from select time points (minutes poststroke on left) for 2 contiguous CT perfusion sections from 1 animal. Corresponding TTC staining shows infarcted tissue (white) corresponding to areas of decreased CBF and CBV, whereas viable tissue is stained red. CBF and CBV images are colored according to a “rainbow” color scale with red and blue representing high and low values, respectively: CBF, 0–150 mL · 100 g−1 · min−1; CBV, 0–10 mL · 100 g−1.

  • Fig 3.
    • Download figure
    • Open in new tab
    • Download powerpoint
    Fig 3.

    Average values of CBF (A) and CBV (B) in infarcted (n = 32) and oligemic (n = 45) regions of interest at different times after embolization; error bars show SD. For comparison, CBF and CBV of contralateral tissue are also shown (error bars not shown for clarity).

    A, CBF is significantly lower than baseline at every time point after embolization in both oligemic and infarct regions. Contralateral CBF is not significantly different from baseline at any time point.

    B, CBV in infarcted regions is significantly lower (P < .05) than baseline at 60 minutes after embolization and at every subsequent time point (*). CBV for oligemic regions was significantly higher than baseline values at 30, 90, 120, 150, and 180 minutes after embolization (#). No significant differences in CBV between oligemic and contralateral regions were found at any time point.

  • Fig 4.
    • Download figure
    • Open in new tab
    • Download powerpoint
    Fig 4.

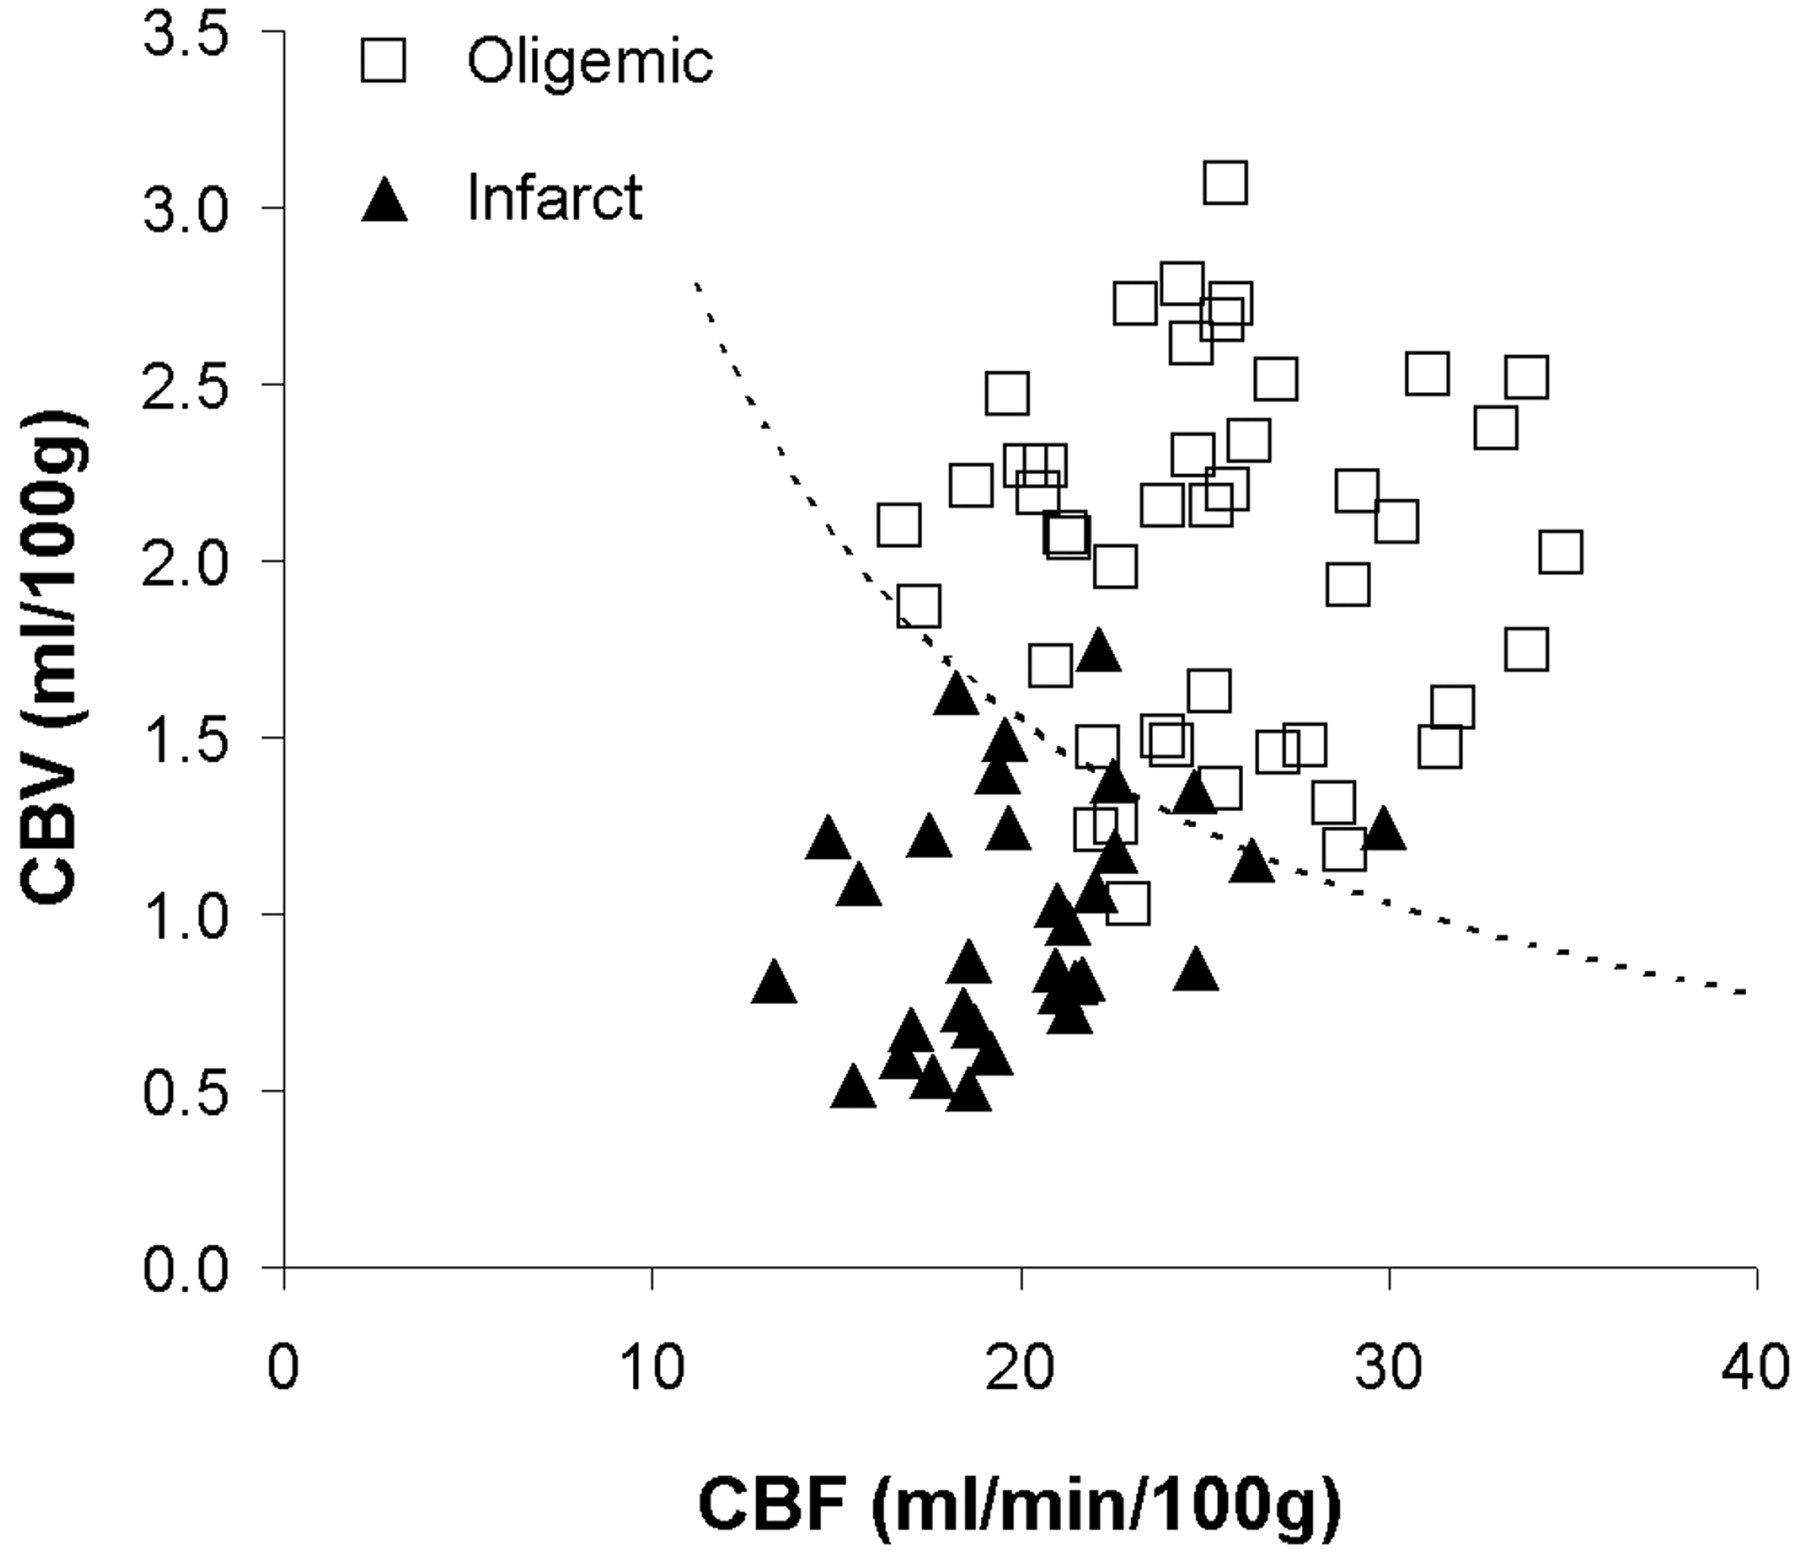
    Scatter plot of cerebral blood volume (CBV) versus cerebral blood flow (CBF) in oligemic and infracted tissue. Dashed line, CBF×CBV = 31.1, defines the threshold of infarction for the CBF×CBV model. Data points above the line are classified as oligemic, and points below the line are classified as infarct. When the predicted group membership is compared with the true group membership (defined on the TTC-stained tissue sections), the specificity and sensitivity of the model for infarction are 93.3% and 90.6%, respectively.

  • Fig 5.
    • Download figure
    • Open in new tab
    • Download powerpoint
    Fig 5.

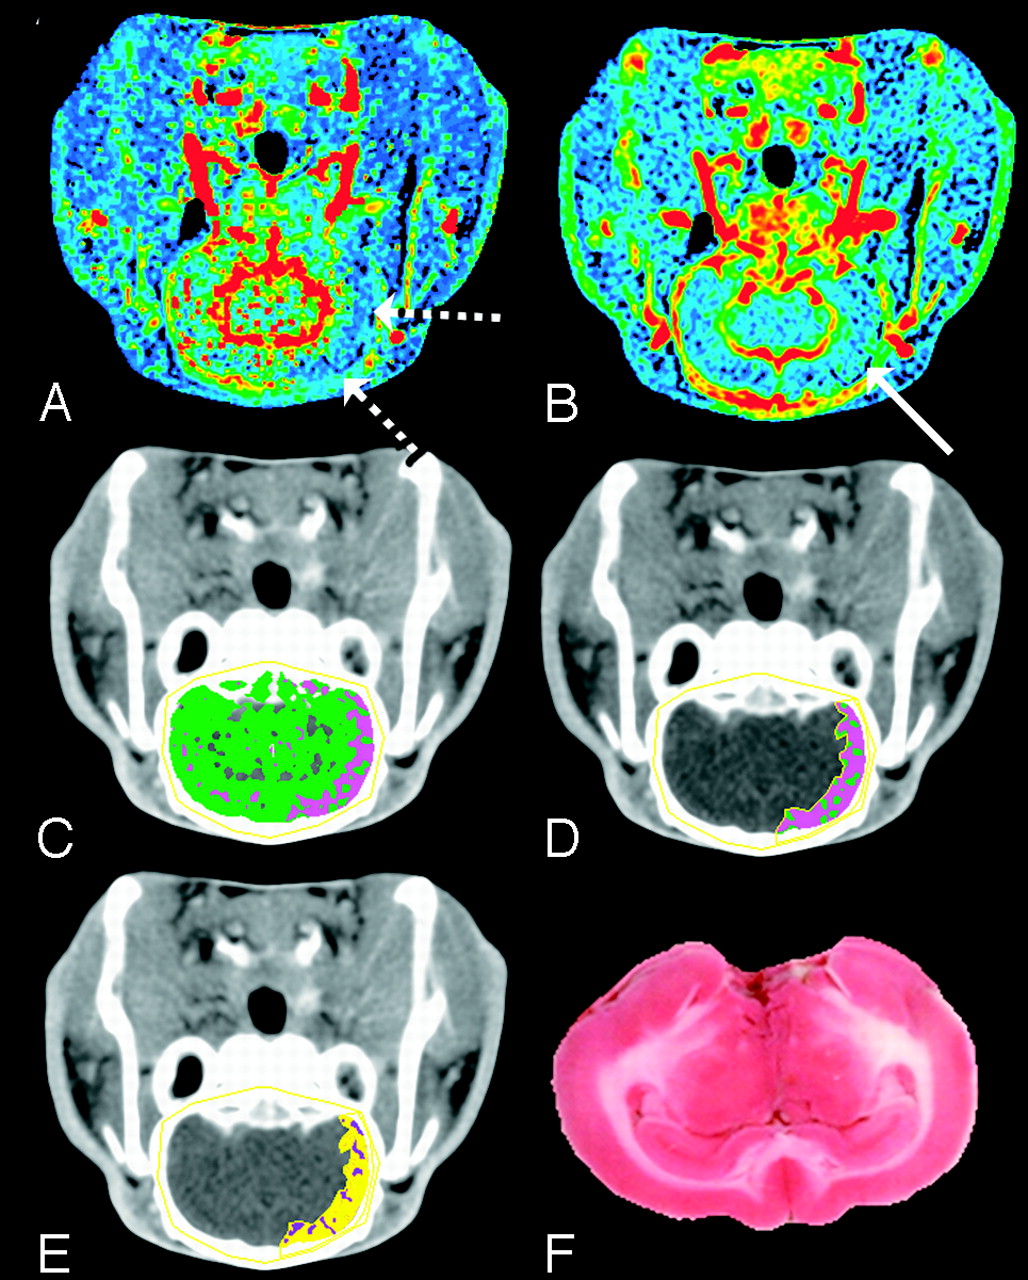
    Mismatch between CBF and CBV at 4 hours after embolization. The CBF and CBV maps display the corresponding functional values according to a “rainbow” color scale with red and blue representing high and low values, respectively (CBF, 0–150 mL · 100 g−1 · min−1; CBV, 0–10 mL · 100 g−1). CBF map (A) shows ischemic areas (dashed arrows) and CBV map (B) shows normal to increased blood volume in ischemic area (solid arrow) relative to contralateral hemisphere.

    C, Brain tissue segmented from skull in the nonenhanced CT image by a CT number threshold of 340 HU and further classified according to CBF: 0 < pink pixels ≤ 25 > green pixels < 100 mL · 100 g−1 · min−1.

    D, A manually drawn region of interest around the ischemic area.

    E, The ischemic region shown in D classified according to the logistic regression model (purple pixels = infarct; yellow pixels = oligemic). Most of the ischemic region in D is classified as penumbra, which agrees with the TTC-stained section (F).

  • Fig 6.
    • Download figure
    • Open in new tab
    • Download powerpoint
    Fig 6.

    Matched decrease in CBF and CBV at 4 hours after embolization. The CBF and CBV maps display the corresponding functional values according to a “rainbow” color scale with red and blue representing high and low values, respectively (CBF, 0–150 mL · 100 g−1 · min−1; CBV, 0–10 mL · 100 g−1). CBF map (A) shows ischemic areas (dashed arrows) and CBV map (B) shows decreased blood volume in ischemic area (solid arrow) relative to contralateral hemisphere (C) brain tissue segmented from skull in the nonenhanced CT image by a CT number threshold of 340 HU and further classified according to CBF: 0 < pink pixels ≤ 25 > green pixels < 100 mL · 100 g−1 · min−1.

    D, A manually drawn region of interest around the ischemic area.

    E, The ischemic region shown in D classified according to the logistic regression model (purple pixels = infarct; yellow pixels = oligemic).

    F, The corresponding TTC-stained tissue section shows an area of infarction that corresponds with pixels classified as infarct in E.

  • Fig 7.
    • Download figure
    • Open in new tab
    • Download powerpoint
    Fig 7.

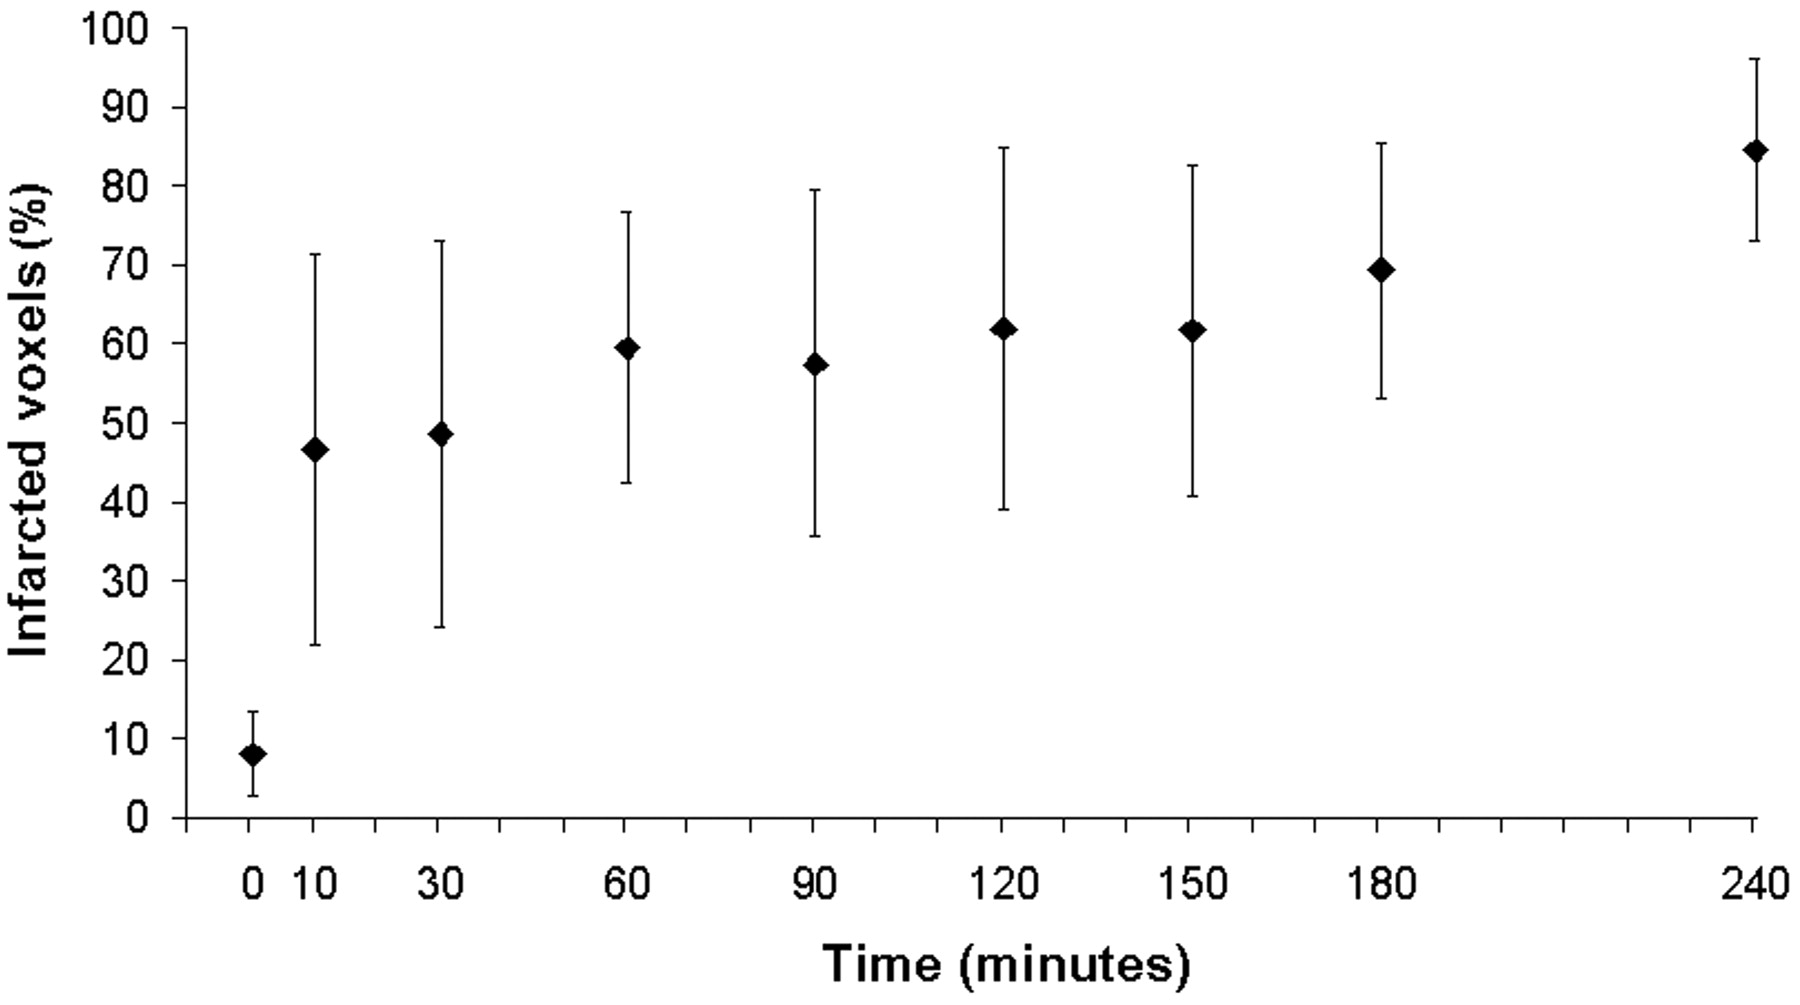
    Total volume of tissue classified as infarct by the CBF×CBV model with a threshold of CBF×CBV = 31.1 at multiple time points in the study and expressed as a percentage of final infarct volume on TTC-stained sections. Error bars show SD of the mean for each time point. Thresholds for infarction are probably time-dependent and are expected to increase with time from baseline. The assumed threshold at 4 hours after embolization applied at earlier time points is expected to overestimate the fraction of voxels destined to infarction. However, the extent of this overestimation at early time points was not investigated in this study.

Tables

  • Figures
  • Logistic regression classification using CBF, CBV, or CBF×CBV

    ThresholdSensitivitySpecificityAccuracy
    CBF (ml · 100 g−1 · min−1)21.4.688.778.740
    CBV (ml · 100 g−1)1.36.844.867.857
    CBF×CBV31.1.906.933.922
PreviousNext
Back to top

In this issue

American Journal of Neuroradiology: 28 (4)
American Journal of Neuroradiology
Vol. 28, Issue 4
April 2007
  • Table of Contents
  • Index by author
Advertisement
Print
Download PDF
Email Article

Thank you for your interest in spreading the word on American Journal of Neuroradiology.

NOTE: We only request your email address so that the person you are recommending the page to knows that you wanted them to see it, and that it is not junk mail. We do not capture any email address.

Enter multiple addresses on separate lines or separate them with commas.
Serial Changes in CT Cerebral Blood Volume and Flow after 4 Hours of Middle Cerebral Occlusion in an Animal Model of Embolic Cerebral Ischemia
(Your Name) has sent you a message from American Journal of Neuroradiology
(Your Name) thought you would like to see the American Journal of Neuroradiology web site.
CAPTCHA
This question is for testing whether or not you are a human visitor and to prevent automated spam submissions.
Cite this article
B.D. Murphy, X. Chen, T.-Y. Lee
Serial Changes in CT Cerebral Blood Volume and Flow after 4 Hours of Middle Cerebral Occlusion in an Animal Model of Embolic Cerebral Ischemia
American Journal of Neuroradiology Apr 2007, 28 (4) 743-749;

Citation Manager Formats

  • BibTeX
  • Bookends
  • EasyBib
  • EndNote (tagged)
  • EndNote 8 (xml)
  • Medlars
  • Mendeley
  • Papers
  • RefWorks Tagged
  • Ref Manager
  • RIS
  • Zotero
0 Responses
Respond to this article
Share
Bookmark this article
Serial Changes in CT Cerebral Blood Volume and Flow after 4 Hours of Middle Cerebral Occlusion in an Animal Model of Embolic Cerebral Ischemia
B.D. Murphy, X. Chen, T.-Y. Lee
American Journal of Neuroradiology Apr 2007, 28 (4) 743-749;
del.icio.us logo Twitter logo Facebook logo Mendeley logo
  • Tweet Widget
  • Facebook Like
  • Google Plus One

Jump to section

  • Article
    • Abstract
    • Materials and Methods
    • Results
    • Discussion
    • Conclusion
    • Acknowledgments
    • Footnotes
    • References
  • Figures & Data
  • Info & Metrics
  • Responses
  • References
  • PDF

Related Articles

  • No related articles found.
  • PubMed
  • Google Scholar

Cited By...

  • Pre-intervention cerebral blood volume predicts outcomes in patients undergoing endovascular therapy for acute ischemic stroke
  • Crossref
  • Google Scholar

This article has not yet been cited by articles in journals that are participating in Crossref Cited-by Linking.

More in this TOC Section

  • Qualitative and Quantitative Analysis of MR Imaging Findings in Patients with Middle Cerebral Artery Stroke Implanted with Mesenchymal Stem Cells
  • Multimodal CT Provides Improved Performance for Lacunar Infarct Detection
  • Statin Therapy Does Not Affect the Radiographic and Clinical Profile of Patients with TIA and Minor Stroke
Show more Brain

Similar Articles

Advertisement

Indexed Content

  • Current Issue
  • Accepted Manuscripts
  • Article Preview
  • Past Issues
  • Editorials
  • Editors Choice
  • Fellow Journal Club
  • Letters to the Editor

Cases

  • Case Collection
  • Archive - Case of the Week
  • Archive - Case of the Month
  • Archive - Classic Case

Special Collections

  • Special Collections

Resources

  • News and Updates
  • Turn around Times
  • Submit a Manuscript
  • Author Policies
  • Manuscript Submission Guidelines
  • Evidence-Based Medicine Level Guide
  • Publishing Checklists
  • Graphical Abstract Preparation
  • Imaging Protocol Submission
  • Submit a Case
  • Become a Reviewer/Academy of Reviewers
  • Get Peer Review Credit from Publons

Multimedia

  • AJNR Podcast
  • AJNR SCANtastic
  • Video Articles

About Us

  • About AJNR
  • Editorial Board
  • Not an AJNR Subscriber? Join Now
  • Alerts
  • Feedback
  • Advertise with us
  • Librarian Resources
  • Permissions
  • Terms and Conditions

American Society of Neuroradiology

  • Not an ASNR Member? Join Now

© 2025 by the American Society of Neuroradiology All rights, including for text and data mining, AI training, and similar technologies, are reserved.
Print ISSN: 0195-6108 Online ISSN: 1936-959X

Powered by HighWire