
Abstract
BACKGROUND AND PURPOSE: Small cerebral vessels are a major site for vascular pathology leading to cerebral infarction and hemorrhage. However, such small cerebral vessels are difficult to visualize by using conventional methods. The goal of our study was the development of methodology allowing visualization of small cerebral arteries in rodents, suitable for experimental models.
MATERIALS AND METHODS: Using barium sulfate as a contrast material, we obtained microangiographic images of physiologic and pathologic changes consequent to cerebral infarction in mouse brain by monochromatic synchrotron radiation (SR). To achieve high-resolution and high-contrast images, we used a new x-ray camera with a pixel size of 4.5 μm, and we set the energy level at 37.5 keV, just above the K absorption of barium.
RESULTS: Small intracerebral arteries (∼30 μm in diameter) were clearly visualized, as well as the cortical branches (50–70 μm in diameter) at the brain surface. The limit of detection appeared to be vessels ∼10 μm in diameter. Compared with the noninfarcted side, the number of intracerebral arteries was dramatically decreased in the middle cerebral artery area affected by stroke.
CONCLUSIONS: These results indicate the potential of SR for evaluating pathologic changes in small cerebral arteries and for monitoring the impact of pro- and antiangiogenic therapeutic strategies.
Cerebrovascular disease is one of the major causes of death and disability in developed countries. To evaluate cerebral vasculature, conventional angiography and MR angiography are commonly used in clinical practice. The development of these imaging methods has allowed analysis of the pathologic features of cerebrovascular lesions and has guided therapeutic strategies. However, small cerebral vessels, including those known to harbor causative lesions in cerebral infarction and hemorrhage (due to lipohyalinotic changes and/or microaneurysm formation),1 such as intracerebral arteries and perforators, are below the detection limit of conventional imaging techniques. An important step in developing therapeutic strategies effective against disease in small cerebral vessels is enhanced visualization of this vasculature, especially in experimental models.
Recently, ex vivo and in vivo microangiography using monochromatic synchrotron radiation (SR) has been suggested as a tool capable of visualizing pathophysiologic changes in small arteries. Using this system has made possible the detection of microcirculation in the dermis,2 tumors,3 and collateral microvessels in ischemic hind limbs.4 Although fluorescence microscopy has also been used to image small arteries,5–7 SR imaging has the advantage of visualizing microvessels, even after they enter the parenchyma of an organ. In contrast, fluorescence techniques do not allow adequate visualization of small arteries once a vessel is deep within brain or other parenchymal tissue. On the basis of these observations, we have developed a microangiographic system using SR and have investigated physiologic and pathologic features of rodent cerebral microvasculature.
Materials and Methods
All procedures were performed in accordance with the National Cardiovascular Center Animal Care and Use Committee.
Preparation of Contrast Medium
For high-contrast images of the microcirculation, contrast agents included microspheres (Techpolymer I-2, Sekisui Plastics, Shiga, Japan) and barium sulfate (BarytgenSol, Fushimi, Tokushima, Japan). However, because the diameter of microspheres was 15 μm, whereas that of barium sulfate particles varied from 1–100 μm, the microcirculation of cerebral arteries could not be visualized by using these contrast media (not shown). To perfuse such microvessels (diameter <10 μm), we filtered barium sulfate (pore size 5 μm; Millex-SV, Millipore, Bedford, Mass) and obtained particles <5 μm in diameter. Filtered barium sulfate particles were then centrifuged (3000 G, 60 minutes) and concentrated to 50% by weight following removal of the supernatant.
Injection of Contrast Medium
Male severe combined immunodeficient (SCID) mice (6 weeks old; weight, 25–30 g; Oriental Yeast, Tokyo, Japan) were anesthetized by using inhaled diethyl ether and were perfused systemically with phosphate-buffered saline (PBS) containing heparin (40 U/mL) via the left ventricle of the heart with a peristaltic pump (Iwaki, Asahi Techno Glass, Chiba, Japan). Filtered barium sulfate particles (<5 μm in diameter, prepared as described previously; 50% by weight) were infused (0.7 mL), followed by isolation of the brain and fixation in formalin.
Microangiography and Image Analysis
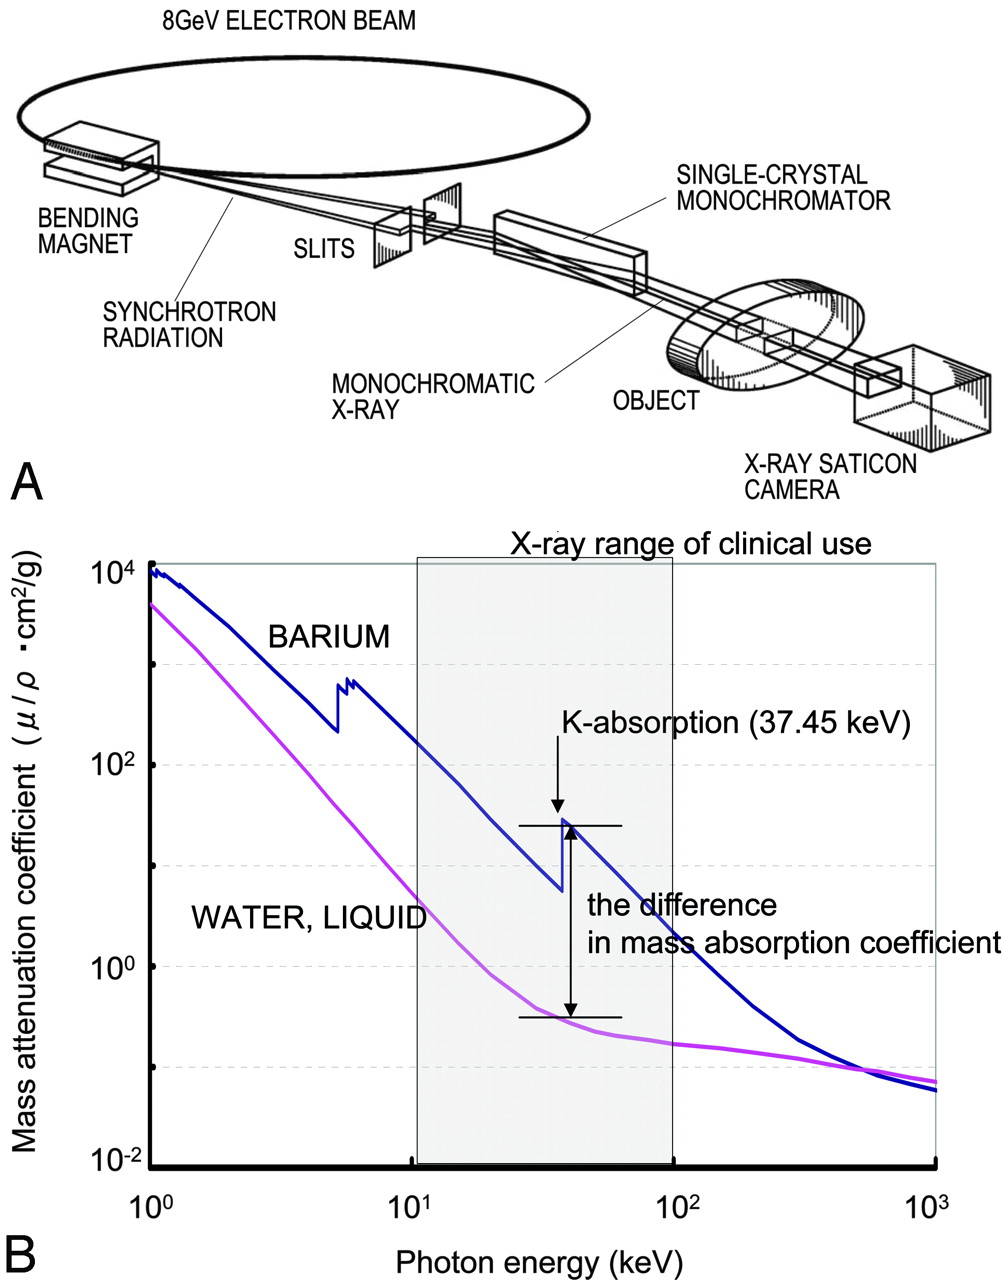
Microangiographic images of mouse brain were obtained by using monochromatic SR in the Japan Synchrotron Radiation Research Institute (SPring-8, Hyogo, Japan).4,8 There are 3 large 3rd-generation synchrotron radiation facilities in the world: the Advanced Photon Source in Argonne (United States), the European Synchrotron Radiation Facility in Grenoble (France), and SPring-8 (the latter was used for the studies described herein). These facilities are open to scientists in many fields, including material, chemical, and life sciences investigators. The experimental setup for x-ray imaging by using monochromatic SR at the SPring-8 BL28B2 beamline is shown in Fig 1A. The storage ring was operated at 8-GeV electron beam energy, and beam current was 80–100 mA. The distance between the point source in the bending magnet and the detector was ∼45 m. A nearly parallel x-ray beam was used for imaging without blurring because of the small size of the x-ray source and the very long source-to-object distance. The single crystal monochromator selects a single energy of synchrotron radiation. The shutter system is located between the monochromator and the object. X-rays transmitted through the object are detected by an x-ray direct-conversion-type detector incorporating the x-ray saticon pickup tube. Monochromatic x-ray energy was adjusted to 37.5 keV, just above the barium K-edge energy, to produce the highest contrast image of the barium (Fig 1B). X-ray flux at the object position was around 1 × 10¹⁰ photons/mm2 per second in imaging experiments. The images were acquired as 1024 × 1024 pixels with 10-bit resolution after analog-to-digital conversion. The FOV was 4.5 × 4.5 mm2, and pixel size was ∼4.5 μm.9,10

Schematic depiction of the monochromatic SR system. A, Illustration of the experimental arrangement for SR microangiography at BL28B2. B, Photon mass attenuation coefficient of barium (blue line) and liquid water (red line). Monochromatic x-ray energy is adjusted to 37.5 keV, just above the barium K-edge energy to produce the highest contrast image.
Mammographic Images
To compare spatial and contrast resolution, we obtained mammographic images, which are known for having the highest resolution in clinical applications,11 of murine brains. Digital images were captured at an energy level of 24 kV by using a molybdenum target and a molybdenum filter with 90° cranial projection. Source-to-image distance was 65 cm.
Induction of Focal Cerebral Ischemia
Permanent focal cerebral infarction was induced by ligation and disconnection of the left MCA of male SCID mice (n = 5), as described.12–14 Briefly, under inhaled halothane (3%) anesthesia, animals were placed on their right sides and a skin incision was made at the midpoint between the left orbit and the external auditory canal. The temporalis muscle was incised, and the zygomatic arch was removed to expose the squamous portion of the temporal bone. Using a dental drill, we made a small hole above the distal portion, M1, of the MCA, which could be seen through the exposure in the skull. The dura mater was opened, and the left MCA was electrocauterized and disconnected just distal to its crossing of the olfactory tract. Body temperature was maintained at 36.5°–37°C by using a heat lamp during the operation and for 2 hours after MCA occlusion. Cerebral blood flow (CBF) in the left MCA area was measured by laser-Doppler flowmetry (Advance, Tokyo, Japan). The holding device of the laser probe (ALF probe; Neuroscience, Osaka, Japan) (1.5 mm in diameter, 7.0 mm in length) was secured on the cranium at a site located above the ischemic core of the left MCA area (approximately 1 mm anterior and 5 mm distal to the bregma), and CBF was monitored during the procedure and 24 hours after ligation of the MCA. Mice displaying a decrease in CBF by ∼75% immediately after the procedure and thereafter for an additional 24 hours were used for experiments.15 Nine days after induction of cerebral ischemia, the cerebral microcirculation was examined by SR imaging.
MR Imaging System
To confirm cerebral infarction consequent to ligation of the MCA, we performed MR imaging on day 2 poststroke. MR imaging used a 2T compact MR imaging system with a permanent magnet (MRmini SA206, Dainippon Sumitomo Pharma, Osaka, Japan) by using a radio-frequency solenoid coil for signal-intensity detection. For each imaging sequence, 15 coronal images were acquired with a section thickness of 1 mm, gapped at 0.5 mm. T1-weighted spin-echo MR images were acquired with a TR/TE of 500/9 ms, a FOV of 36.6 × 18.3 mm, an image acquisition matrix of 256 × 128, and NEX, 4. T2-weighted spin-echo MR images were obtained with TR/TE, 3000/69, 256 × 128, and NEX, 2. Because the sequences to obtain diffusion-weighted images by using this machine are still in development, we evaluated the cerebral ischemia by T2-weighted images on day 2 poststroke.
Data Analysis
In all experiments, the mean ± SE is reported.
Results
Visualization of Cerebral Arteries by SR Imaging
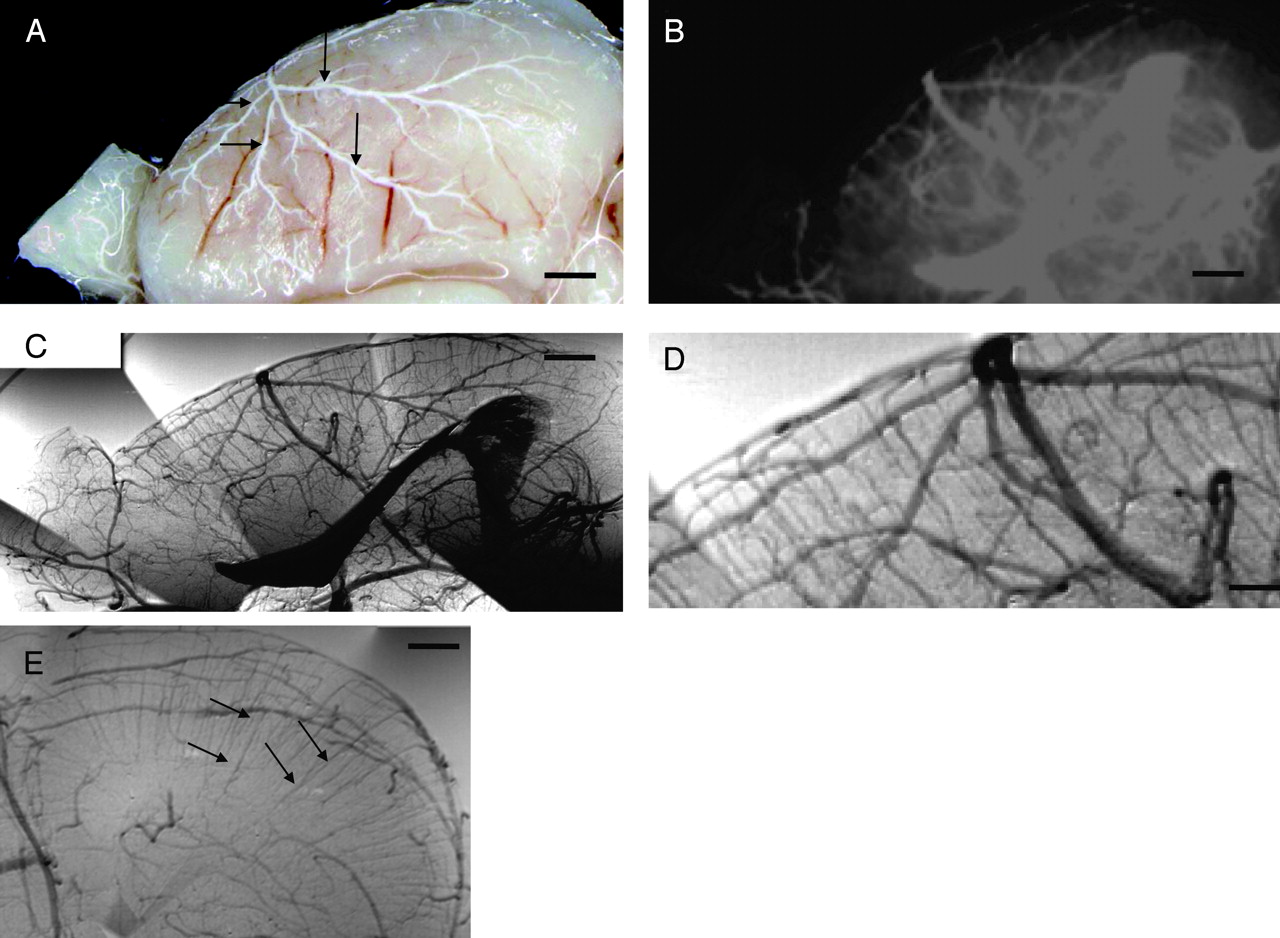
After euthanasia and systemic perfusion with PBS, barium sulfate particles were infused via the left ventricle of the heart. As shown in Fig 2A, cerebral arteries on the brain surface were filled with contrast medium. First, we investigated vascular images by mammography (Fig 2B). However, sufficient spatial and contrast resolution was not obtained by mammographic imaging to evaluate the angioarchitecture of small cerebral vasculature. Peripheral branches of the MCA (75–100 μm in diameter) and small vessels emerging from peripheral branches were barely visualized.

Angiographic image of mouse cerebral artery. A, Macroimage of the right brain hemisphere. The cerebral arteries (arrows), but not cerebral veins, are filled with the barium sulfate. B, Cerebral microangiogram (90° caudal projection) with a mammographic soft x-ray machine. Mammography enables visualization of small cerebral arteries and penetrating intracerebral arteries, but the image is not sufficient to evaluate pathologic changes. C and D, Cerebral angiograms obtained by SR. Note that small cerebral vessels, including penetrating intracerebral arteries, are clearly visualized. Microvascular structures, such as orthogonal branching of penetrating intracerebral arteries from the cortical artery, are clearly observed by the enlarged SR imaging (D). E, Coronal section of a cerebral microangiogram. Two distinct penetrating intracerebral arteries, superficial penetrating arteries and deep penetrating arteries (arrow), are clearly observed by the SR image. Scale bars: 1 mm (A and B), 0.5 mm (C and E), and 250 μm (D).
Next, we investigated the vascular profile by using SR (Fig 2C, normal view; -D, enlarged view). At the brain surface, cortical arteries branching from the MCA and pial arteries, ∼30 μm in diameter, were clearly visualized. Within the brain parenchyma, penetrating intracerebral arteries, branching orthogonally from cortical or pial arteries, were also observed. The interval between intracerebral arteries was 126.1 ± 35.5 μm (n = 20), the diameter of the proximal side of the intracerebral arteries was 29.5 ± 3.1 μm (n = 20), and each intracerebral artery was observed to progressively narrow to a diameter below the limit of resolution (10 μm). Vascular diameters determined by SR imaging of intracerebral arteries and small arterial branches were identical to those observed in previous pathologic studies of murine brain.16 Using SR imaging, we could discern 2 types of intracerebral arteries: superficial penetrating arteries perfusing only the cortical area and penetrating arteries reaching the subcortical area and perfusing the deep white matter. These vascular structures observed in murine brain by SR imaging are similar to previous observations in human anatomic studies.17–20 Compared with mammographic images, SR imaging enabled visualization of penetrating intracerebral arteries (diameter range of 10–30 μm), as well as small peripheral branches of MCA at the brain surface, with remarkable clarity. Using a coronal view for cerebral microangiograms, we also discerned 2 distinct penetrating arteries, superficial and deep (Fig 2E).
SR Images after Cerebral Infarction
To evaluate cerebral vasculature in the context of pathologic changes, cerebral infarction was induced by ligation of the MCA. The area of cerebral infarction was visualized by MR imaging on day 2 after induction of stroke. As we have shown previously by 2,3,5-triphenyltetrazolium staining,12 limited cortical infarction was observed in the MCA area on T2-weighted images (Fig 3A). In contrast, no hyper- or hypointense region was observed on T1-weighted images (Fig 3B), indicating the absence of bleeding or parenchymal injury. Although no morphologic (Fig 3C) or vascular structural (Fig 3D) changes were observed in the right hemisphere (nonstroke side), by day 9 after MCA occlusion, tissue degradative changes were observed in the cortical and shallow white matter of the left MCA area (stroke side, Fig 3E). To evaluate the integrity of the microvasculature after stroke, we obtained SR images. The number of penetrating intracerebral arteries dramatically decreased, though cortical branches at the brain surface could still be visualized (Fig 3F). On the coronal view, the disappearance of the intracerebral arteries on the ischemic side was also clearly observed (Fig 3G).

A and B, Brain images after cerebral infarction. Induction of cortical cerebral infarction without hemorrhage is confirmed by MR T2-weighted images (A) and T1-weighted images (B) on day 2 after induction of stroke. C–G, Vascular structure 9 days after cerebral infarction. Compared with the contralateral nonischemic hemisphere (C), remarkable atrophic changes are observed in the ischemic hemisphere (E). With SR images, in contrast to the nonischemic side (D), degradative changes in penetrating intracerebral arteries are observed on the ischemic side, though surface branches of the MCA are still visualized (F). In coronal sections of cerebral SR microangiograms (G), compared with the contralateral nonischemic hemisphere, penetrating intracerebral arteries are scarcely visualized in the ipsilateral ischemic hemisphere (ie, the latter appeared as an apparently “avascular area”). Scale bars: 1 mm (C and E), 500 μm (D and F), and 2 mm (G).
Discussion
Cerebral artery disease in small vessels is a major cause of cerebral infarction and hemorrhage. Although pathologic changes in small arteries have been reported on the basis of microscopic analysis, it has been difficult to assess the morphology of small cerebral vessels in situ through imaging studies. Herein, we demonstrate that small cerebral vessels can be clearly visualized by microangiography by using SR.
Conventional angiography is commonly used to evaluate the vasculature. However, current angiographic methods, using conventional x-ray imaging, did not provide images of arteries <200 μm in diameter.8,21 Mammography, which has the highest spatial resolution in clinical practice, also does not have sufficient resolution to visualize small vessels with a diameter of <50 μm.11 Microangiographic techniques have been developed by using fine-focus x-rays and sensitive films to evaluate the microcirculation in the brain.20 These methods enable visualization of human cortical perforating arteries and medullary long branches (100 μm in diameter) by using 1-cm-thick sections of brain.20 However, the limit of detection by using these methods applied to thick sections has been reported to be vessels of 50 μm in diameter.22 Furthermore, visualization of smaller arteries required thin sections cut with a microtome.20 The latter method is not well-suited to the evaluation of 3D cerebral vascular trees.
Compared with these conventional methods, the principal advantage of SR is the small size of the electron beam, thereby providing a high-intensity x-ray point source. Using a nearly parallel beam of SR, along with a precise detection system (pixel size of 4.5 μm), allowed us to obtain high-quality angiographic images with excellent spatial resolution. Furthermore, setting SR at an energy level just above the K absorption of barium produced the highest contrast images. SR imaging provides a powerful tool to reveal the morphology of small cerebral arteries such as superficial and deep penetrating arteries, allowing analysis of their physiologic and pathologic properties under a variety of conditions (ie, borderzone in infarction23,24 and microaneurysm formation).
Fluorescence microscopy is another tool potentially useful for analysis of the microcirculation.25 Although fluorescence microscopy provides visualization of microcirculation at the brain surface, the advantage of SR imaging is visualization of small vessels that have penetrated into the brain parenchyma, such as the subcortex. In addition, SR imaging allows performance of microangiography with an optimal projection. When the latter is combined with a microinjector, sequential real-time images can be obtained, providing the substrate for hemodynamic analysis.
In this article, we investigated SR imaging after stroke and showed that the SR image reflects pathologic changes previously observed by using anatomic/microscopic analysis. On day 9 after MCA occlusion, arteries on the surface of the cerebrum were visualized by SR, though penetrating intracerebral arteries were not detected. Previous studies have shown that the integrity of the distal cortical artery is usually maintained after occlusion of the proximal artery and that collateral flow is established through expansion of previously existing and/or formation of new vascular channels.25,26 Analysis with enhanced MR imaging has shown cerebral parenchymal enhancement in the stroke area by 1 week after cerebral infarction,27 indicative of blood flow in the peri-ischemic area. In contrast, penetrating intracerebral arteries were dramatically decreased in number in the ischemic hemisphere, though cortical branches on the brain surface were maintained after MCA occlusion. It has previously been shown that microvasculature in the ischemic territory displays adhesion of polymorphonuclear leukocytes in postcapillary venules, followed by the disruption of the microvascular network.28 These previous findings are consistent with the results of our vascular images obtained by SR after ligation of the MCA.
Conclusion
Our study demonstrates, for the first time, the morphologic features of small vascular networks in murine brain by microangiography by using SR imaging. Our approach provides a powerful tool for evaluating potential angiogenic/antiangiogenic therapeutic strategies, as well as pathologic examination of the cerebral microarterial tree.
Acknowledgments
We thank Y. Kasahara, K. Tomiyasu, and M. Aoki for technical assistance.
Footnotes
Experiments were performed at the SPring-8 BL28B2 beamline with the approval of the Japan Synchrotron Radiation Research Institute (acceptance No. 2005B0358).
This work was partially supported by a Grant-in-Aid for Scientific Research from the Ministry of Health, Labor and Welfare and The New Energy and Industrial Technology Development Organization.
References
- Received August 3, 2006.
- Accepted after revision August 31, 2006.
- Copyright © American Society of Neuroradiology


