
Abstract
BACKGROUND AND PURPOSE: Alzheimer disease (AD) is accompanied by macroscopic atrophy on volumetric MR imaging. A few studies have also demonstrated reduction in magnetization transfer ratio (MTR), suggesting microstructural changes in remaining brain tissue. This study assessed the value of measuring MTR in addition to volumetric MR in differentiating patients with AD from control subjects.
MATERIALS AND METHODS: Volumetric T1-weighted images and 3D MTR maps were obtained from 18 patients with AD and 18 age-matched control subjects. Whole-brain (WB) and total hippocampal (Hc) volumes were measured using semiautomated techniques and adjusted for total intracranial volume. Mean MTR was obtained for WB and in the Hc region. Histogram analysis was performed for WB MTR. Among patients, associations between volumetric and MTR parameters and the Mini-Mental State Examination (MMSE) were explored.
RESULTS: Patients with AD had significantly reduced WB volume (P < .0001) and mean WB MTR (P = .002) and Hc volume (P < .0001) and Hc mean MTR (P < .0001) compared with control subjects. Histogram analysis of WB MTR revealed significant reduction in the 25th percentile point in patients with AD (P = .03). Both WB volume and mean MTR were independently associated with case-control status after adjusting for the other using linear regression models. However, measuring Hc mean MTR added no statistically significant discriminatory value over and above Hc volume measurement alone. Of all MR imaging parameters, only WB volume was significantly correlated with MMSE (r = 0.47, P = .048).
CONCLUSIONS: This study demonstrates the independent reduction of WB volume and mean MTR in AD. This suggests that the 2 parameters reflect complementary aspects of the AD pathologic lesion at macrostructural and microstructural levels.
The hallmarks of Alzheimer disease (AD) are the accumulation of extracellular amyloid plaques and intracellular neurofibrillary tangles, as revealed by histopathologic examination. This is typically associated with neuronal loss and gliosis. This pathologic state, especially the neurofibrillary tangles, appears to start in the entorhinal cortex and hippocampus (Hc)1 and is associated with the early memory deficits of AD. There have been numerous efforts to develop MR imaging techniques as diagnostic markers of AD. These have particularly focused on volumetric measures of medial temporal lobe structures, including the Hc.2–7 However, there remains overlap between patient and control groups. Moreover, manual segmentation of medial temporal structures is labor-intensive and subject to inter-rater variability. Whole-brain (WB) volume measures have also been used to reflect the summation of global atrophy that accompanies the inevitable pathologic spread to other cortical regions. Rates of WB atrophy using serial MR scanning have been shown to be significantly increased in patients with AD compared with control subjects.8,9
Magnetization transfer (MT) imaging investigates the relationship between free protons, which are imaged by conventional techniques, and those bound to macromolecular structures.10 MT measurements depend on the local chemical and biophysical environment of macromolecules and so may allow the detection and quantification of the histologic changes that accompany—and may well precede—volume loss as a result of the disease process.11
The MT ratio (MTR) has been used as an overall measure of the MT phenomenon, and its value has been investigated in several neurologic conditions, including AD. A small number of cross-sectional studies have suggested that MTR may be a better discriminator of AD than atrophy measures. MTR parameters were found to be significantly reduced in patients with AD for WB,12,13 cortical gray matter,12,14 white matter,14 temporal lobes,12 and Hc.15,16
This cross-sectional study compared global and regional atrophy measures (by using established semi-automated techniques) with MTR parameters (from high-resolution 3D MT imaging) as markers of AD.
Subjects and Methods
Subjects
Eighteen patients with AD and 18 healthy control subjects were recruited into the study. Diagnosis of probable AD was made according to the criteria of the National Institute of Neurologic and Communicative Disorders and Stroke and Alzheimer Disease and Related Disorders Association.17 Healthy control subjects had no subjective complaints of memory or other cognitive impairment and had no major neurologic, psychiatric, or systemic illness that might affect cognitive function. The local ethics committee approved the study. Informed consent was obtained from all participants and with the assent of next of kin of all patients with AD. The Mini-Mental State Examination (MMSE)18 was performed on all subjects. Based on the MMSE score, 12 patients with AD had mild disease severity (MMSE score range, 19–25), 4 had moderate (MMSE score range, 10–18), and 2 had severe (MMSE score range, 2–9). All control subjects scored above 27 of 30 on the MMSE.
MR Acquisition
MR imaging was performed on a 1.5T Signa scanner running software version 5.8 (GE Medical Systems, Waukesha, Wis). The manufacturer's quadrature head coil was used for both transmission and reception. Volumetric T1-weighted coronal images were obtained using an inversion-recovery prepared fast-spoiled gradient-echo technique (matrix, 256 × 192; FOV, 24 × 18 cm [reconstructed as 256 × 256 over 24 × 24 cm], TR, 14 ms; TE, 5.4 ms; TI, 650 ms; NEX, 1; FA, 15°, yielding 124 contiguous 1.5-mm sections).
In addition, 3D volumetric coronal proton attenuation-weighted spoiled gradient-echo images were obtained, with and without MT weighting (matrix, 256 × 192; FOV, 24 × 18 cm [reconstructed as 256 × 256 over 24 × 24 cm]; TR, 22.6 ms; TE, 5.4 ms; NEX, 0.75/FA, 15°, yielding 124 contiguous 1.5-mm sections). MT weighting was obtained by using a radio-frequency prepulse to partially saturate the broad resonance of immobile macromolecular protons. The MT pulse was a Hamming apodized 3-lobe sinc pulse with a duration of 6.4 ms and an equivalent on-resonance flip angle of 350°, applied 2 KHz off-resonance. The entire sequence was within specific absorption rate limits. Total scanning time for MT imaging was 18 minutes and 26 seconds.19
MR Image Analysis
For volumetric analysis, scans were transferred to Sun workstations (Sun Microsystems, Mountain View, Calif) and analyzed using the MIDAS image analysis program for image viewing and processing.20 Scans were presented to the observer in random order, and all analyses were performed by persons blinded to subject details. The WB region (cerebral hemispheres, deep gray matter, cerebellum, and brain stem) was first extracted from skull, scalp, and other soft tissue using a semiautomated iterative morphologic technique. The region was then checked and manually edited where necessary to obtain a WB volume.20 All WB volume measurements were performed by a single experienced rater with intrarater variability of 1% (ratio of the absolute difference in measurement to the mean in each subject). To correct for differences in subject head size, total intracranial volumes (TIV) were calculated according to a previously described protocol.21 WB volumes were standardized to mean TIV of control subjects. The standardization was carried out by using the slope of the relationship between WB volume and TIV estimated from a linear regression model relating WB volume to TIV, with both variables on logarithmic scales.22 For Hc volume measurements, all scans were first registered to a standard brain template using a 6 df algorithm to reduce any variability in landmarks used in delineating the Hc.23 Each Hc was manually traced using multiple views to include the cornu ammonis, gyrus dentatus, and subiculum as described previously.24 All Hc volume measurements were performed by one experienced rater with intrarater variability of 3%. Total (right + left) Hc volumes were calculated and adjusted to mean TIV of control subjects.25 The standardization was carried in a fashion similar to that of the WB volume adjustment described above.
MTR Analysis
The MT prepared images were coregistered with the proton attenuation-weighted images by using a modified automated image registration (AIR) technique.26,27 MTR maps, expressed in percentage units (pu),28 were calculated pixel-by-pixel with the use of customized software according to the equation MTR = ([Mo − Ms]/Mo) × 100, where Ms and Mo represent the signal intensities with and without the saturation pulse. The MTR maps were registered to the volumetric scans by registering the proton attenuation-weighted images to the volumetric images and then applying the same transformation to the MTR maps.
Mean MTR was measured over the WB and in the Hc, pons, and parietal white matter (PWM) as volumes of interest (VOIs). The pons was chosen as a control region, in the vicinity of Hc but not typically affected in AD.29 Although AD is a predominantly a gray matter disease, a control region in the white matter of the parietal lobe was outlined as the latter is less susceptible to CSF contamination, particularly in the presence of atrophy.
WB mean MTR was calculated by copying the segmented WB region from the volumetric image to the co-registered MTR map. Right and left Hc VOIs were outlined using MIDAS on approximately 15 coronal sections, avoiding the inclusion of CSF as much as possible. However, some CSF contamination was inevitable (Fig 1A). Right and left PWM VOIs were drawn in the coronal plane on approximately 4 sections (Fig 1B). Total Hc and PWM mean MTRs were calculated by averaging left and right mean MTRs for the Hc and PWM regions, respectively. A VOI was drawn in the center of the pons on approximately 4 coronal sections (Fig 1A).

Outlining volumes-of-interest in the coronal plane of magnetization transfer ratio maps of a patient with Alzheimer disease: left and right hippocampal and central pontine regions (A) and left and right parietal white matter regions (B).
In addition, histogram analysis was performed for WB VOIs. Pixels with 0 pu value (representing areas, mainly in background air regions, where signal-to-noise ratio in the original images was too low to calculate MTR) were first removed, and the remaining pixels were plotted as histograms with bin width of 0.1 pu. The histograms were normalized to correct for differences in brain volume and smoothed with a moving average window of 0.9 pu. The peak height, peak location, 25th percentile, 50th percentile (median), and 75th percentile points were then calculated from the histograms.
Statistical Analysis
Demographic, MMSE, and imaging data of patients with AD and control subjects were compared using the 2-sample t test, except for sex, where Pearson χ2 test was used. A multiple logistic regression model was used to relate case-control status jointly to volumetric and MTR measures. However, a marked difference between the P values for the Wald and likelihood ratio tests suggested that the logistic regression model should not be relied on. Instead, to assess the extent to which volumetric and MTR measures were independently useful in differentiating patients with AD from control subjects, linear regression models were used relating each of these variables in turn to case-control status while adjusting for the other factor. Robust standard errors were used in these models to allow for differential heterogeneity between control subjects and cases. The ability of adjusted volume, mean MTR, and their combination to distinguish patients with AD from control subjects was assessed through the construction of receiver operating characteristic curves and calculation of sensitivity at specificity of 90%. Pearson correlation coefficients (r) were used to investigate the associations between MMSE and the various MR measures among patients with AD.
Results
Subjects
AD patient and control groups were not significantly different in terms of age and sex (Table 1). Patients had significantly lower mean MMSE than control subjects.
Demographic, clinical, and MR imaging data
MR Imaging Results
Volumetric measurements revealed that patients with AD had significantly smaller adjusted WB and total Hc volumes than control subjects (Table 1). The reductions are equivalent to approximately 10% for whole brain and 27% for Hc. In addition, patients with AD had significantly lower mean MTR for WB and total Hc but not PWM or pons (Table 1). WB MTR histogram analysis revealed that patients had significantly reduced 25th percentile point, but not peak height, peak location, median, or 75th percentile points.
From linear regression models with robust standard errors, WB adjusted volume differed significantly between patients and control subjects after adjustment for WB mean MTR (P < .0001). Further, WB mean MTR differed significantly between patients and control subjects after adjustment for WB adjusted volume (P = .008), demonstrating that both of these measures were independently associated with disease. There were no significant associations between WB adjusted volume and mean MTR among patients (r = 0.06, P = .81) or control subjects (r = 0.27, P = .27). Mean 25th percentile point did not differ significantly between patients and control subjects after adjustment for WB-adjusted volume (P = .22).
For Hc regions, the adjusted volume differed significantly between patients and control subjects after adjustment for Hc mean MTR using a linear regression model (P < .0001). However, Hc mean MTR did not significantly differ between patients with AD and control subjects after adjustment for total Hc-adjusted volume (P = .07). There was a significant correlation between total Hc-adjusted volume and Hc mean MTR among control subjects (r = 0.52, P = .03) but not among patients with AD (r = 0.33, P = .18).
Sensitivity and Specificity
Figure 2A demonstrates the superiority of measuring a combination of WB adjusted volume and mean MTR over either of these measures in isolation. With specificity set at 90%, the sensitivities of WB-adjusted volume and mean MTR in differentiating patients from control subjects were 50% and 33% respectively. The linear combination that best discriminates between patient and control groups was 10.8× adjusted brain volume (L) + WB mean MTR (pu). For this combination, the sensitivity was 83%. For the Hc region, measuring total volume and mean MTR had sensitivities of 89% and 61%, respectively, in differentiating patients and control subjects, with specificity set at 90% (Fig 2B). Measuring both yielded a sensitivity of 89%, similar to that of total Hc volume alone.

Receiver operating curves plotting the sensitivity and specificity of differentiating Alzheimer disease patients from control subjects by measuring adjusted volume, mean magnetization transfer ratio or both for whole brain (A) and hippocampal regions (B).
Associations between MR Measures and MMSE
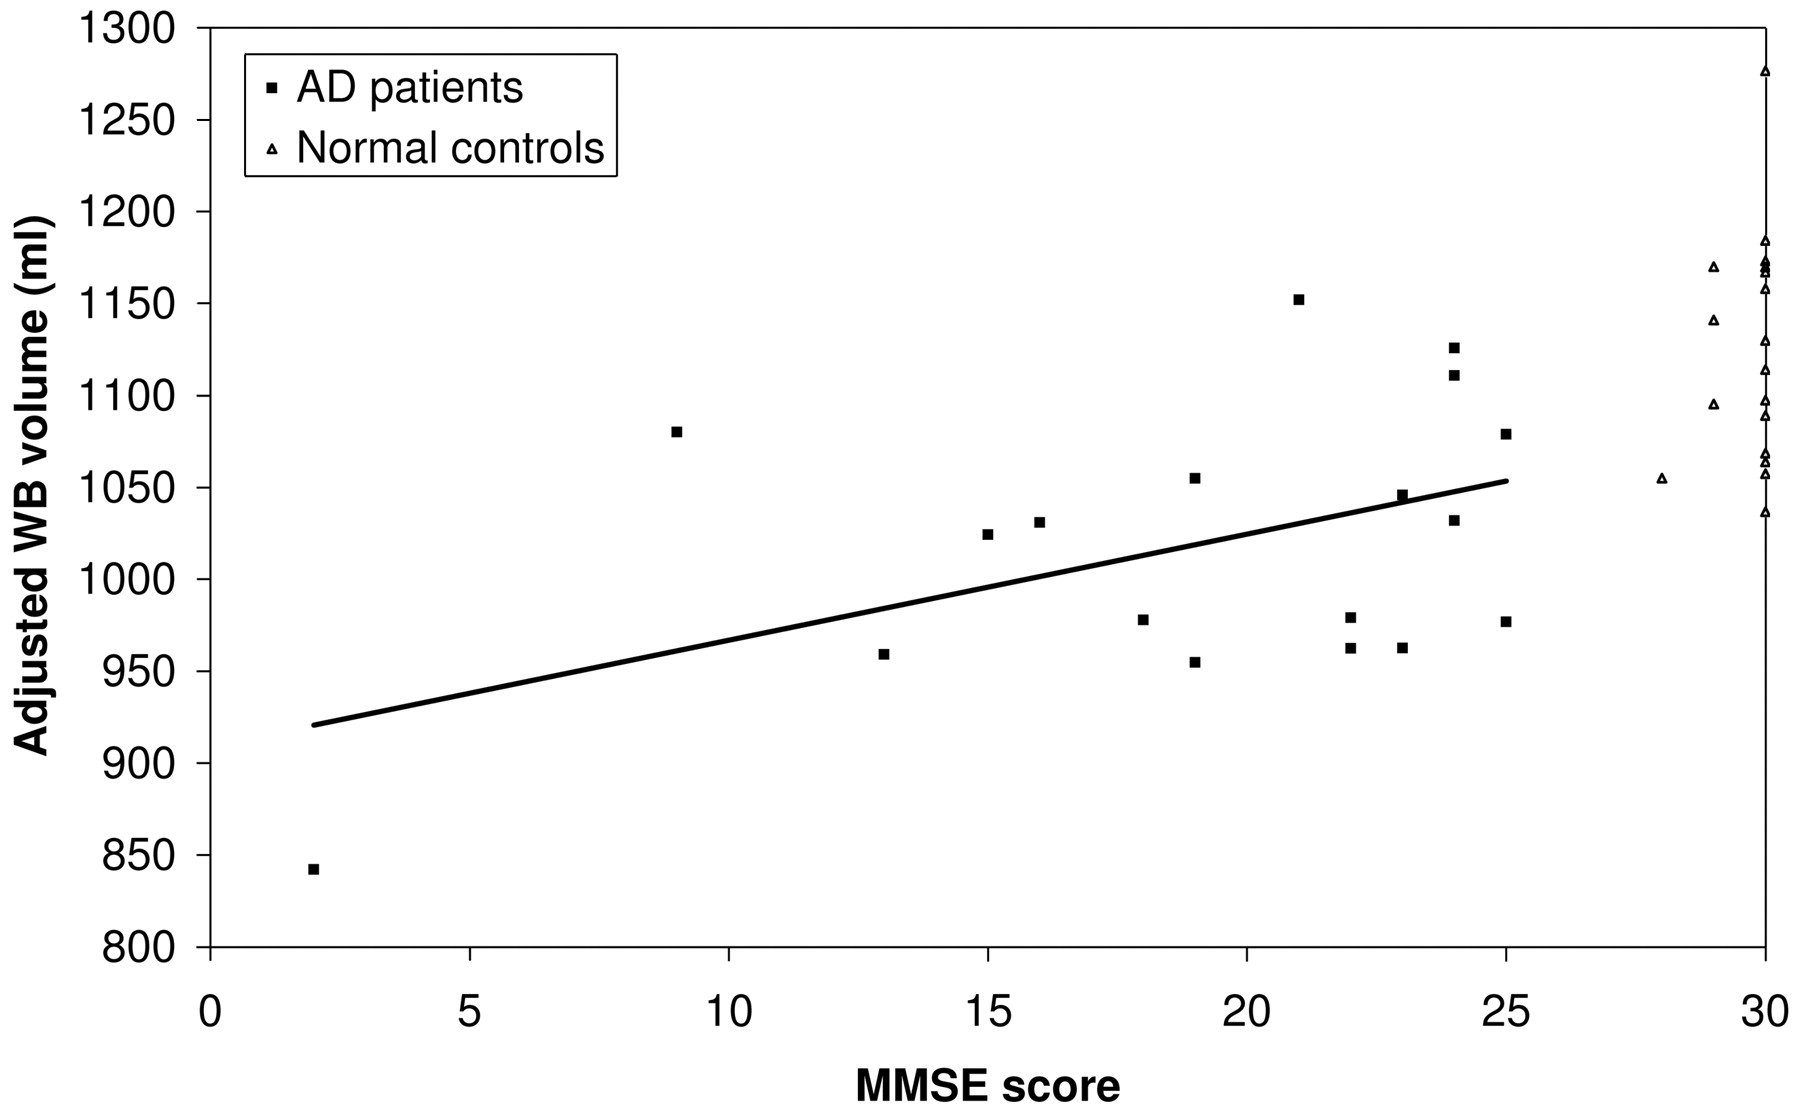
Table 2 shows the correlation coefficients for the relationships between MMSE and various volumetric and MTR measures among patients with AD. Only adjusted WB volume was significantly associated with MMSE (r = 0.47, P = .048) (Fig 3).

Relationship between adjusted whole brain volume and MMSE score among patients with AD and control subjects. The line indicates the linear regression of adjusted whole brain volume on MMSE score among patients with AD (correlation coefficient = 0.47, P = .048).
Pearson correlation coefficients (r) for the associations between MMSE and various MR imaging measures among patients with AD (n = 18)
Discussion
The current study used high-resolution MR images and robust semiautomated segmentation techniques to quantify atrophy and MTR parameters as applied to AD. The study has confirmed that WB volumes are reduced in AD with disproportionate Hc losses. In addition, mean MTR is significantly reduced in both WB and Hc. These reflect the early and significant burden of pathologic lesions in the Hc.1
At a global level, WB volume and mean MTR were independently associated with an AD diagnosis, implying that they reflect complementary aspects of the histopathologic changes that accompany AD. Measuring both parameters increased the sensitivity of differentiating patients from control subjects to 83% from 50% for WB volume alone or 33% for WB mean MTR alone.
In the Hc, measuring mean MTR had no added statistically significant discriminatory value to volume measurement. However, there was a nonsignificant trend for mean MTR to be lower among patients with AD after controlling for total Hc adjusted volume (P = .07). With specificity set at 90%, measuring Hc mean MTR in addition to total Hc adjusted volume did not change the sensitivity for differentiating patients from control subjects. This sensitivity of measuring Hc volume alone (89%) was still higher than that of measuring both WB volume and WB mean MTR together (83%). However, measuring total Hc-adjusted volume is laborious and time-consuming, making it impractical in a clinical setting. Moreover, unlike WB volume, neither of the Hc parameters was correlated with the MMSE within the patient group, which may reflect the idea that the MMSE is a measure of global cognition and/or the extensive functional damage to the Hc by the time AD is established clinically. The lack of significant reduction of mean MTR in the PWM or pons is likely to reflect the regional predilection of AD pathologic lesions. Further analysis using techniques such as voxel-based morphometry may help localize the brain regions, other than the Hc, that are contributing to the overall reduction in the WB mean MTR in AD. One limitation of the study is the inevitable influence of partial volume effects on measuring MTR parameters. Mean MTR for WB was calculated by copying segmented WB regions on volumetric T1-weighted images to the corresponding coregistered MTR maps. This may have resulted in inappropriate inclusion or exclusion of voxels, particularly around the brain-CSF boundary, and probably more so in patients with AD, where the ensuing atrophy might have resulted in greater susceptibility for partial volume effects. Likewise, partial volume effects may also have confounded measurement of MTR within the Hc regions, because total exclusion of CSF voxels was not possible. Although partial volume effect remains an inevitable confounding variable causing apparent reduction in mean MTR as a result of atrophy, we attempted to minimize this by: 1) using high-resolution imaging for both volume and MTR measurements; 2) taking care with segmentation of WB and specific regions, and 3) statistical modeling to control for the effect of atrophy on MTR.
WB histogram analysis revealed significant reduction of the 25th percentile point. However, this added no extra discriminatory value to measuring WB volume alone. Although we found no significant reduction in peak height, as seen elsewhere,12,13 there was a nonsignificant trend for a reduction in patients with AD compared with control subjects. Possible reasons for the lack of significance in this study include our small sample size, and heterogeneity of patients with AD between different study centers.
A limited number of studies have previously compared MTR and atrophy measures in differentiating patients with AD from control subjects. Hanyu et al showed a significant relationship between AD severity and both Hc atrophy using a visual rating scale and mean Hc MTR.15 The reduction in mean MTR was better than the visual rating scale in differentiating patients with AD from those with non-AD dementias.16 In our study, Hc volumetry may have fared more favorably because we used a more quantitative volume measurement rather than a visual rating scale to assess atrophy.
Bozzali et al12 showed that in addition to reduced WB volume, patients with AD had lower MTR histogram peak height than control subjects for WB, cortical gray matter, and temporal lobe gray matter measures, suggesting a complementary role of measuring MTR parameters to volumetry.
Van der Flier et al demonstrated significant reduction in MTR relative peak height and tissue volume for WB and frontal and temporal lobes in patients with AD compared with healthy control subjects.13 Subjects with mild cognitive impairment (MCI) had reduced MTR relative peak height for the WB and frontal lobes but no difference in atrophy, suggesting widespread tissue damage detected by MTR before any evidence of atrophy. Atrophy was derived by dividing the number of voxels representing CSF by the total number of voxels within their brain regions.
In another study, gray matter mean MTR was shown to be significantly reduced in MCI subjects compared with control subjects, despite absence of significant differences in gray or white matter volumes between the 2 groups.14 Patients with AD had significantly reduced gray and white matter mean MTR compared with control subjects. Gray matter volume was significantly lower; surprisingly, white matter volume was significantly greater in patients with AD than in control subjects. Brain volume images were registered to standard stereotaxic space as a method of correcting for difference in head size. It is possible that this apparent increase in white matter volume in AD was an artifact of the image analysis method, because it does not seem to fit with autopsy studies.
Conclusion
In summary, we found independent reduction of WB volume and mean MTR in AD. Measuring both whole brain volume and whole brain MTR increased the sensitivity of differentiating patients from control subjects to 83% from 50% for WB adjusted volume alone or 33% for WB mean MTR alone. Although both MR parameters were also reduced in the Hc region, measuring Hc mean MTR had no statistically significant discriminatory value over and above measuring total adjusted Hc volume alone. At a WB level, the 2 MR parameters may be reflecting complementary aspects of the AD pathologic state at macrostructural and microstructural levels.
Acknowledgments
We are grateful to Riitta Kukkastenvehmas and Philippa Bartlett for their help with running this study. We particularly thank the patients and their caretakers who participated in this study.
Footnotes
Current affiliation for E.B.L.: Centre for Vision Speech and Signal Processing, University of Surrey, UK.
This study was supported by the Alzheimer's Research Trust and Medical Research Council (to N.C.F, M.N.R), Multiple Sclerosis Society of Great Britain and Northern Ireland (to D.J.T), and Action Medical Research (to P.A.B).
References
- Received June 23, 2006.
- Accepted after revision September 18, 2006.
- Copyright © American Society of Neuroradiology
In this issue


Jump to section
Related Articles
Cited By...
- Microstructural Tissue Changes in Alzheimer Disease Brains: Insights from Magnetization Transfer Imaging
- Regional Analysis of the Magnetization Transfer Ratio of the Brain in Mild Alzheimer Disease and Amnestic Mild Cognitive Impairment
- Longitudinal Magnetization Transfer Imaging in Mild to Severe Alzheimer Disease
- Methodology of diffusion-weighted, diffusion tensor and magnetisation transfer imaging