
Abstract
BACKGROUND AND PURPOSE: Proton MR spectroscopy (1H-MR spectroscopy) is a well-established method for the in vivo investigation of the normal-appearing white matter (NAWM) in patients with multiple sclerosis (MS). Metabolic changes in NAWM are of special interest in patients with clinically isolated syndromes (CIS) suggestive of MS regarding further prognostic classifications. The purpose of this study was to investigate metabolic alterations in NAWM in patients with CIS with use of high-field 1H-MR spectroscopy and to compare the results to those in patients with an early course of MS.
MATERIALS AND METHODS: With use of a 3T whole-body MR imaging system, single-voxel 1H-MR spectroscopy (PRESS; TR: 2000 ms; TE: 38 ms and 140 ms) of the parietal NAWM was performed in 20 control subjects, 36 patients with CIS, and 12 patients with MS. Metabolite ratios and concentrations of N-acetylaspartate (tNAA), myo-inositol (mIns), choline, and total creatine (tCr) were determined.
RESULTS: Compared with the control group, mean NAWM mIns concentrations were significantly elevated in the MS group (4.56 mmol/L versus 3.75 mmol/L, P = .02) but not in the CIS group (4.04 mmol/L, P = .44). The higher concentration of mIns in the MS group was also reflected in the increased Ins/tCr ratio (P = .02). The mean NAWM tNAA was significantly decreased in both patient groups compared with the control group (CIS, 13.42 mmol/L, P = .02; MS, 12.77 mmol/L versus 14.51 mmol/L, P = .008).
CONCLUSIONS: A significant increase of the activity of the glial cells can only be observed in patients with an established diagnosis of MS but not in patients with CIS. Axonal damage occurs already during the first demyelinating episode in patients with CIS as well as in patients with definite MS.
MR imaging is the most sensitive and important paraclinical tool in the diagnosis and monitoring of multiple sclerosis (MS).1 In patients with clinically isolated syndromes (CIS) suggestive of MS, MR imaging is a helpful prognostic tool concerning the possible conversion to definite MS and the prediction of disability.2–5 However, although conventional MR imaging is still the most important MR method in the diagnosis and monitoring of MS,6 major parts of the activity of the disease, such as discrete metabolic and histopathologic changes within the normal-appearing white matter (NAWM) and gray matter (NAGM), cannot be detected.7, 8 In addition, the correlation between disease burden on conventional MR imaging in terms of lesion load on T2-weighted images and clinical disability is rather limited.9
Proton MR spectroscopy (1H-MR spectroscopy) is a highly sensitive MR technique that allows an in-vivo assessment of even subtle metabolic changes within the brain. In patients with CIS and definite MS, 1H-MR spectroscopy is increasingly becoming an important tool for the evaluation of the NAWM and NAGM.8, 10, 11 Two major metabolites have been well established in the characterization of metabolic alterations in the NAWM: the first one, the N-acetyl moiety (tNAA), constituting the summed concentrations of N-acetylaspartate (NAA) and N-acetylaspartylglutamate (NAAG), is found almost exclusively in neurons and their axons. Its singlet resonance can be well quantified at a longer echotime (TE), together with creatine/phosphocreatine (tCr) and choline-containing compounds (Cho). The second one, myo-inositol (mIns), is predominantly concentrated in astroglial cells, and its spin-coupled, fast-dephasing MR spectral components can only be quantified at short TE, similar to glutamate and glutamine (Glx). Whereas a decrease of tNAA is highly indicative of axonal degeneration or loss, or both, an increase in mIns in the white matter is highly suggestive of increased glial cell activity and therefore indicative of substantial inflammatory disease activity.7, 12–14
Recently performed 1H-MR spectroscopy studies in patients with definite MS have conclusively shown a significant decrease of tNAA in the NAWM, which indicates axonal damage even in the early stages of MS. This finding correlates significantly with clinical disability.11, 15–20 Besides the axonal damage within the NAWM, the glial cell activity is increasingly becoming an area of interest in patients with chronic inflammatory diseases of the central nervous system (CNS). Several studies have already demonstrated a significant increase of mIns in the NAWM of patients with definite MS.20–23
Metabolic alterations in the NAWM of patients with CIS are also of particular interest because these changes might have prognostic relevance for the clinical outcome and might be helpful to exclude other differential diagnoses. The results of recently performed 1H-MR spectroscopy studies focusing on this topic are inconclusive so far. A first 1H-MR spectroscopy study that included 20 patients with CIS demonstrated no significant metabolic alterations, whereas a second study from the same group that included 96 patients found a significant increase of mIns but no decrease of tNAA.24, 25
Although high-field MR imaging has been established in the clinical setting by now, most of the experiences in MR imaging and 1H-MR spectroscopy on patients with CIS and MS are limited to field strengths up to 1.5T.26 At greater magnetic fields, conventional MR imaging provides higher sensitivities in the detection of inflammatory brain lesions, and 1H-MR spectroscopy is likely to be more sensitive in the quantification of brain metabolites because of increased signal intensity and improved spectral separation.27–31 In particular, at 1.5T there is still considerable overlap of the signals from the C1–C3 and C4–C6 protons of mIns, with the CH triplet components of Glx centered at 3.76 ppm, whereas at 3T these 2 mIns multiplets appear as a pseudodoublet at 3.54 ppm and 3.62 ppm, well separated from the Glx resonances. Therefore, the step from 1.5T to 3T is also associated with a marked alteration in the MR spectral pattern of mIns, and improved quantification accuracy for mIns has indeed been observed at 3T.32
The aim of our study was to investigate the metabolic changes in the NAWM of patients with CIS with use of high-field 1H-MR spectroscopy operating at 3T, with special regard to mIns and tNAA, and to compare the results with the metabolic patterns in the NAWM of healthy control subjects and in patients with an early course of definite MS.
Methods
Patients and Healthy Control Subjects
48 patients (36 women, 12 men; median age, 34 years; range, 18–55 years) and 20 healthy control subjects (11 women, 9 men; median age, 29 years; range, 22–40 years) were prospectively included in this study. After the initial baseline MR imaging assessment shortly after the clinical event, all patients underwent a combined 1H-MR spectroscopy and multisequence MR imaging examination. We recruited all patients from the MS outpatient clinic of the Department of Neurology, University Hospital, Bonn, Germany. We obtained a written informed consent from all participants after we fully explained the study to them. Our local Institutional Review Board approved the complete study protocol.
Among the included 48 patients, 36 patients (26 women, 10 men; median age, 35 years; range, 18–55 years) presented with clinically isolated syndromes suggestive of MS, and 12 patients (10 women, 2 men; median age, 29 years; range, 19–38 years) with an early course of relapsing-remitting MS (RRMS) according to the International Panel Criteria for MS.33 Before the MR examination, a neurologic examination including the assessment of the Expanded Disability Status Scale (EDSS)34 was performed by an experienced neurologist. Additional neurologic work-up included the CSF parameters (including the assessment of cellularity, protein level, intrathecal IgG synthesis, and oligoclonal bands by isoelectric focusing) and visual evoked potentials. All differential diagnoses of CIS and MS including vascular, malignant, infectious, and other immunologic diseases of the CNS were excluded by appropriate tests. None of the study patients had a past medical history of malignant, vascular, infectious, or other immunologic diseases. They also received neither immune-modulating therapy nor corticosteroid treatment within the previous month.
Slight differences in age and sex distributions between the healthy controls and the patients were accepted according to recent published data. Accordingly, possible age-related changes in metabolite concentrations between both patient groups can be neglected, considering the difference of only 6 years in median age.35
MR Imaging Protocol
We performed the MR examinations with a 3T whole-body MR system (Gyroscan Intera; Philips Medical Systems, Best, the Netherlands) using an 8-element phased array sensitivity encoding (SENSE) head coil. The MR system was equipped with gradients with a maximum slew rate of 150 mT/m/ms and a maximum strength of 30 mT/m. The imaging protocol included 21 contiguous sagittal sections of a T2 turbo spin-echo (TR, 3575 ms; TE, 100 ms; measured voxel size, 0.9 × 0.9 × 2 mm) and 24 contiguous axial sections of a T2 turbo spin-echo (TR, 4100 ms; TE, 100 ms; measured voxel size, 0.9 × 0.9 × 5 mm), of a fluid-attenuated inversion recovery (TR, 12000 ms; TE, 140 ms; inversion delay, 2850 ms; measured voxel size, 0.9 × 0.9 × 5 mm), as well as a T1-weighted spin-echo (TR, 500 ms; TE, 12 ms; measured voxel size, 0.9 × 0.9 × 5 mm) before and after the intravenous injection of Gd-DTPA (0.1 mmol/kg body weight). The detailed MR imaging parameters have been described previously.28, 36 We performed all sequences in an identical anatomic position. The scan orientation and repositioning was performed according to the guidelines of the Consortium of MS Centers.6
1H-MR Spectroscopy
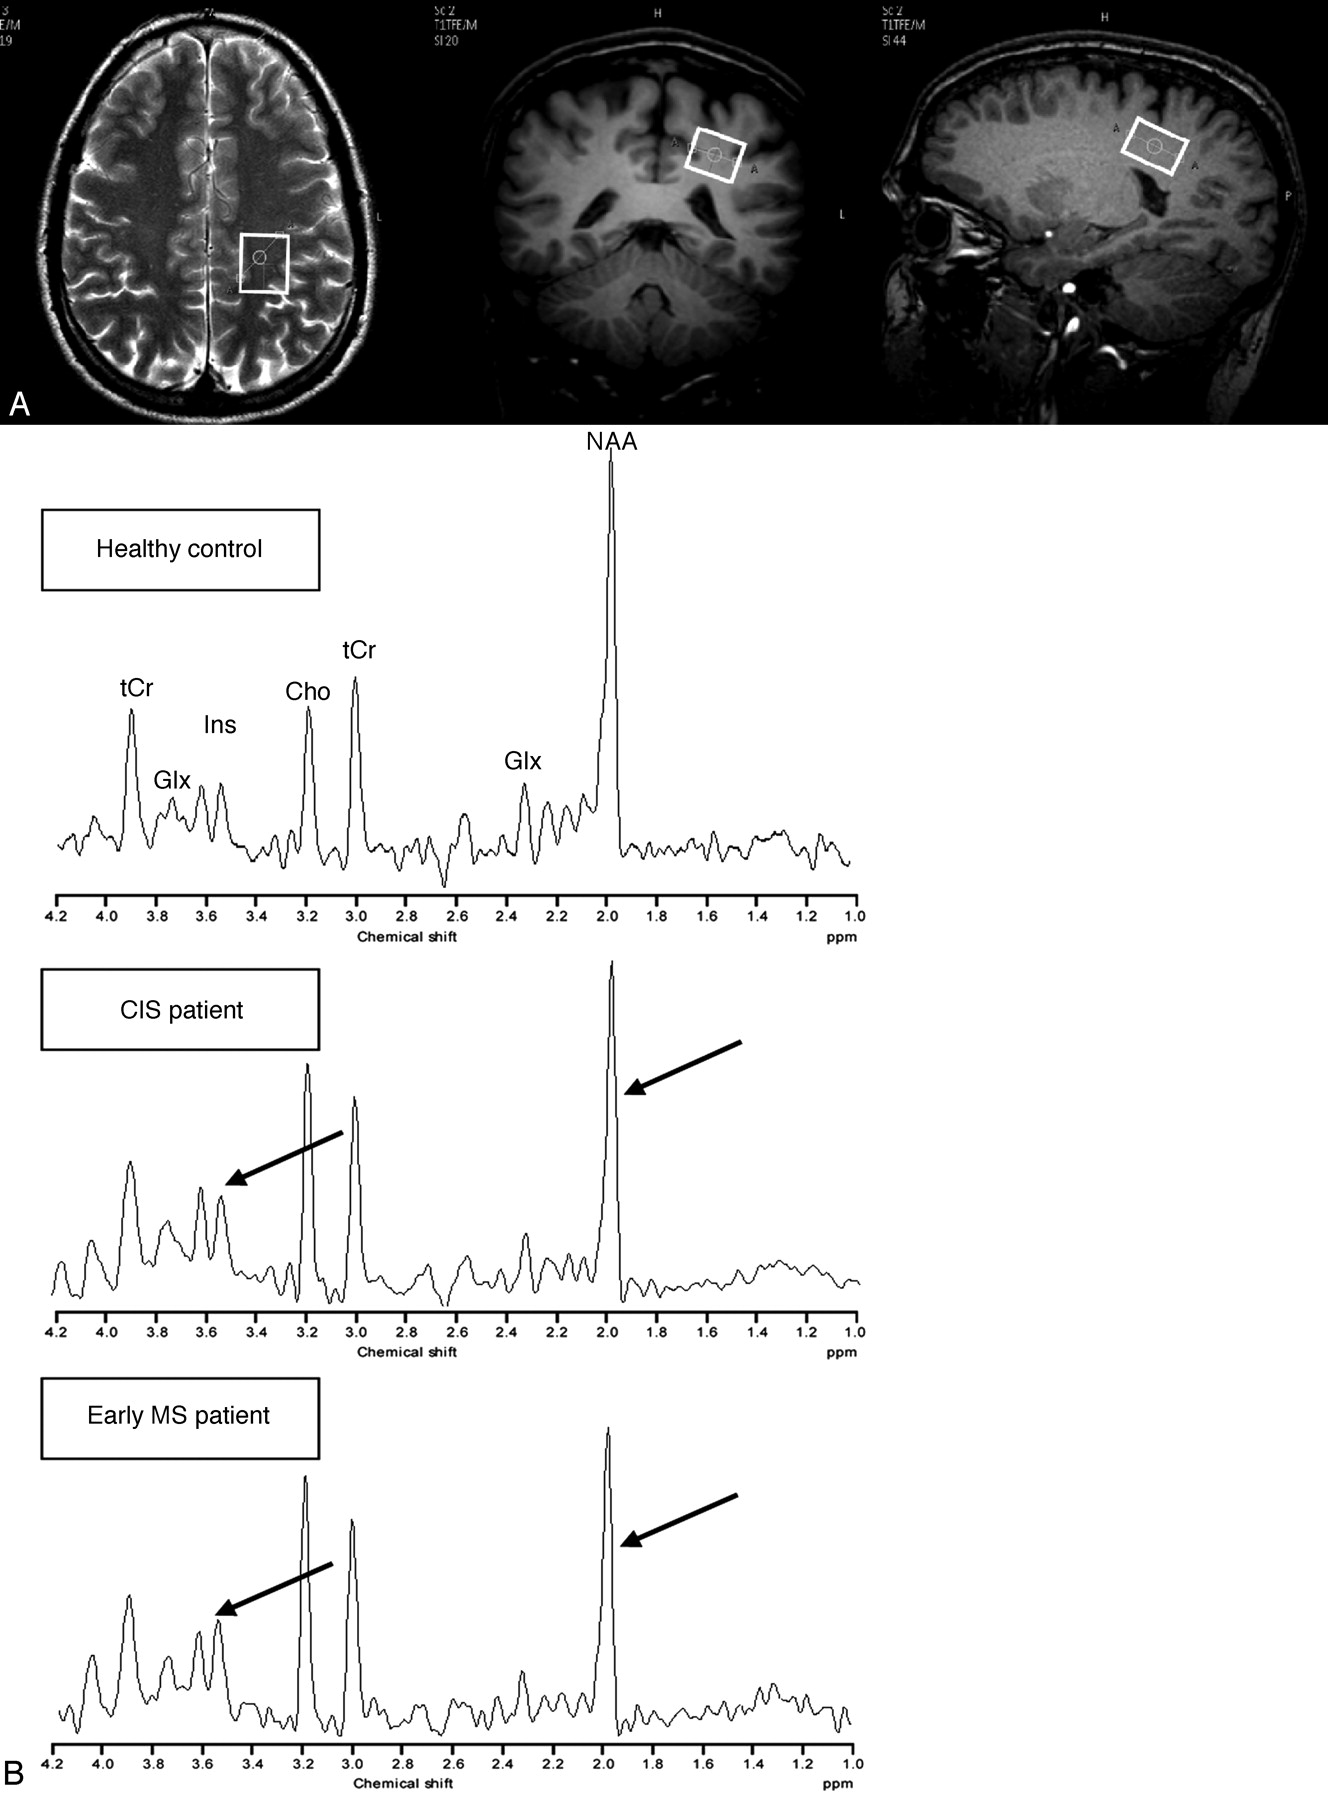
All 1H-MR spectroscopy acquisitions were obtained within the same session as the MR imaging, before the administration of Gd-DTPA. The single-voxel 1H-MR spectroscopy was acquired from the parietal NAWM in the centrum semiovale region of the right or left hemisphere because no differences in the metabolite concentration of white matter in both hemispheres have been observed.37 An example of the voxel positioning is given in Fig 1. The same voxel size of 2.5 × 2.0 × 1.6 cm (8 mL) was chosen for both patient groups and the healthy control group.

A, Axial T2-weighted and coronal and sagittal T1-weighted MR images from a healthy control, demonstrating the positioning of the voxel (white frame) within the NAWM.
B, 1H-MR spectroscopy spectrum from a healthy control (upper row), a patient with CIS (middle row), and a patient with MS (bottom row). Note the decreased concentrations of tNAA in both patients and increased concentrations of mIns, particularly in the MS patient when compared with the age-matched healthy control (arrows). CIS indicates clinically isolated syndrome; MS, multiple sclerosis; tNAA, summation of N-acetylaspartate and N-acetylaspartyl-glutamate; mIns, myo-inositol; Cho, choline; tCr, summation of creatine and phosphor-creatine; Glx, summation of glutamate and glutamine.
We performed the 1H-MR spectroscopy acquisition with point-resolved spectroscopy sequence (PRESS) localization using a TR of 2000 ms, TE of 38 ms, 1024 samples, bandwidth of 2 Hz/pixel, and 96 signal averages. A standard automated “high-order” B0 shimming was performed up to the second order. We referenced the tNAA signal intensity to the internal water signal intensity in unsuppressed spectra (TR, 3500 ms; TE, 140 ms; signal averages, 32) to obtain absolute concentrations. The correction for partial CSF volume within the selected voxel was performed by unsuppressed T2 relaxometry (TR, 5000 ms; TE on 7 different times ranging from 40–750 ms). The measurement of the T2 relaxation times of tNAA, tCr, and Cho was obtained with a water-suppressed acquisition (TR, 2500 ms; TE, 6 different times ranging from 50–425 ms; signal intensity averages, 16). Postprocessing was performed using time domain analysis by the Java-based version of the MRUI software package (European Union project, distributed by Universitat Autònoma de Barcelona, Cerdanyola del Vallès, Spain).38 We quantified 22 spectral components within the water-suppressed data obtained at the shorter TE using the AMARES algorithm.39
Absolute concentrations of tNAA, mIns, Cho, tCr were determined as well as relative signal intensity ratios of these metabolites. The accuracy of absolute quantification was controlled in measurements on a phantom containing NAA, mIns, Cho, Cr, glutamate, and lactate in concentrations (NAA 12.5 mmol/L, mIns 7.5 mmol/L) similar to physiologic conditions.
Statistical Analysis
We performed all statistical analyses with the SPSS software package (SPSS, Chicago, Ill). P < .05 was considered statistically significant. The significances of the NAWM metabolite concentrations between both patient groups and the healthy controls as well as between the CIS and MS group were assessed by the nonparametric Mann-Whitney test for unpaired samples.
Results
Clinical Characteristics
At the time of the 1H-MR spectroscopy, the 36 patients presenting with CIS (clinical event: unilateral optic neuritis in 21 patients, brain stem syndromes in 7 patients, spinal cord syndromes in 5 patients, and polysymptomatic CIS in 3 patients) had a median EDSS of 1.5 (range, 0–3) and a median disease duration of 30 days (range, 2–173 days). The 12 patients with MS (initial event: unilateral optic neuritis in 8 patients, spinal cord syndromes in 1 patient, and polysymptomatic CIS in 3 patients) had a median EDSS of 0.5 (range, 0–3.5) and a median disease duration (estimated from the first clinical event) of 132 days (range, 102–196 days).
Conventional MR Imaging
Of the 36 patients who presented with CIS, 3 had a normal MR imaging scan without any acute and/or chronic inflammatory brain lesions. Among the remaining 33 patients with inflammatory brain lesions on MR imaging, 19 fulfilled the criteria for lesion dissemination in space. None of the patients showed a lesion dissemination in time when compared with the initial baseline MR imaging assessment shortly after the clinical onset and therefore did not fulfil the criteria of definite MS according to the International Panel criteria.33
All patients with definite MS showed abnormal MR imaging with inflammatory brain lesions. There were 5 patients who showed a new gadolinium-enhancing lesion; 1 patient, a new T2-hyperintense lesion 3 to 4 months after the first clinical event; and 1 patient, a new T2-hyperintense lesion 6 months after the first attack. Five patients had a second clinical attack and converted to definite MS: 2 patients at 3 months, 1 patient at 4 months, and 2 patients at 6 months after the first clinical episode. None of the healthy controls showed any abnormalities on the MR imaging.
1H-MR Spectroscopy
The metabolic concentrations of the NAWM in the healthy controls, the patients presenting with CIS, and the patients with an early course of MS are summarized in the Table. Examples of MR spectroscopy spectra in a healthy control, and in patients with CIS and MS are given in Fig 1. Reproducibility of absolute concentrations was better than 2% for NAA and better than 8% for all other listed metabolites when the described quantification method in measurements on the phantom solutions was applied.
NAWM metabolite concentrations in healthy controls and patients presenting with CIS and definite MS*
tNAA in NAWM
Both patient groups had significantly lower absolute tNAA concentrations in the NAWM compared with the healthy control group (CIS: −7.5%, P = .02; MS: −12%, P = .008). The tNAA concentration in NAWM of the MS group was even lower compared with the CIS group (−4.8%). However, this difference did not reach statistical significance (P = .3). The differences of tNAA concentrations in the patients with CIS and early MS compared with the healthy controls were still significant when expressed as ratios to tCr (CIS: P = .01; MS: P = .003) and Cho (CIS: P = .04; MS: P = .003).
mIns in NAWM
Compared with the healthy control group, the CIS group showed slightly higher absolute concentrations of NAWM mIns (+7.7%), which was not significant (P = .44). In contrast to this, the group with early MS showed a significant increase of NAWM mIns (21.6%; P = .02) compared with the healthy controls. Compared with the CIS group, higher mean concentrations of mIns (12.9%) were observed in the MS group, which did not reach a significant level (P = .07).
In consideration of the ratio measures with Cr as a internal standard, the NAWM mIns/Cr ratio was increased only in the MS group compared with the control group (0.64 vs 0.54), which also reaches statistical significance (P = .02). Even when compared with the CIS group, the higher mean mIns/tCr ratio in the NAWM of the patients with MS reaches a significant level (P = .01).
Cho and tCr in NAWM
The absolute concentrations of tCr and Cho in the NAWM of the CIS and MS groups were slightly but not significantly elevated compared with the healthy control group. In addition, no differences between the CIS and the MS groups could be observed.
Glx in NAWM
Decreased Glx/Cr ratios were seen in both patient groups compared with the healthy controls. The CIS group showed a 13.2% decrease and the MS group, a 21.2% decrease, which was significant for both groups (CIS: P = .03; MS: P = .02). Compared with the CIS group, a 9.2% lower Glx/Cr ratio was seen in the MS group, which was not significant (P = .22).
Discussion
The findings of the present study demonstrate that metabolite alterations in the NAWM are already present in the earliest stage of possible MS. The significantly decreased tNAA concentrations in patients with CIS reflect substantial axonal damage already occurring during the first demyelinating episode.
NAWM axonal damage in terms of decreased tNAA levels is a consistent finding in patients with definite MS, even in patients with early duration of the disease.11, 17–20, 22 In patients with CIS, results obtained from whole-brain 1H-MR spectroscopy studies provide evidence for significant global axonal damage.40 However, a significant alteration of the absolute tNAA concentration in the NAWM has not been reported up to date. Both major studies investigating metabolic changes in the NAWM of patients with CIS did not conclusively find significant decreased tNAA levels when compared with healthy controls.25, 41 However, it is notable that the study of Tourbah et al42 included only different subgroups of patients who presented with optic neuritis and expressed the tNAA measurement as a tNAA/tCr ratio and not as absolute concentrations, which makes a direct comparison rather difficult. In contrast to these studies, we observed significantly decreased NAWM tNAA concentrations (and a correspondingly reduced tNAA/tCr ratio) in patients presenting with CIS as well as in patients with a very short disease duration of RRMS. The lower tNAA concentration in the early-stage MS group compared with the CIS group was not significant, which indicates that this metabolite might not be well suited to differentiate between patients with CIS and those who already fulfill the criteria of definite MS.
The main difference between the CIS and the MS groups was the NAWM concentration of mIns. The patients with an already established diagnosis of MS showed a significantly increased mIns concentration in the NAWM compared with the healthy controls. This finding coincides with the results obtained from recent studies that investigated patients with RRMS and also patients with primary progressive MS, even in the early courses of the disease.19–21, 23, 42 The reproducible assessment of mIns is getting increasingly important because it has been shown that NAWM mIns concentrations are linked to functional impairment on the Multiple Sclerosis Functional Composite Scale and to clinical disability on the EDSS.19–21 Furthermore, mIns might be helpful to narrow the differential diagnosis of pathologic changes in white matter and to distinguish between inflammatory and age-related abnormalities.43 However, in the patients presenting with CIS, no significantly elevated concentrations of NAWM mIns could be observed. This might indicate that several pathologic processes that lead to a higher concentration of mIns, such as an increase of the activity or number of glial cells, or both, observably occur in patients with higher and longer disease activity rather than in those patients with a first clinical episode suggestive of MS.
In contrast to our results, Fernando et al25 recently reported higher absolute concentrations of NAWM mIns and not significantly decreased tNAA levels in patients with CIS as well as in patients with definite MS at 3 months after the initial clinical event. In methodical differences, it is noteworthy that this study included a larger study population and was performed at 1.5T with use of a smaller voxel size of 2 mL and a single short TE of 30 ms. In contrast to this, we performed a high-field MR spectroscopy at 3T by using a short (38 ms) as well as a long (140 ms) TE. The higher field strength especially provides an increased signal-to-noise ratio and a better spectral separation, particularly for the C4-C6 multiplet of mIns, which at 1.5T partly overlaps with the Glx signals.30, 31 In our patient cohort, we have to take into account that our CIS group had a relatively short median duration of disease of 30 days, whereas in most of the patients in the study of Fernando et al,25 the 1H-MR spectroscopy examinations were performed 3 months after the baseline assessment of the first clinical attack. In the group with early MS, the duration of the disease was almost comparable. However, it is questionable whether this discrete difference in the duration of disease in the patients with CIS is responsible for significant differences in the NAWM mIns concentrations and, therefore, in the activity of glial and other inflammatory cells in the CNS. Even in patients with early RRMS, the NAWM mIns concentrations did not significantly increase within a 2-year follow-up time interval.44
Abnormalities in the concentrations of several other metabolites in inflammatory brain lesions and within the NAWM of patients with MS have been reported. Among those, tCr is well known to be altered in acute and chronic lesions as well as in the NAWM.16, 23, 41 In the NAWM of patients with CIS, tCr seems to be slightly but significantly elevated.25 Although the increase of the NAWM tCr concentration in the CIS as well as in the MS group did not reach a significant level, these slightly higher tCr concentrations should be taken into account. Especially when expressing other metabolite concentrations as ratios to tCr, marginally higher levels of tCr might lead to minor sensitivities in tNAA (tNAA/tCr) or mIns (mIns/tCr) values. However, in our study, the lower tNAA concentration in the MS and CIS groups as well as the higher mIns concentration in the MS group remained significant even when Cr was used as an internal standard.
Cho is a metabolite that is located in all types of cells and is considered in many diseases of the CNS as a marker of membrane turnover. In patients with definite MS, greater concentrations of Cho are highly indicative of active inflammatory disease activity leading to an increased rate of membrane turnover. Although the results concerning the concentration of Cho are inconclusive so far, elevated concentrations of Cho have been reported in lesions as well as in the NAWM of patients with definite MS by some groups,20, 23, 25, 42 whereas no significant changes could be observed in the NAWM of patients with CIS. However, both patient groups in our study showed elevated absolute concentrations of Cho without reaching statistical significance. It is noteworthy that in both patient groups, almost exactly the same concentration of Cho could be observed. This feature coincides with results recently obtained in patients with CIS, but different in patients with an early course of MS in whom significantly higher concentrations of Cho were observed.25 Therefore, the role of Cho in the characterization of patients with suspected or definite MS remains uncertain, and larger trials including patients with different and clearly defined stages of the disease are necessary to evaluate the possible diagnostic and prognostic value.
Because histopathologic studies have shown some evidence that neuroinflammation and consequent neurodegeneration are associated, at least in part, with neuroexcitotoxicity in the presence of glutamate-producing immune cells and the expression of glutamate receptors, glutamate (Glu) is increasingly becoming an important marker for the characterization of the disease process in different ways. In patients with MS, Glu concentrations in the NAWM have been described as decreased, normal, or elevated.20, 23, 25, 42 Recently, a study primarily focusing on Glu with use of a special TE-averaged PRESS protocol at 3T demonstrated significantly higher absolute concentrations of Glu in lesions and in the NAWM of patients with MS.42 Because of the complexity of the MR spectroscopy pattern of Glu and the strong spectral overlap with the resonances of glutamine and γ-amino butyric acid even at 3T, our MR spectroscopy acquisition protocol did not allow a sufficiently accurate expression of the Glu component of the total Glx signal intensity as an absolute concentration of Glu. However, in both groups of patients with CIS and early MS, the Glx/Cr ratio decreased significantly, with a more pronounced reduction in the early-stage MS group. Lower levels of Glx in the NAWM have also been reported by another study that investigated patients with an early disease course, but this finding contradicts the higher concentration of Glx observed in patients with MS with longer disease courses.20, 42 The reasons for these discrepancies remain unclear at present but may at least, in part, be attributed to differences in the MR spectroscopy acquisition techniques and magnetic field strengths applied in these studies and the general problem of separating and correctly quantifying the spin-coupled components of the Glx resonances.
Conclusion
The present study of high-field 1H-MR spectroscopy of the NAWM in patients with CIS suggestive of MS and in patients with a very early course of RRMS demonstrates that axonal damage in the NAWM already occurs during the first clinical episode, whereas a significant increase in the activity of the glial cells can only be observed in patients with an established diagnosis of MS. Additional studies are necessary to evaluate whether mIns might be a sufficient marker to characterize the different inflammatory disease activities and stages in MS.
Footnotes
Previously presented at: 22nd Congress of the European Committee for Treatment and Research in Multiple Sclerosis (ECTRIMS), September 27, 2006; Madrid, Spain.
References
- Received October 24, 2006.
- Accepted after revision January 8, 2007.
- Copyright © American Society of Neuroradiology
In this issue


Jump to section
Related Articles
Cited By...
- The Prognostic Utility of MRI in Clinically Isolated Syndrome: A Literature Review
- Investigating Axonal Damage in Multiple Sclerosis by Diffusion Tensor Spectroscopy
- Magnetic resonance spectroscopy evaluation in patients with neuromyelitis optica
- Diffuse White Matter Damage Is Absent in Neuromyelitis Optica