
Abstract
BACKGROUND AND PURPOSE: Although neuroembolization has recently spread quickly, sufficient attention has not been focused on the associated radiation exposure. The purpose of this research was to evaluate the patient's entrance skin dose (ESD) during neuroembolizations in 6 institutions.
MATERIALS AND METHODS: This study was approved by all of the 6 institutional review boards, and all of the patients gave informed consent. This study included a total of 103 consecutive neuroembolizations in the 6 institutions. Patient ESDs during the procedures were evaluated by using caps that had 44 radiosensitive indicators adherent to the surface. The patient ESDs were calculated from the color difference of the indicators. To check for effects on the scalp, clinical follow-up was performed at 1-2 days, 2 weeks, and 3 months after the procedure.
RESULTS: The averages of total fluoroscopic time, total number of digital subtraction angiography frames, and dose area product were 67.1 ± 41.6 minutes, 883 ± 626, and 257 ± 150 Gy × cm2, respectively. The average maximum ESD for each patient was 1.9 ± 1.1 Gy (range, 0.4–5.6 Gy; median, 1.5 Gy). The average maximum ESDs of each institution ranged from 1.0 to 2.4 Gy. Epilation was observed in 6 patients.
CONCLUSIONS: The maximum ESDs during neuroembolizations exceed the thresholds for radiation skin injuries in some cases.
Neuroembolization is one treatment for diseases such as cerebral aneurysm, arteriovenous malformation, and dural arteriovenous fistula. Neuroembolization is characterized by low invasiveness and a wide range of indications, and so has recently spread quickly. The radiation exposure is greater than that during diagnostic angiography due to the prolonged fluoroscopic time and large number of digital subtraction angiography (DSA) frames, and it can induce radiation skin injuries.1–4 Although some methods of estimating the skin dose are available, the optimal method for archiving exposure to patients still has to be established. Different methods for the evaluation of entrance skin dose (ESD) and maximum skin dose have been proposed and tested.5–12 In this study, we evaluated the patients' ESD during this procedure by multiple-point measurement using radiosensitive indicators in 6 institutions.
Methods
Patient Population and Target Lesions
The protocol was approved by the regional ethics committees of the respective institutions. Informed written consent was obtained in accordance with the recommendations of the revised Declaration of Helsinki.
Our study included 103 consecutive patients (75 women and 28 men) who underwent neuroembolizations in 6 institutions (Foundation for Biomedical Research and Innovation, Jikei University Hospital, Kobe City Medical Center General Hospital, Kurume University Hospital, University of Tokyo Hospital, and Toranomon Hospital) during the period from December 2005 to March 2007. Their mean age was 58 ± 14 years (range, 19–82 years). Patient height and weight were 157.9 ± 9.3 cm (range, 142.5–178.0 cm) and 57.4 ± 11.5 kg (range, 36.6–90.2 kg), respectively. The details of target lesions were 86 cerebral aneurysms, 7 dural arteriovenous fistulas, 6 internal carotid artery cavernous sinus fistulas, and 4 arteriovenous malformations (Table 1).
Target lesions in each institution
Angiography
Seven kinds of angiographic units with image intensifier (n = 4) or digital flat panel detector (n = 3) were used (Table 2). The period of use of the units was 1–7 years.
Data of angiographic units
The FOV mainly used in each procedure was 11 (n = 5), 14 (n = 43), 15 (n = 2), 16 (n = 11), 20 (n = 7), 22 (n = 16), 23 (n = 5), 25 (n = 4), 28 (n = 1), 32 (n = 3), 40 (n = 2), 43 (n = 1), or 48 cm (n = 3). The FOVs of the digital flat panel detector were specified by the diagonal length. Pulsed fluoroscopy was used during all 103 of the procedures (8 pulses per minute, n = 1; 10 pulses per minute, n = 5; 15 pulses per minute, n = 86; 25 pulses per minute, n = 4; 30 pulses per minute, n = 7). Procedures were performed by 6 neurosurgeons and 2 radiologists, who had 6-20 years of experience with neurointervention. As a part of the study, we recorded the total fluoroscopic time, total number of DSA frames, and total dose area product (DAP) value. For biplane units, we used the total values, combining the values of frontal and lateral x-ray tubes.
Indicator Use and Evaluation
The patient put on a cap that had 44 radiosensitive indicators (RadiMap; Nichiyu Giken Kogyo, Saitama, Japan) adherent to the surface (Fig 1). The indicator was a rectangle of 1.3 × 1.8 cm and was applied with an adhesive to the reverse. Indicators were arranged in the right aspect (n = 19), left aspect (n = 19), and parietal aspect (n = 6) at intervals of 5 cm. An indicator had 2 kinds of functional dye (high-dose type and low-dose type). In this study, only low-dose type was used. With x-ray absorption, the color of the functional dyestuffs changed from translucent to red in the low-dose type.

Photograph of indicators. A total of 44 indicators were adhered to a cap (right aspect, n = 19; left aspect, n = 19; and parietal aspect, n = 6) at intervals of 5 cm.
Suzuki et al13 investigated methods to calculate the exposure dose from the color of the indicator. They analyzed the color of the indicators with a color-measuring instrument (Chroma Meters CR-300; Konika Minolta Holdings, Tokyo, Japan) and measured the color difference after irradiation. According to their report, there was an almost linear relationship between the color difference of the indicator and the natural logarithm of the dose between 0.3 Gy and 6.0 Gy for low-dose type. The regression equation was D = exp (DE*× 0.0543−2.168) for low-dose type, where D was the absorbed dose (Gy); DE* was the color difference of the indicator.
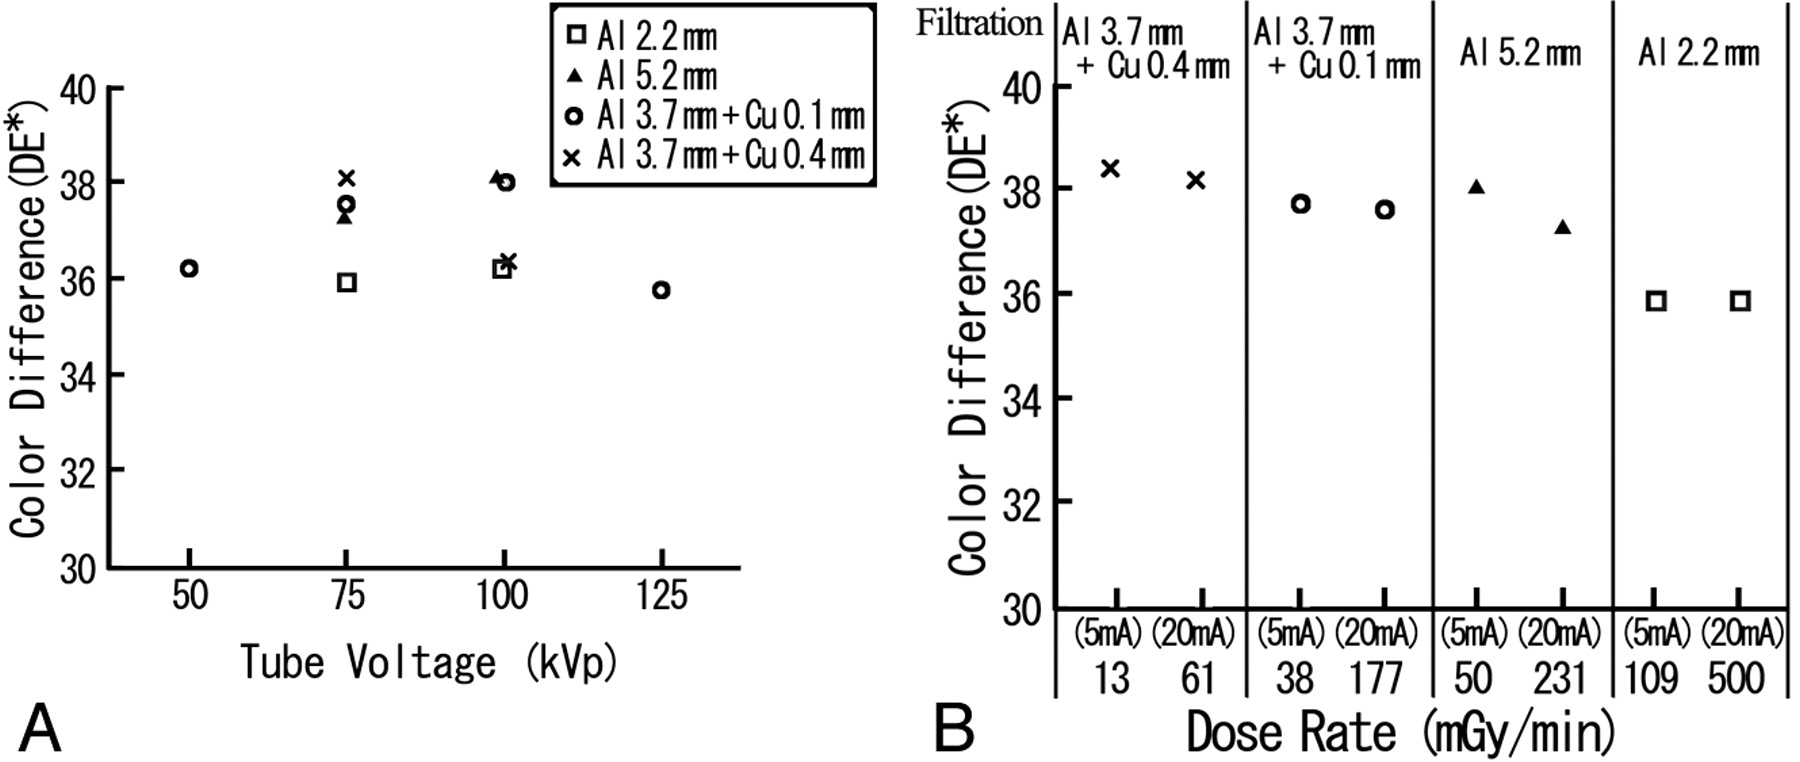
We assessed the effect of the tube voltage, filtration, and dose rate on the dose response of the indicator as follows. MBR-1520A-two (Hitachi Medico, Tokyo, Japan) was used as the x-ray irradiation equipment. Irradiation conditions were based on the following protocol: 50-, 75-, 100-, or 125-kVp tube voltage; 5- or 20-mA tube current; and total filtration of 2.2 mm of aluminum, 5.2 mm of aluminum, 3.7 mm of aluminum + 0.1 mm of copper, and 3.7 mm of aluminum + 0.4 mm of copper. Indicators were irradiated at the dose of 1 Gy. After the irradiation, the color of the indicators was analyzed with a color-measuring instrument (Chroma Meters CR-300). Figure 2A illustrates the effect of tube voltage and filtration on the color difference of the indicator. The difference in the color difference was within 2.20, resulting in a difference less than 0.11 Gy in the absorbed dose with the above regression equation. Figure 2B illustrates the effect of dose rate on the color difference. For each filtration, the difference in the color difference between the 2 dose rates was within 0.79, resulting in a difference less than 0.04 Gy in the absorbed dose.

Effects of tube voltage, filtration, and dose rate on the color difference of the indicator. A, Indicators were irradiated at the dose of 1 Gy by using 4 tube voltages (50, 75, 100, and 125 kV) and 4 types of filtration (2.2 mm of aluminum, 5.2 mm of aluminum, 3.7 mm of aluminum + 0.1 mm of copper; and 3.7 mm of aluminum + 0.4 mm of copper) with a 20-mA tube current. The difference in the color difference was within 2.20. B, The effect of the dose rate was also evaluated by using 2 tube currents (5 and 20 mA) for the 4 types of filtration at the dose of 1 Gy with tube voltage of 75 kVp. For each filtration, the difference in the color between the 2 dose rates was within 0.79. Al indicates aluminum; Cu, copper.
As shown in Fig 2, little effect of these factors on the color difference of the indicator was observed, and the angiographic unit factors are usually within these ranges. Therefore, we determined the absorbed dose by using the above regression equation.
After the procedure, the color of the indicators was analyzed with a color-measuring instrument (Chroma Meters CR-300), and the absorbed doses were calculated from the color difference of the indicators. We regarded the absorbed doses as the ESDs at the points. In each patient, we evaluated the ESDs in all of the 44 points on the cap and obtained the maximum ESD. Because the color of the indicator is changed by heat or light, the manufacturer recommends preservation at a temperature below 10°C in a dark place. According to the data provided by the manufacturer, little color change of the indicator is observed under fluorescent light at 40°C within 2 days. We preserved the cap with the indicators in a bag for shading and kept it in a refrigerator before and immediately after the neuroembolization. We analyzed the relationship between the total DAP and the maximum ESD by the Pearson correlation coefficient (r).
Follow-Up to Check for Effects on the Skin
To check for effects on the scalp, clinical follow-up was performed at 1–2 days, 2 weeks, and 3 months after the neuroembolization in 79 patients (65 cerebral aneurysm, 6 dural arteriovenous fistulas, 5 internal carotid artery cavernous sinus fistulas, and 3 arteriovenous malformations).
Results
Patient and Angiographic Data
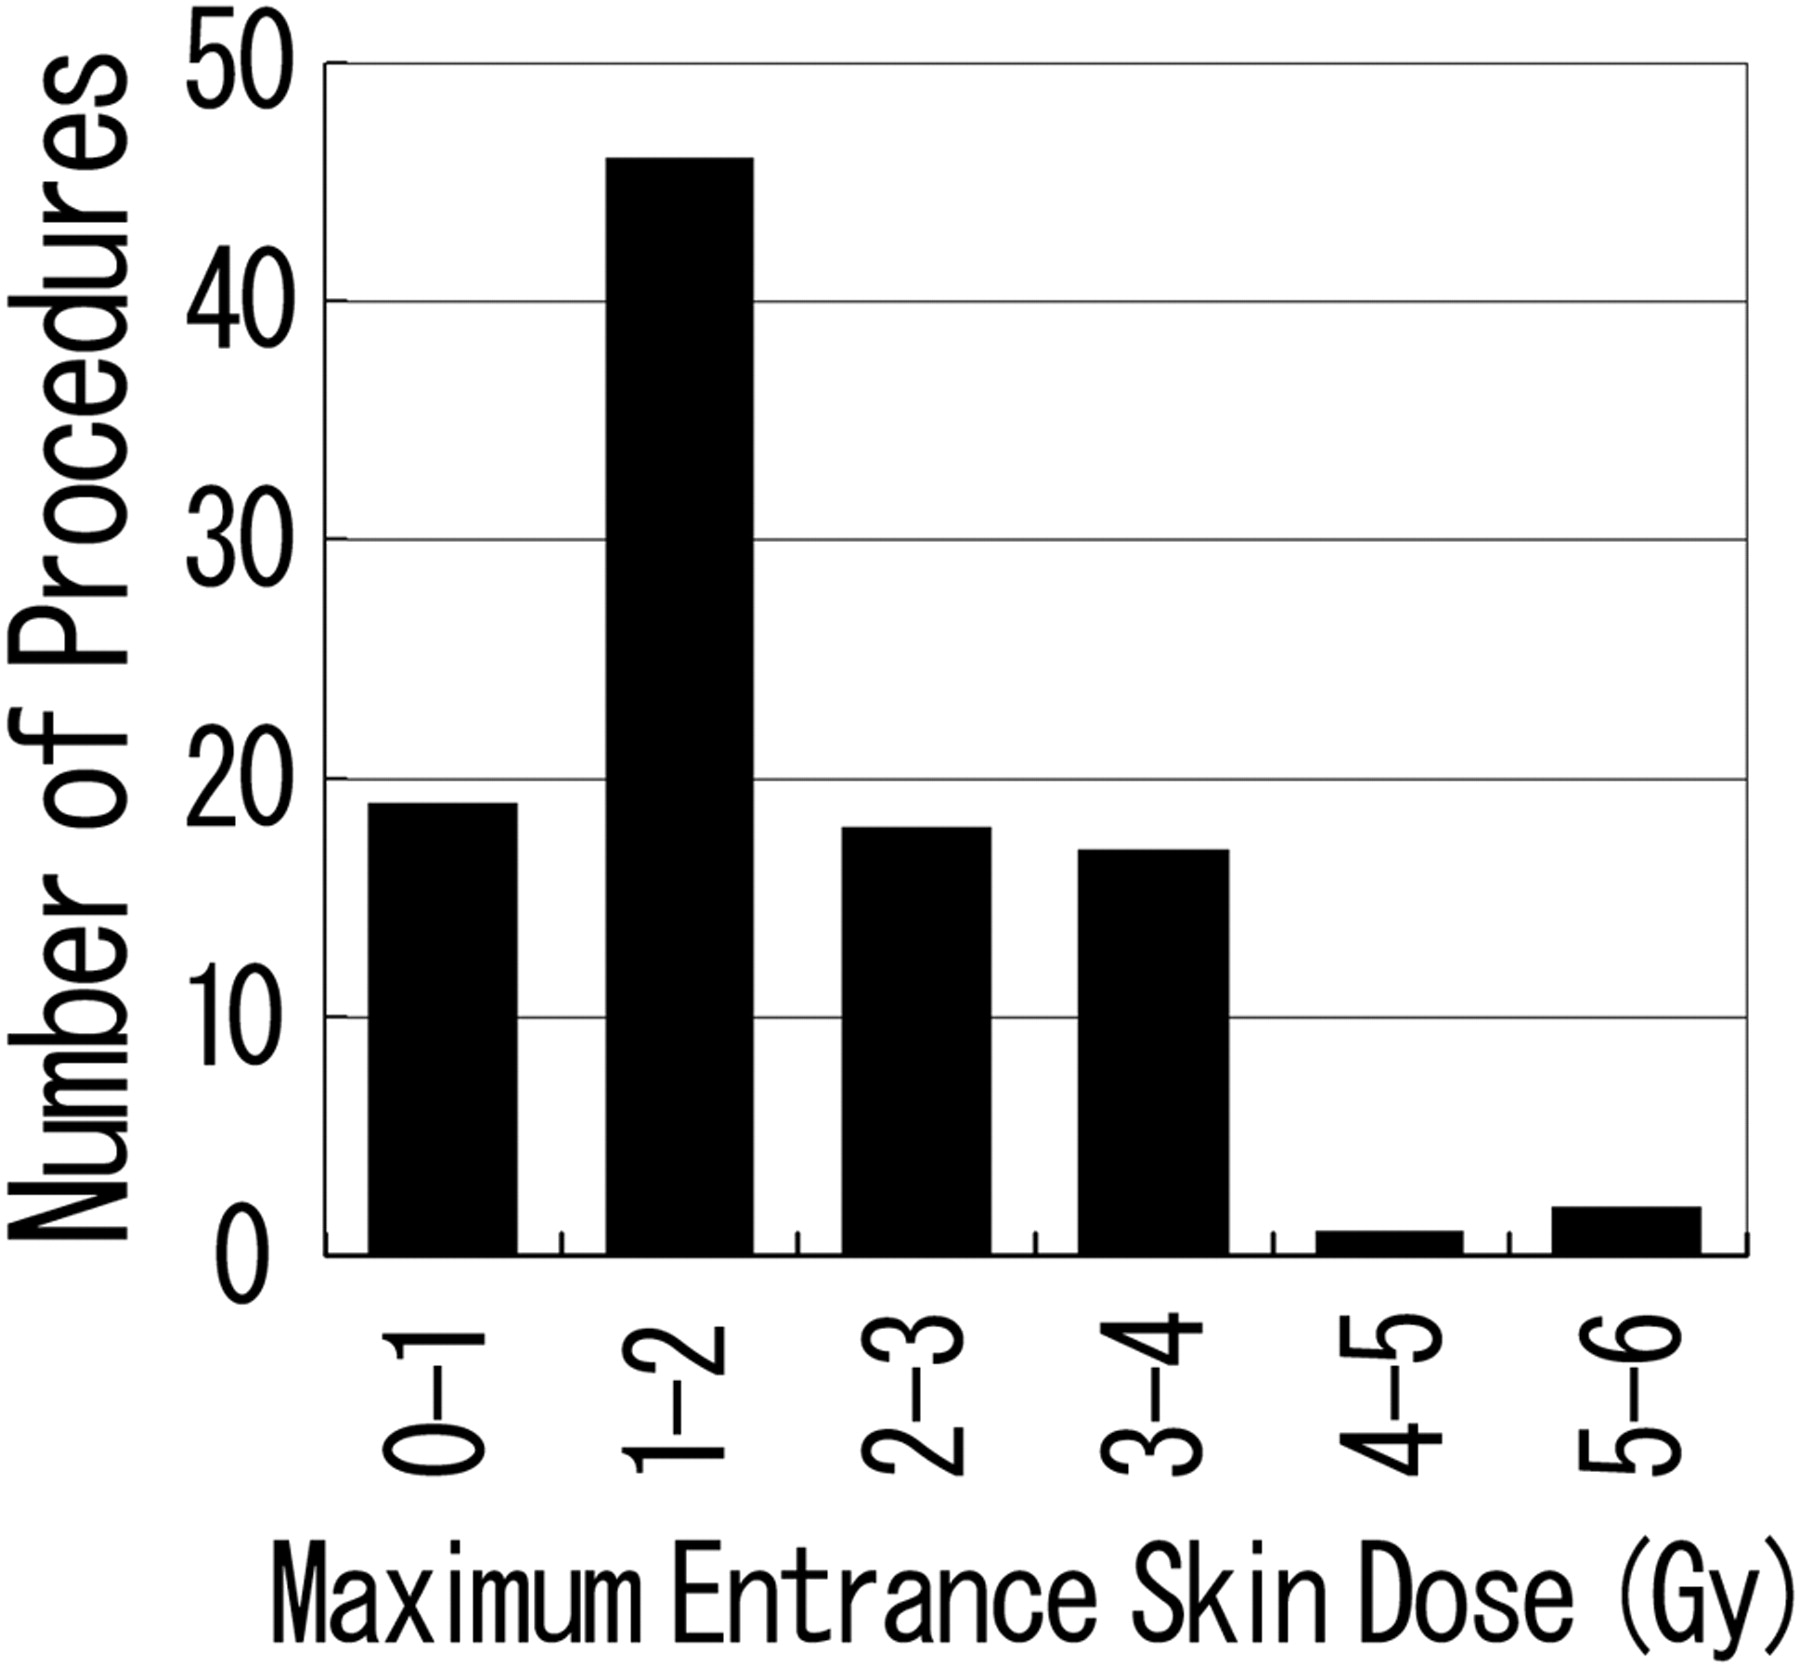
Table 3 shows the averages of total fluoroscopic time, total number of DSA frames, DAP, and maximum ESD. The average total fluoroscopic time was 67.1 ± 41.6 minutes (range, 8.1–204.5 minutes), and the average total number of DSA frames was 883 ± 626 (range, 219–5280). The DAP values were available for 93 procedures in 4 institutions, and the average DAP value was 257 ± 150 Gy × cm2 (range, 24–891 Gy × cm2). The mean of the maximum ESD for each patient was 1.9 ± 1.1 Gy (range, 0.4–5.6 Gy; median, 1.5 Gy). Of the 103 patients, 84 received ESDs exceeding 1 Gy, 20 received ESDs exceeding 3 Gy, and 2 received ESDs exceeding 5 Gy (Fig 3). The average dose, average total fluoroscopic time, average total number of DSA frames, and average DAP of each institution were 1.0 to 2.4 Gy, 32.8 to 114.8 minutes, 604–1756 frames, and 215–327 Gy × cm2, respectively.

Maximum ESD distribution of each procedure. The maximum ESD of the patients exceeded 1 Gy in 84 procedures, 3 Gy in 20 procedures, and 5 Gy in 2 procedures.
Averages of total fluoroscopic time, number of DSA frames, DAP, and maximum ESD in each institution
Table 4 shows the averages of total fluoroscopic time, total number of DSA frames, DAP, and maximum ESD for each target lesion. In the procedures for dural arteriovenous fistulas and internal carotid artery cavernous sinus fistulas, the average total fluoroscopic times exceeded 2 hours, and the maximum ESDs were 2 ≥ Gy.
Averages of total fluoroscopic time, number of DSA frames, DAP, and maximum ESD for each target lesion
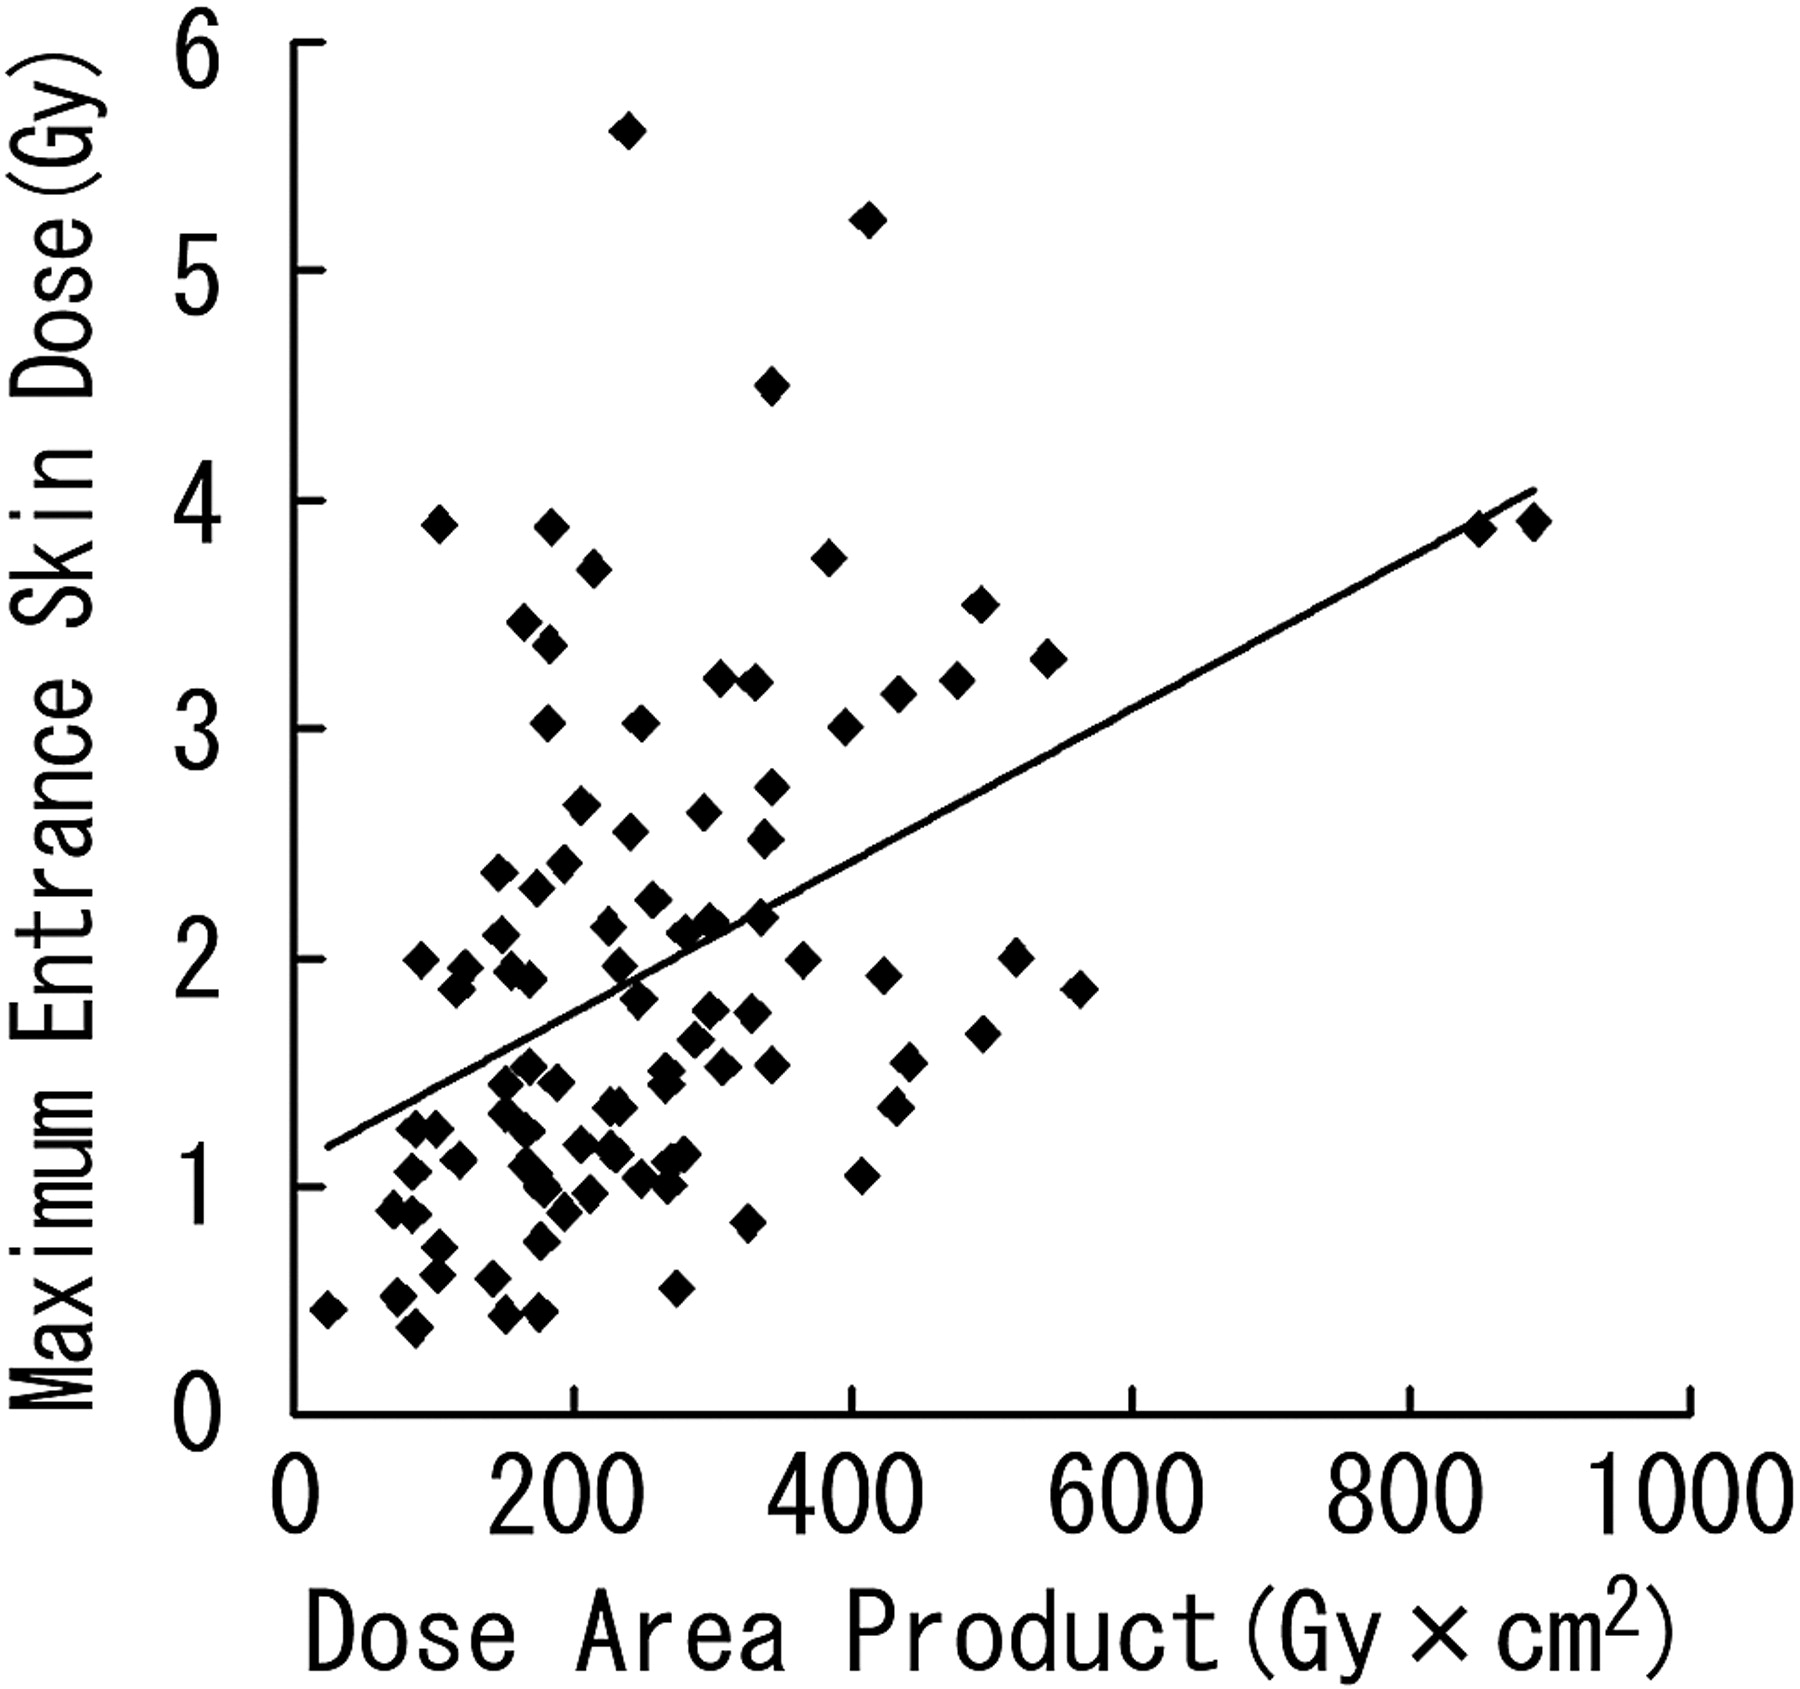
Linear regression demonstrated a significant correlation between DAP and the maximum ESD (r = 0.445; P < .0001; maximum ESD [Gy] = 1.100 + 0.003 × DAP [Gy × cm2]; Fig 4). However, there was wide variation among individual instances.

Scatterplot of DAP and maximum ESD with regression line.
Follow-Up to Check for Effects on the Skin
Radiation skin injuries, namely, epilation corresponding with the most exposed area, were observed in 6 patients (Table 5; Fig 5). Epilation was observed in both of the patients, with the maximum ESD exceeding 5 Gy. Among the 18 patients with the maximum ESD of 3–5 Gy, 16 patients were followed up clinically, with epilation observed in 3 of them. In 1 patient with a maximum ESD of 2.7 Gy, epilation was observed at 3 months of follow-up.

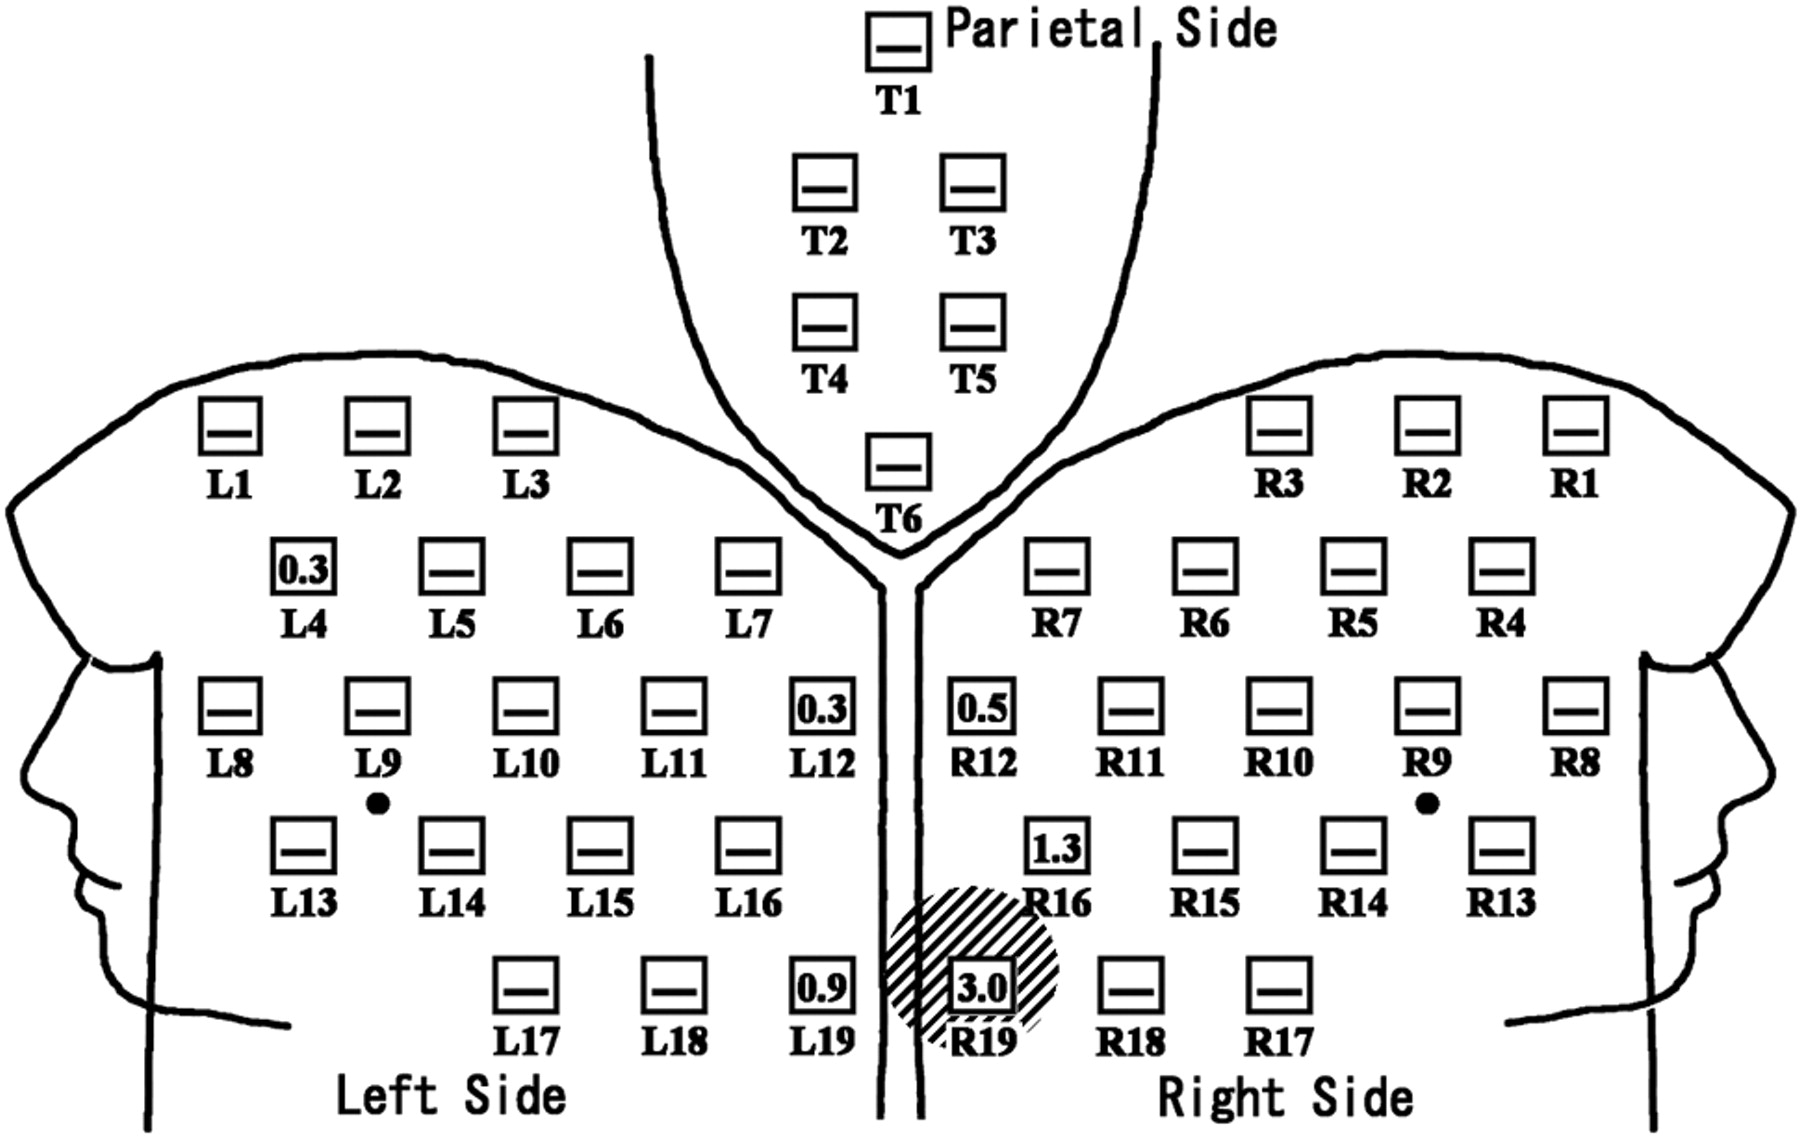
Distribution of ESDs in a patient with radiation skin injury. Neuroembolization for internal carotid-posterior communicating aneurysm was performed for a 43-year-old woman. The FOV mainly used was 14 cm. Total fluoroscopic time and DAP were 75.0 minutes and 182 Gy × cm2, respectively; 4° left anterior oblique with 17° cranial angulation view was mostly used. Exposed skin area was localized to the occipital region with the maximum ESD of 3.0 Gy. Temporary epilation was detected at the maximum exposure part (slanted lines) at 2 weeks and 3 months of follow-up. The number in the open square represents the ESD (Gy) at the point. — in the open square means the ESD at the point was less than 0.3 Gy.
Six cases of radiation-induced epilation at the most exposed area
Discussion
In acute irradiation, the thresholds of early transient erythema, temporary epilation, permanent epilation, and delayed dermal necrosis are 2, 3, 7, and 12 Gy, respectively.14,15 The International Commission on Radiologic Protection has recommended that the maximum skin dose and its location be recorded for interventional procedures with the maximum cumulative skin dose of 3 Gy or more (≥1 Gy in repeatable cases).15 The Food and Drug Administration has listed vascular embolization as one of the procedures for which interventionalists should be aware of the potential for serious radiation-induced skin injury.16 It has been recommended that radiation dose information be reported for vascular embolization procedures, too.17
In this study, the maximum ESDs exceeded 3 Gy in 20 procedures, and epilation was observed in 6 patients. Therefore, it is desirable to estimate the patient ESDs in individual neuroembolizations. If the maximum ESD is 3 Gy or above, the patient should be followed up for 10–14 days after the procedure and informed of the possible symptoms and signs.15
We compared the patient skin doses during neuroembolization in the literature2,5,6,18–21 (Table 6). Mooney and Flynn18 reported that a new angiographic unit delivered less maximum ESDs (0.5 Gy) with refined additional spectral filtration and improved resolution compared with an old unit (2.2 Gy). This may be the reason why the maximum ESD reported by Kuwayama et al2 in 1994 was higher compared with the doses in the recent reports. The maximum ESDs in the reports with thermoluminescent dosimeters (TLDs) tend to be lower than the doses determined by other methods of dosimetry. As will be described later, dosimetry with TLD is likely to underestimate the maximum ESDs due to the restricted measurement points. On the other hand, this type of underestimation does not occur in the calculation of ESD by an on-line computer system, such as CareGraph19 or PEMNET.5 Our results are consistent with the results of O'Dea et al5 and Miller et al19 by using the on-line computer system. Also in their reports, the maximum ESDs during neuroembolization were approximately 2 Gy. There were differences in the maximum ESDs among institutions. The average maximum ESD in one institution was approximately 2.5-fold of that in another. The maximum ESDs can be affected by differences in the degree of difficulty of the target lesion, types of angiographic unit, modes of fluoroscopy and image acquisition, and techniques used for reduction of patient exposure. Therefore, interventionalists should estimate the patients' maximum ESDs during the neuroembolizations in individual institutions. If the maximum ESDs during the procedures are high, the causes should be investigated and dealt with. Interventionists should, in cooperation with medical physicists, establish the nominal doses (or usual range of doses) for the procedures that they commonly perform.15
Data of patient's maximum skin dose (ESD) during neuroembolization in the literature
The optimal methods to estimate ESD at various skin sites during interventional radiology have not been established. The ESDs at several points can be estimated by placing the radiometer, such as the TLD, on the patient surface.2,6,18,20,21 However, the process of dosimetry usually takes time, and real-time information about the skin dose is not available. In addition, the measurable area is generally restricted and cannot necessarily estimate the dose of the maximally exposed part. Another method is to calculate ESDs by using the DAP meter.22 However, in neuroembolization, the x-ray beam can enter the patients in many directions, and it is not easy to evaluate the patients' maximum ESD and its location with the DAP meter. In the study by Miller et al,19 there was a good correlation between them (Pearson r = 0.848; P < .000001). However, they found wide variation among individual instances, especially at high doses, in their evaluation of the relationship between the maximum ESD and DAP. Therefore, they stated that predictions of the maximum ESD from regression equation for DAP are imprecise. Also in this study, we found variation among individual instances in the evaluation of the relationship between the maximum ESD and DAP, though there was a significant correlation between them.
Calculation of ESD by on-line computer system without DAP meter is also available for estimation of patient's ESD.5 However, the displayed ESD by this system also does not represent the maximum ESD when the beam angulations are changed during the procedure. Miller et al19 used a system that automatically measures patients' skin doses by use of the geometric settings of the gantry, investigation table, x-ray beam, and an ionization chamber. It allows calculation of the accumulated skin radiation dose and detection of the high-dose area in real time. However, the system needs to be installed in individual angiographic equipment and can be used only in limited institutions. Furthermore, the system is no longer offered for sale on new equipment.23
The dosimetry with radiosensitive indicators gives real-time information about the skin dose distribution during neuroembolizations, when the color of the indicators is compared with a color sample visually.24 Real-time information about the skin dose will enable interventionalists to change the beam angulations before the dose exceeds the thresholds for severe radiation skin injury. Dosimetry with radiosensitive indicators is also useful to reduce the cumulative skin dose in the same area during repeated procedures.24 In the case of high-dose exposure during previous procedures, interventionalists can reduce the cumulative skin dose by marking the part on the cap with a radiopaque material and excluding the marker from the irradiation field. The measurement errors in the dosimetry with radiosensitive indicators have not been adequately assessed. Dosimetries are generally affected by such factors as tube voltage, filtration level, and dose rate of the angiographic units. However, this study showed little effect of these factors on the dosimetry with radiosensitive indicators (Fig 2). In addition, Suzuki et al24 reported that ESDs estimated by TLD and the doses by indicators correlated well (r2 = 0.9679; P < .0001). Therefore, we think that the measurement error will not be significant for the practical dose evaluation.
This study has some limitations. We selected institutions at which neuroembolization is performed frequently, which might have biased the results. Further studies are required in many institutions.
In conclusion, the maximum ESDs during neuroembolization exceed the thresholds for radiation skin injuries in some cases. Therefore, the patients' ESDs at multiple points should be estimated to reduce the doses.
Footnotes
This study was partially supported by Grant-in-Aid for Scientific Research from Japan Society for the Promotion of Science, Tokyo, Japan.
References
- Received November 24, 2007.
- Accepted after revision May 15, 2008.
- Copyright © American Society of Neuroradiology
In this issue


Jump to section
Related Articles
Cited By...
- Image Quality of Low-Dose Cerebral Angiography and Effectiveness of Clinical Implementation on Diagnostic and Neurointerventional Procedures for Intracranial Aneurysms
- Patient Radiation Dose Management in the Follow-Up of Potential Skin Injuries in Neuroradiology
- Guideline for Radiation Safety
- Cumulative Radiation Dose in Patients Admitted with Subarachnoid Hemorrhage: A Prospective Study Using a Self-Developing Film Badge
- Advances in Interventional Neuroradiology