Advertisement

Main menu

  • Home
  • Content
    • Current Issue
    • Accepted Manuscripts
    • Article Preview
    • Past Issue Archive
    • AJNR Case Collection
    • Case of the Week Archive
    • Classic Case Archive
    • Case of the Month Archive
  • Special Collections
    • Spinal CSF Leak Articles (Jan 2020-June 2024)
    • 2024 AJNR Journal Awards
    • Most Impactful AJNR Articles
  • Multimedia
    • AJNR Podcast
    • AJNR Scantastics
    • Video Articles
  • For Authors
    • Submit a Manuscript
    • Author Policies
    • Fast publishing of Accepted Manuscripts
    • Graphical Abstract Preparation
    • Manuscript Submission Guidelines
    • Imaging Protocol Submission
    • Submit a Case for the Case Collection
  • About Us
    • About AJNR
    • Editorial Board
  • More
    • Become a Reviewer/Academy of Reviewers
    • Subscribers
    • Permissions
    • Alerts
    • Feedback
    • Advertisers
    • ASNR Home
  • Other Publications
    • ajnr

User menu

  • Alerts
  • Log in

Search

  • Advanced search
American Journal of Neuroradiology

American Journal of Neuroradiology

ASHNR American Society of Functional Neuroradiology ASHNR American Society of Pediatric Neuroradiology ASSR
  • Alerts
  • Log in

Advanced Search

  • Home
  • Content
    • Current Issue
    • Accepted Manuscripts
    • Article Preview
    • Past Issue Archive
    • AJNR Case Collection
    • Case of the Week Archive
    • Classic Case Archive
    • Case of the Month Archive
  • Special Collections
    • Spinal CSF Leak Articles (Jan 2020-June 2024)
    • 2024 AJNR Journal Awards
    • Most Impactful AJNR Articles
  • Multimedia
    • AJNR Podcast
    • AJNR Scantastics
    • Video Articles
  • For Authors
    • Submit a Manuscript
    • Author Policies
    • Fast publishing of Accepted Manuscripts
    • Graphical Abstract Preparation
    • Manuscript Submission Guidelines
    • Imaging Protocol Submission
    • Submit a Case for the Case Collection
  • About Us
    • About AJNR
    • Editorial Board
  • More
    • Become a Reviewer/Academy of Reviewers
    • Subscribers
    • Permissions
    • Alerts
    • Feedback
    • Advertisers
    • ASNR Home
  • Follow AJNR on Twitter
  • Visit AJNR on Facebook
  • Follow AJNR on Instagram
  • Join AJNR on LinkedIn
  • RSS Feeds

Welcome to the new AJNR, Updated Hall of Fame, and more. Read the full announcements.


AJNR is seeking candidates for the position of Associate Section Editor, AJNR Case Collection. Read the full announcement.


Research ArticleBRAIN

Morphometric Changes in the Episodic Memory Network and Tau Pathologic Features Correlate with Memory Performance in Patients with Mild Cognitive Impairment

A.M. Fjell, K.B. Walhovd, I. Amlien, A. Bjørnerud, I. Reinvang, L. Gjerstad, T. Cappelen, F. Willoch, P. Due-Tønnessen, R. Grambaite, A. Skinningsrud, V. Stenset and T. Fladby
American Journal of Neuroradiology June 2008, 29 (6) 1183-1189; DOI: https://doi.org/10.3174/ajnr.A1059
A.M. Fjell
  • Find this author on Google Scholar
  • Find this author on PubMed
  • Search for this author on this site
K.B. Walhovd
  • Find this author on Google Scholar
  • Find this author on PubMed
  • Search for this author on this site
I. Amlien
  • Find this author on Google Scholar
  • Find this author on PubMed
  • Search for this author on this site
A. Bjørnerud
  • Find this author on Google Scholar
  • Find this author on PubMed
  • Search for this author on this site
I. Reinvang
  • Find this author on Google Scholar
  • Find this author on PubMed
  • Search for this author on this site
L. Gjerstad
  • Find this author on Google Scholar
  • Find this author on PubMed
  • Search for this author on this site
T. Cappelen
  • Find this author on Google Scholar
  • Find this author on PubMed
  • Search for this author on this site
F. Willoch
  • Find this author on Google Scholar
  • Find this author on PubMed
  • Search for this author on this site
P. Due-Tønnessen
  • Find this author on Google Scholar
  • Find this author on PubMed
  • Search for this author on this site
R. Grambaite
  • Find this author on Google Scholar
  • Find this author on PubMed
  • Search for this author on this site
A. Skinningsrud
  • Find this author on Google Scholar
  • Find this author on PubMed
  • Search for this author on this site
V. Stenset
  • Find this author on Google Scholar
  • Find this author on PubMed
  • Search for this author on this site
T. Fladby
  • Find this author on Google Scholar
  • Find this author on PubMed
  • Search for this author on this site
  • Article
  • Figures & Data
  • Info & Metrics
  • Responses
  • References
  • PDF
Loading

Article Figures & Data

Figures

  • Tables
  • Fig 1.
    • Download figure
    • Open in new tab
    • Download powerpoint
    Fig 1.

    Hippocampal volume in patients with MCI versus controls. Hippocampal volume is calculated as the total volume of the right and left hippocampus and regressed on ICV. The standardized residuals are shown on the y-axis (z-scores). The patients are grouped according to whether they have pathologic (MCI pat CSF) or nonpathologic (MCI no CSF) values of tau or Aβ42. The blue-dotted lines indicate the mean value for each group. Independent samples t tests (Bonferroni corrected for multiple comparisons) showed that the patients with pathologic CSF biomarkers had significantly smaller hippocampal volume than the controls, whereas the other contrasts did not reach significance.

  • Fig 2.
    • Download figure
    • Open in new tab
    • Download powerpoint
    Fig 2.

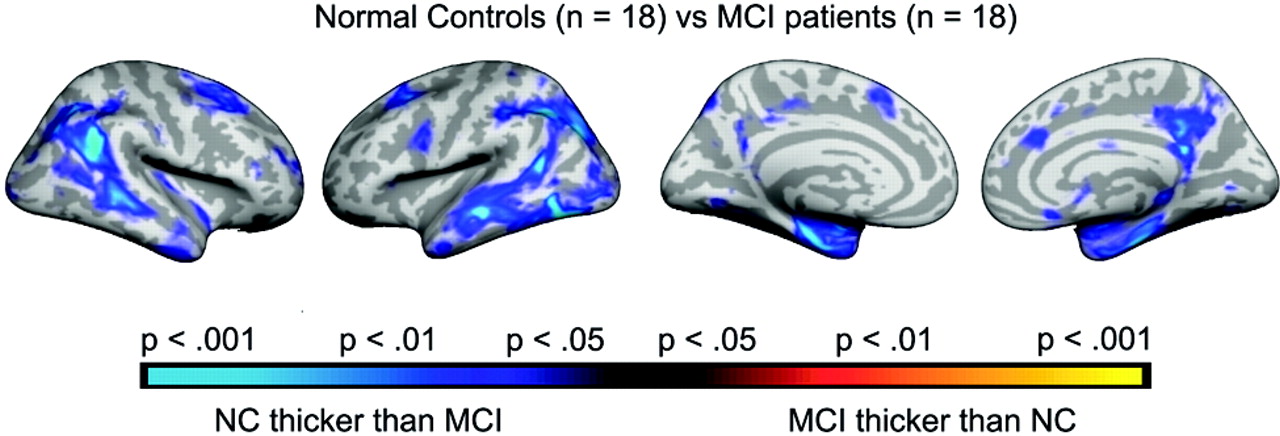
    Effects of diagnosis on cortical thickness. Points where patients with MCI have a significantly thinner cortex than normal controls are color coded as blue-green, whereas points showing the opposite pattern are coded as red-yellow. The P maps are projected onto the inflated mean brain of the total sample. From left to right is shown the right and left lateral view, and left and right medial view, respectively.

  • Fig 3.
    • Download figure
    • Open in new tab
    • Download powerpoint
    Fig 3.

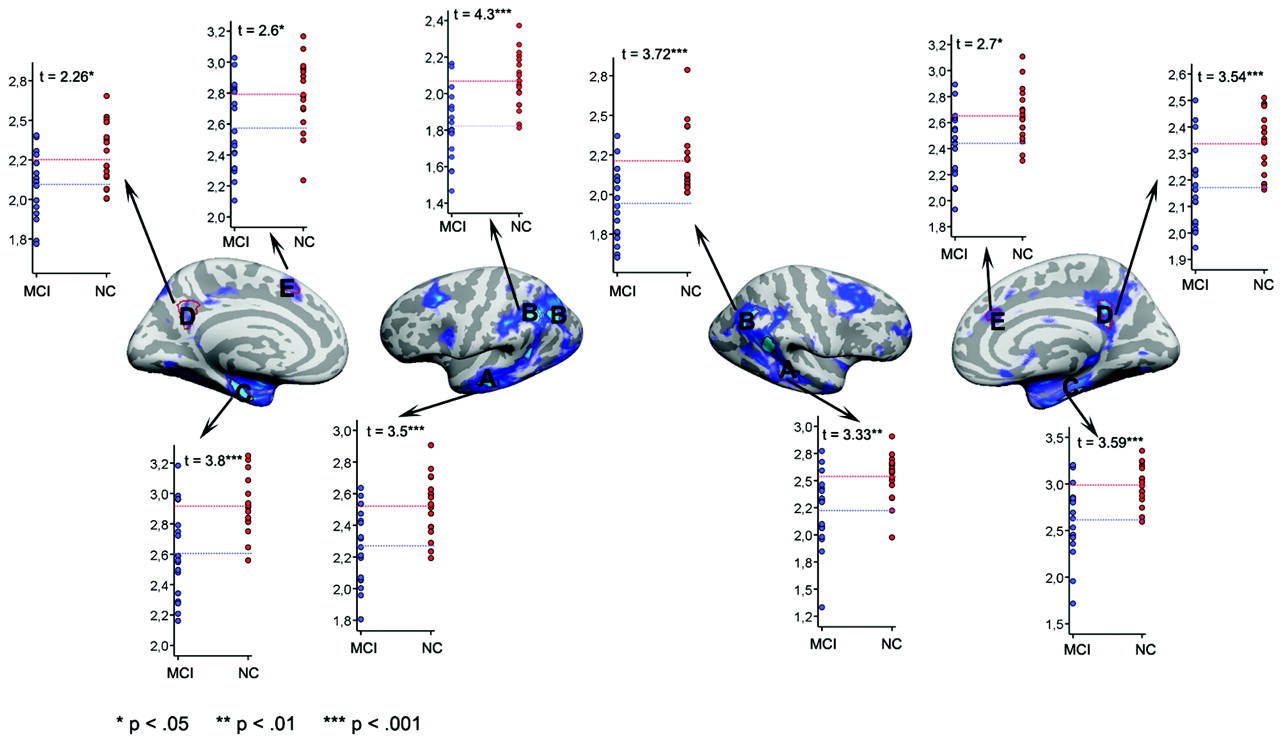
    Scatterplots of cortical thickness in patients versus controls. ROIs were chosen on the basis of the results from the cortical thickness comparisons. The ROIs are defined by the red lines. Mean thickness for each participant within each ROI was calculated.

  • Fig 4.
    • Download figure
    • Open in new tab
    • Download powerpoint
    Fig 4.

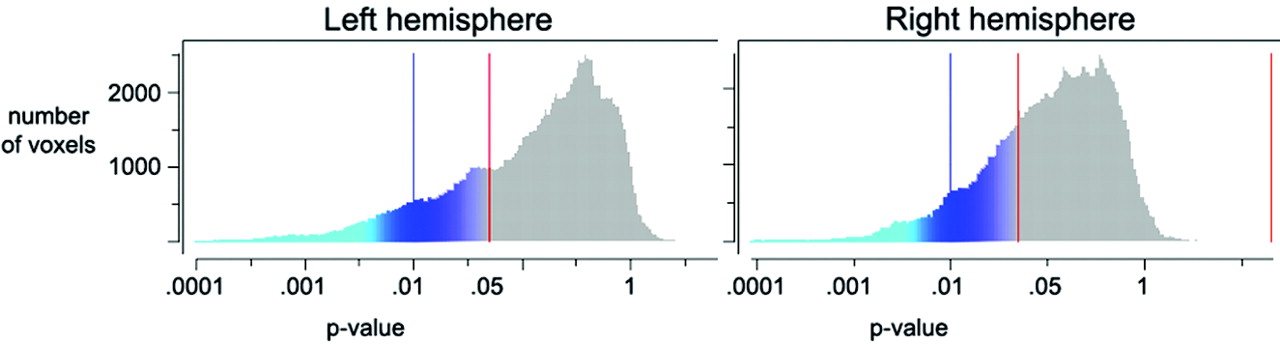
    Distribution of P values. This figure shows the number of voxels for any given P value from the cortical comparisons illustrated in Fig 2. The left side of each chart (blue-green colors) represents a thicker cortex in healthy controls; the right side (red-yellow colors) represents a thicker cortex in the patients. As can be seen, the distribution of P values is shifted to the left, with almost no voxels to the right of the midline (indicating thicker cortex for patients). This shows clearly that the patients have a thinner cortex than the healthy controls and that it is very unlikely that this is a result of false-positives from multiple statistical comparisons.
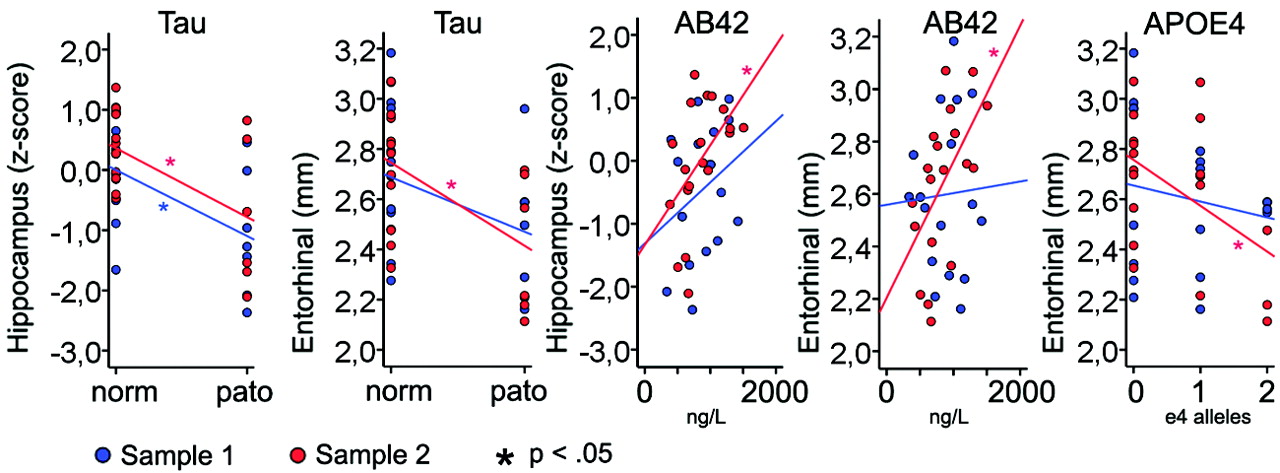
  • Fig 5.
    • Download figure
    • Open in new tab
    • Download powerpoint
    Fig 5.

    Relationships between tau pathologic features and brain morphometry. Hippocampal volume and mean thickness in left hemisphere entorhinal ROI compared across groups of pathologic (pato) versus nonpathologic (norm) T-tau or P-tau values.

  • Fig 6.
    • Download figure
    • Open in new tab
    • Download powerpoint
    Fig 6.

    Relationships between cortical thickness and episodic memory. Hippocampal volume/mean thickness in left hemisphere ROIs from Fig 3 and RAVLT learning and 30 minutes delayed recall score. The y-axes depict the number of words recalled, whereas the x-axes depict thickness or ICV-corrected volume.

Tables

  • Figures
    • View popup
    Table 1:

    Sample characteristics*

    ControlsMCI Sample 1MCI Sample 2P
    (SD)(SD)(SD)
    N181819
    Women/Men7/117/1110/9.63
    Age (43–77 y)63.7 (6.3)61.6 (9.0)61.8 (7.1).66
    Education10.8 (2.7)13.1 (3.3)11.6 (2.7).06
    GDSNA2.94 (0.24)2.95 (0.23).97
    MMSE (23–30)NA27.4 (1.9)27.9 (1.7).47
    Symptom durationNA2.11 (1.40)2.98 (1.57).95
    • Note:—MCI indicates mild cognitive impairment; GDS, Global Deterioration Scale; MMSE, Mini-Mental State Examination.

    • * The Pvalues are from an ANOVA with a group factor of 3 levels. Post hoc analyses confirmed that none of the contrast between the groups was significant. The MMSE was not administered to the controls. SD is presented in parentheses where relevant.

    • View popup
    Table 2:

    CSF markers and APOE status in the MCI groups

    MCI Sample 1MCI Sample 2P
    NN
    Aβ42 (pathologic/not pathologic)3/143/16.89
    Tau (pathologic/not pathologic)7/106/13.56
    Any CSF pathologic features (pathologic/not pathologic)8/97/12.55
    APOE ε4 alleles (0/1/2)8/6/410/6/3.58
    • Note:—MCI indicates mild cognitive impairment; Aβ42, amyloid beta 42 peptide; APOE ε4, apolipoprotein E.

    • P denotes the P values from an independent samples t test.

    • View popup
    Table 3:

    Effects of CSF biomarkers and APOE on brain morphometry*

    TauAβ42APOE
    FRF
    S1S2S1S2S1S2
    Hippocampus5.90†‡7.86†.30.51†‡0.043.19
    A: Middle temporal LH5.57†0.00.20.111.240.16
    B: Inferior parietal LH1.5016.67†‡−.04.110.872.60
    C: Entorhinal LH2.327.35†.05.57†‡0.424.39†
    D: Precuneus (toward isthmus) LH1.421.06−.16.51†‡0.982.99
    E: Superior frontal LH3.411.72−.08.240.061.93
    A: Middle temporal RH1.060.77−.19.270.081.47
    B: Inferior parietal RH2.2410.30†‡−.11.290.760.90
    C: Entorhinal RH1.3511.32†‡−.19.230.273.62†
    D: Precuneus (toward isthmus) RH0.503.80−.25.59†‡1.153.85†
    E: Superior frontal RH0.000.31−.06.110.511.24
    • Note:—S1 indicates Sample 1; S2, Sample 2; LH, left hemisphere; RH, right hemisphere; Aβ42, amyloid beta 42 peptide; APOE, apolipoprotein E; F, F-ratio; R, Pearson r.

    • * The effects of the APOE genotype and pathologic values of CSF biomarkers tau and Aβ42 on the morphometry (thickness or volume) of the brain in regions that are significantly different between healthy controls and patients with MCI. Because only 3 participants had pathologic Aβ42 values in each sample, the absolute Aβ42 values were used instead of cutoff values, and the relationships were tested with Pearson correlations. In the rest of the analyses, ANOVA was used. Hippocampus is the sum of the left and right hippocampus, regressed on intracranial volume, and the residuals are used in the analyses. The capital letters refer to the cortical ROI from Fig 3.

    • † P < .05.

    • ‡ P < .05 when the effect of age is controlled for.

    • View popup
    Table 4:

    Correlations between biomarkers and episodic memory

    RAVLT Learning*RAVLT 30 Minutes’ Recall
    RR
    S1S2S1S2
    Hippocampus.49§.70†‡.35.71†‡
    A: Middle temporal LH.51†.38.33.22
    B: Inferior parietal LH.67†.44§.48‡.53†
    C: Entorhinal LH.66†.64†‡.46.64†‡
    D: Precuneus (toward isthmus) LH.50†.48†.15.44†
    E: Superior frontal LH.43.42.24.38
    A: Middle temporal RH.49§.34.16.39†
    B: Inferior parietal RH.56†.49†.53†.60†
    C: Entorhinal RH.35.50†.23.53†
    D: Precuneus (toward isthmus) RH.28.54†.04.54†
    E: Superior frontal RH.38.36.29.22
    Tau−.28−.60†−.09−.73†‡
    Aβ42.09.42.33.35
    APOE−.09−.17−.34−.18
    • Note:—S1 indicates Sample 1; S2, Sample 2; RAVLT, Rey Auditory-Verbal Test; APOE, apolipoprotein E; Aβ42; amyloid beta 42 peptide; LH, left hemisphere; RH, right hemisphere; R, Pearson r.

    • * RAVLT learning is the sum of correct responses across learning trials 1 to 5. APOE is quantified as the number of ε4 alleles (0, 1, or 2). For tau, cutoff criteria are used in the analyses (0 for nonpathologic, 1 for pathologic), whereas for Aβ42 the actual values are used because only 2 participants in Sample 1 had pathologic values.

    • † P < .05.

    • ‡ P < .05 when the effect of age is controlled for.

    • § P < .06.

PreviousNext
Back to top

In this issue

American Journal of Neuroradiology: 29 (6)
American Journal of Neuroradiology
Vol. 29, Issue 6
June 2008
  • Table of Contents
  • Index by author
Advertisement
Print
Download PDF
Email Article

Thank you for your interest in spreading the word on American Journal of Neuroradiology.

NOTE: We only request your email address so that the person you are recommending the page to knows that you wanted them to see it, and that it is not junk mail. We do not capture any email address.

Enter multiple addresses on separate lines or separate them with commas.
Morphometric Changes in the Episodic Memory Network and Tau Pathologic Features Correlate with Memory Performance in Patients with Mild Cognitive Impairment
(Your Name) has sent you a message from American Journal of Neuroradiology
(Your Name) thought you would like to see the American Journal of Neuroradiology web site.
CAPTCHA
This question is for testing whether or not you are a human visitor and to prevent automated spam submissions.
Cite this article
A.M. Fjell, K.B. Walhovd, I. Amlien, A. Bjørnerud, I. Reinvang, L. Gjerstad, T. Cappelen, F. Willoch, P. Due-Tønnessen, R. Grambaite, A. Skinningsrud, V. Stenset, T. Fladby
Morphometric Changes in the Episodic Memory Network and Tau Pathologic Features Correlate with Memory Performance in Patients with Mild Cognitive Impairment
American Journal of Neuroradiology Jun 2008, 29 (6) 1183-1189; DOI: 10.3174/ajnr.A1059

Citation Manager Formats

  • BibTeX
  • Bookends
  • EasyBib
  • EndNote (tagged)
  • EndNote 8 (xml)
  • Medlars
  • Mendeley
  • Papers
  • RefWorks Tagged
  • Ref Manager
  • RIS
  • Zotero
0 Responses
Respond to this article
Share
Bookmark this article
Morphometric Changes in the Episodic Memory Network and Tau Pathologic Features Correlate with Memory Performance in Patients with Mild Cognitive Impairment
A.M. Fjell, K.B. Walhovd, I. Amlien, A. Bjørnerud, I. Reinvang, L. Gjerstad, T. Cappelen, F. Willoch, P. Due-Tønnessen, R. Grambaite, A. Skinningsrud, V. Stenset, T. Fladby
American Journal of Neuroradiology Jun 2008, 29 (6) 1183-1189; DOI: 10.3174/ajnr.A1059
del.icio.us logo Twitter logo Facebook logo Mendeley logo
  • Tweet Widget
  • Facebook Like
  • Google Plus One
Purchase

Jump to section

  • Article
    • Abstract
    • Methods
    • Results
    • Discussion
    • Conclusion
    • Footnotes
    • References
  • Figures & Data
  • Info & Metrics
  • Responses
  • References
  • PDF

Related Articles

  • No related articles found.
  • PubMed
  • Google Scholar

Cited By...

  • White matter integrity and cognition in Parkinson's disease: a cross-sectional study
  • Biomarker validation of a cued recall memory deficit in prodromal Alzheimer disease
  • CSF Biomarkers in Prediction of Cerebral and Clinical Change in Mild Cognitive Impairment and Alzheimer's Disease
  • Combining MR Imaging, Positron-Emission Tomography, and CSF Biomarkers in the Diagnosis and Prognosis of Alzheimer Disease
  • One-Year Brain Atrophy Evident in Healthy Aging
  • Minute Effects of Sex on the Aging Brain: A Multisample Magnetic Resonance Imaging Study of Healthy Aging and Alzheimer's Disease
  • Crossref (42)
  • Google Scholar

This article has been cited by the following articles in journals that are participating in Crossref Cited-by Linking.

  • Structural Brain Changes in Aging: Courses, Causes and Cognitive Consequences
    Anders M. Fjell, Kristine B. Walhovd
    Reviews in the Neurosciences 2010 21 3
  • One-Year Brain Atrophy Evident in Healthy Aging
    Anders M. Fjell, Kristine B. Walhovd, Christine Fennema-Notestine, Linda K. McEvoy, Donald J. Hagler, Dominic Holland, James B. Brewer, Anders M. Dale
    The Journal of Neuroscience 2009 29 48
  • Development and assessment of a composite score for memory in the Alzheimer’s Disease Neuroimaging Initiative (ADNI)
    Paul K. Crane, Adam Carle, Laura E. Gibbons, Philip Insel, R. Scott Mackin, Alden Gross, Richard N. Jones, Shubhabrata Mukherjee, S. McKay Curtis, Danielle Harvey, Michael Weiner, Dan Mungas
    Brain Imaging and Behavior 2012 6 4
  • MRI of hippocampal volume loss in early Alzheimer&#039;s disease in relation to ApoE genotype and biomarkers
    N. Schuff, N. Woerner, L. Boreta, T. Kornfield, L. M. Shaw, J. Q. Trojanowski, P. M. Thompson, C. R. Jack, M. W. Weiner
    Brain 2008 132 4
  • Combining MR Imaging, Positron-Emission Tomography, and CSF Biomarkers in the Diagnosis and Prognosis of Alzheimer Disease
    K.B. Walhovd, A.M. Fjell, J. Brewer, L.K. McEvoy, C. Fennema-Notestine, D.J. Hagler, R.G. Jennings, D. Karow, A.M. Dale
    American Journal of Neuroradiology 2010 31 2
  • CSF Biomarkers in Prediction of Cerebral and Clinical Change in Mild Cognitive Impairment and Alzheimer&#039;s Disease
    Anders M. Fjell, Kristine B. Walhovd, Christine Fennema-Notestine, Linda K. McEvoy, Donald J. Hagler, Dominic Holland, James B. Brewer, Anders M. Dale
    The Journal of Neuroscience 2010 30 6
  • Biomarker validation of a cued recall memory deficit in prodromal Alzheimer disease
    M. Wagner, S. Wolf, F.M. Reischies, M. Daerr, S. Wolfsgruber, F. Jessen, J. Popp, W. Maier, M. Hüll, L. Frölich, H. Hampel, R. Perneczky, O. Peters, H. Jahn, C. Luckhaus, H.-J. Gertz, J. Schröder, J. Pantel, P. Lewczuk, J. Kornhuber, J. Wiltfang
    Neurology 2012 78 6
  • Voxel-based morphometry in Alzheimer’s disease
    Geraldo F Busatto, Breno S Diniz, Marcus V Zanetti
    Expert Review of Neurotherapeutics 2008 8 11
  • Increased sensitivity to effects of normal aging and Alzheimer&#039;s disease on cortical thickness by adjustment for local variability in gray/white contrast: A multi-sample MRI study
    Lars T. Westlye, Kristine B. Walhovd, Anders M. Dale, Thomas Espeseth, Ivar Reinvang, Naftali Raz, Ingrid Agartz, Douglas N. Greve, Bruce Fischl, Anders M. Fjell
    NeuroImage 2009 47 4
  • Cognitive Correlates of Basal Forebrain Atrophy and Associated Cortical Hypometabolism in Mild Cognitive Impairment
    Michel J. Grothe, Helmut Heinsen, Edson Amaro, Lea T. Grinberg, Stefan J. Teipel
    Cerebral Cortex 2016 26 6

More in this TOC Section

  • Optimal MRI Sequence for Identifying Occlusion Location in Acute Stroke: Which Value of Time-Resolved Contrast-Enhanced MRA?
  • SWI or T2*: Which MRI Sequence to Use in the Detection of Cerebral Microbleeds? The Karolinska Imaging Dementia Study
  • Progression of Microstructural Damage in Spinocerebellar Ataxia Type 2: A Longitudinal DTI Study
Show more Brain

Similar Articles

Advertisement

Indexed Content

  • Current Issue
  • Accepted Manuscripts
  • Article Preview
  • Past Issues
  • Editorials
  • Editors Choice
  • Fellow Journal Club
  • Letters to the Editor

Cases

  • Case Collection
  • Archive - Case of the Week
  • Archive - Case of the Month
  • Archive - Classic Case

Special Collections

  • Special Collections

Resources

  • News and Updates
  • Turn around Times
  • Submit a Manuscript
  • Author Policies
  • Manuscript Submission Guidelines
  • Evidence-Based Medicine Level Guide
  • Publishing Checklists
  • Graphical Abstract Preparation
  • Imaging Protocol Submission
  • Submit a Case
  • Become a Reviewer/Academy of Reviewers
  • Get Peer Review Credit from Publons

Multimedia

  • AJNR Podcast
  • AJNR SCANtastic
  • Video Articles

About Us

  • About AJNR
  • Editorial Board
  • Not an AJNR Subscriber? Join Now
  • Alerts
  • Feedback
  • Advertise with us
  • Librarian Resources
  • Permissions
  • Terms and Conditions

American Society of Neuroradiology

  • Not an ASNR Member? Join Now

© 2025 by the American Society of Neuroradiology All rights, including for text and data mining, AI training, and similar technologies, are reserved.
Print ISSN: 0195-6108 Online ISSN: 1936-959X

Powered by HighWire