
Abstract
BACKGROUND AND PURPOSE: Despite the prominent peak of N-acetylaspartate (NAA) in proton MR spectroscopy (1H-MR spectroscopy) of the adult brain and its almost exclusive presence in neuronal cells, the total amount of NAA, regarded as their marker, is difficult to obtain due to signal contamination from the skull lipids. This article compares the performance of 2 methods that overcome this difficulty to yield the whole-brain NAA signal, important for the assessment of the total disease load in diffuse neurologic disorders.
MATERIALS AND METHODS: The heads of 12 healthy volunteers, 3 women and 9 men, 31.0 ± 7.1 years of age, were scanned at 3T by using 2 nonlocalizing 1H-MR spectroscopy sequences: One nulls the NAA (TI = 940 ms) every second acquisition by inversion-recovery to cancel the signals of the lipids (T1 ≪ TI) in an add-subtract scheme. The other nulls the signal of the lipids (TI = 155 ms) directly after each acquisition, requiring half as many averages for the same signal-to-noise ratio. Each sequence was repeated 3 times back-to-back on 3 occasions, and the comparison criteria were intrasubject precision (reproducibility) and total measurement duration.
RESULTS: NAA nulling is nearly twice as precise in its intrinsic back-to-back (5.8% versus 8.6%) as well as longitudinal (10.6% versus 19.7%) coefficients of variation compared with lipid nulling, but at the cost of double the acquisition time.
CONCLUSION: When speed is a more stringent requirement than precision, the new lipid-nulling sequence is a viable alternative. For precision in cross-sectional or longitudinal global NAA quantification, however, NAA nulling is still the approach of choice despite its ×2 (∼5 minutes) time penalty compared with the lipid-nulling approach.
At up to 0.1% of the brain tissue wet weight, N-acetylaspartate (NAA), first described by Tallan et al,1 is the second most abundant amino acid in the mammalian central nervous system (CNS).2 Its N-acetyl group CH3 proton singlet resonance at 2.02 ppm is the most prominent in proton MR spectroscopy (1H-MR spectroscopy) of the brain in vivo, making quantification straightforward.3,4 Even though the exact role(s) of NAA are still unknown,5 its 1H-MR spectroscopy–derived concentration of NAA in animal brains has correlated with direct quantification by using high-pressure liquid chromatography.6 Because in the adult brain, NAA is almost exclusive to neuronal cells,4,5 NAA has long been considered a putative marker of the density and health in animal and human brains.7
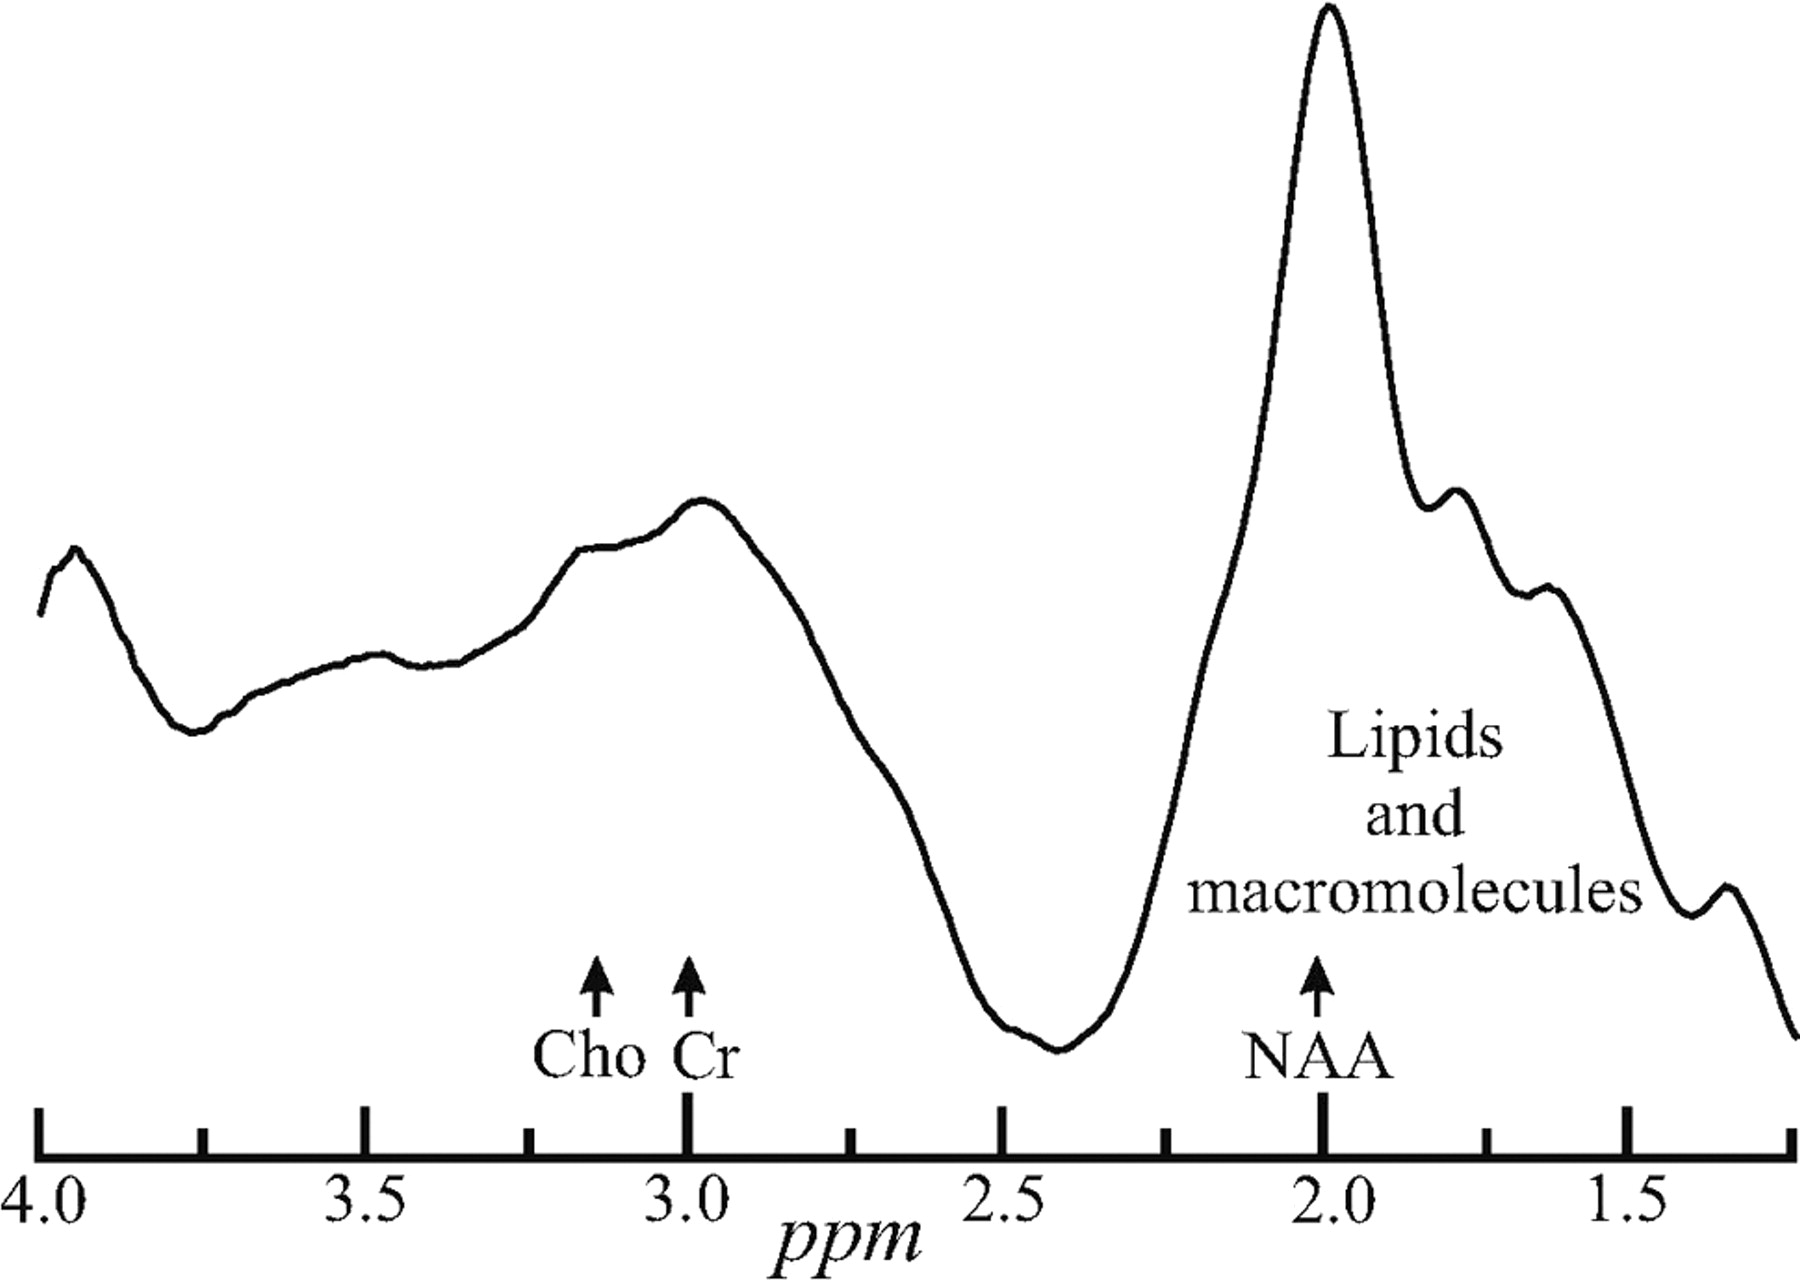
Indeed, of the metabolites identified in brain 1H-MR spectroscopy, none has been more diagnostically valuable than NAA.4 A decline in its regional (or global) concentration has been observed in all focal (and diffuse) CNS disorders,8,9 with the sole exception of Canavan disease.4 Unfortunately, most brain 1H-MR spectroscopy studies to date have used either single-voxel or 2D multivoxel volumes of interest (VOIs). Consequently, the studies need imaging-guidance to MR imaging–visible pathology, rendering them susceptible to misregistration uncertainty in serial studies10 and implicitly assuming that changes occur only at MR imaging–visible abnormalities.11 These studies also preclude 1H-MR spectroscopy near the skull (except for a few sections at a time12,13). The latter is due to contamination of the NAA peak with intense signals from the bone marrow and subcutaneous adipose tissue,14,15 as shown in Fig 1, thereby excluding most of the cortex.16

Whole-head WET (followed by a 13̄31̄ [100-μs rectangular pulses with 2-ms interpulse delays at 3T] for a 90° readout) single-acquisition 1H proton spectrum. Note the extreme lipid contamination from the bone marrow and subcutaneous adipose tissue distorting and obscuring the NAA signal intensity and confounding its quantification. Cho indicates choline; Cr, creatine.
All these concerns are addressed with the nonecho (TE ≈ 0) non-T1-weighted (TR ≪ T1) nonlocalizing MR spectroscopy sequence shown in Fig 2A, which acquires the 1H signal intensity from the whole head.14 Because NAA is restricted to neuronal cells, its signal intensity is implicitly localized to the brain and the lack of explicit localization removes issues of VOI guidance and serial misregistration, making the method attractive to quantify global neuroaxonal injury and to monitor treatment.17 Indeed, the whole-brain NAA method has been applied in several laboratories,18 to quantify global neuronal and axonal injury associated with multiple sclerosis, human immunodeficiency virus (HIV), traumatic brain injury, neurocancers, radiation damage, mild cognitive impairment, and Alzheimer disease, as reviewed recently.9

A, The NAA-nulling sequence comprising a BIR4 adiabatic 180° (every second) acquisition followed by a TI = 940 ms to null the NAA signal intensity. WET and a 13̄31̄ (100-μs rectangular pulses, 2-ms delays at 3T) for a 90° readout with acquisition commencing immediately. Each even transient is subtracted from every odd. Because the TR is long, 10 seconds, and TE ≈ 0, minimal T1 or T2 weighting is incurred by the NAA. B, An alternative approach in which the lipids (not the NAA) are nulled with TI = 155 ms. All other pulses and sequence parameters are shared with A. Note that all pulses in either sequence are non-spatial-selective and that the gradient “blips,” Gx, Gy, and Gz (all 5 mT/m), therefore, are just crushers. RF indicates radio-frequency.
However, due to the 10-second TR required for NAA T1 insensitivity and its need for an even number of acquisitions for an add-subtract editing scheme, measurement with this sequence is relatively long. The additional need to average several acquisitions to improve its precision14 makes for a 10- to 12-minute measurement, which is long in clinical settings. To investigate if it can be shortened, we compared the performance of the established sequence (Fig 2A) with a new variant (Fig 2B) that nulls the lipid (not the NAA) signal and, therefore, needs only 1 (not 2) acquisitions. The comparison criteria are speed and quantification precision (reproducibility).
Materials and Methods
Human Subjects
Twelve healthy volunteers (3 women, 9 men; 31.0 ± 7.1 years of age; range, 24–46 years) were recruited. Their health status was based on negative answers to a questionnaire listing 28 neurologic disorders and known pre-existing MR imaging contraindications before the study and on MR imaging determined by a neuroradiologist to be “unremarkable” afterward. All subjects gave institutional review board–approved written informed consent.
The Whole-Brain NAA Sequences
All experiments were performed in a Trio 3T MR scanner (Siemens, Erlangen, Germany) by using a circularly polarized transmit-receive head coil. After placing each subject into the magnet and obtaining a localizer MR imaging, we adjusted the magnetic field homogeneity over the whole head by using our proton chemical shift imaging–based autoshim procedure.19 It yielded a consistent 27 ± 4 Hz full width at half height whole-head water line width in under 5 minutes. Although this bulk line width is reasonable for such a large (>1 L) volume at 3T, there are regions in the inferior frontal lobe and lateral and inferior temporal lobes known to have much greater line broadening or shifts due to susceptibility differences (eg, near the air-filled sinuses and the auditory canals).20 It has been shown, however, that these 2 signal-intensity-loss mechanisms lead to only a 10 ± 2% underestimation of the total NAA amount in the brain.21 Although other metabolites, particularly macromolecules and other N-acetyl–bearing species, may also resonate at 2.02 ppm,22 their contribution to the peak area is <10%, as described by Baslow.4
Nulling the NAA Signal Intensity
The total amount of NAA in the brain (QNAA) is obtainable by using the nonlocalizing TE/TI/TR = 0/940/104 ms 1H-MR spectroscopy sequence of Fig 2A.14 It relies on lipids much shorter, T1 ≈ 220 ms, than the T1 ≈ 1.4 seconds of NAA23 to null the latter with inversion-recovery every second acquisition14 by using an 8.12-ms adiabatic B1-insensitive rotation (BIR4) 180° pulse in Fig 2A.24 Because the TI = ln2 × T1 NAA nulling delay is longer than 4 × T1 of the lipids, the magnetization of the lipids is at thermal equilibrium at every acquisition, whereas the magnetization of NAA is only thermal in odd (no inversion) acquisitions and null every even (inverted) acquisition. Finally, after water suppression enhanced through T1 effects (WET),25 the longitudinal magnetization is read out with a 13̄31̄ 90° nutation (four 100-μs-long rectangular pulses with 2-ms delays) for additional water and lipid suppression.26 Subtracting even from odd transients destructively interferes with all the signals that arise from short T1 species (lipids and macromolecules) at 2 ppm,22 but not with those signals that arise from the long-T1 metabolites (Fig 3A).

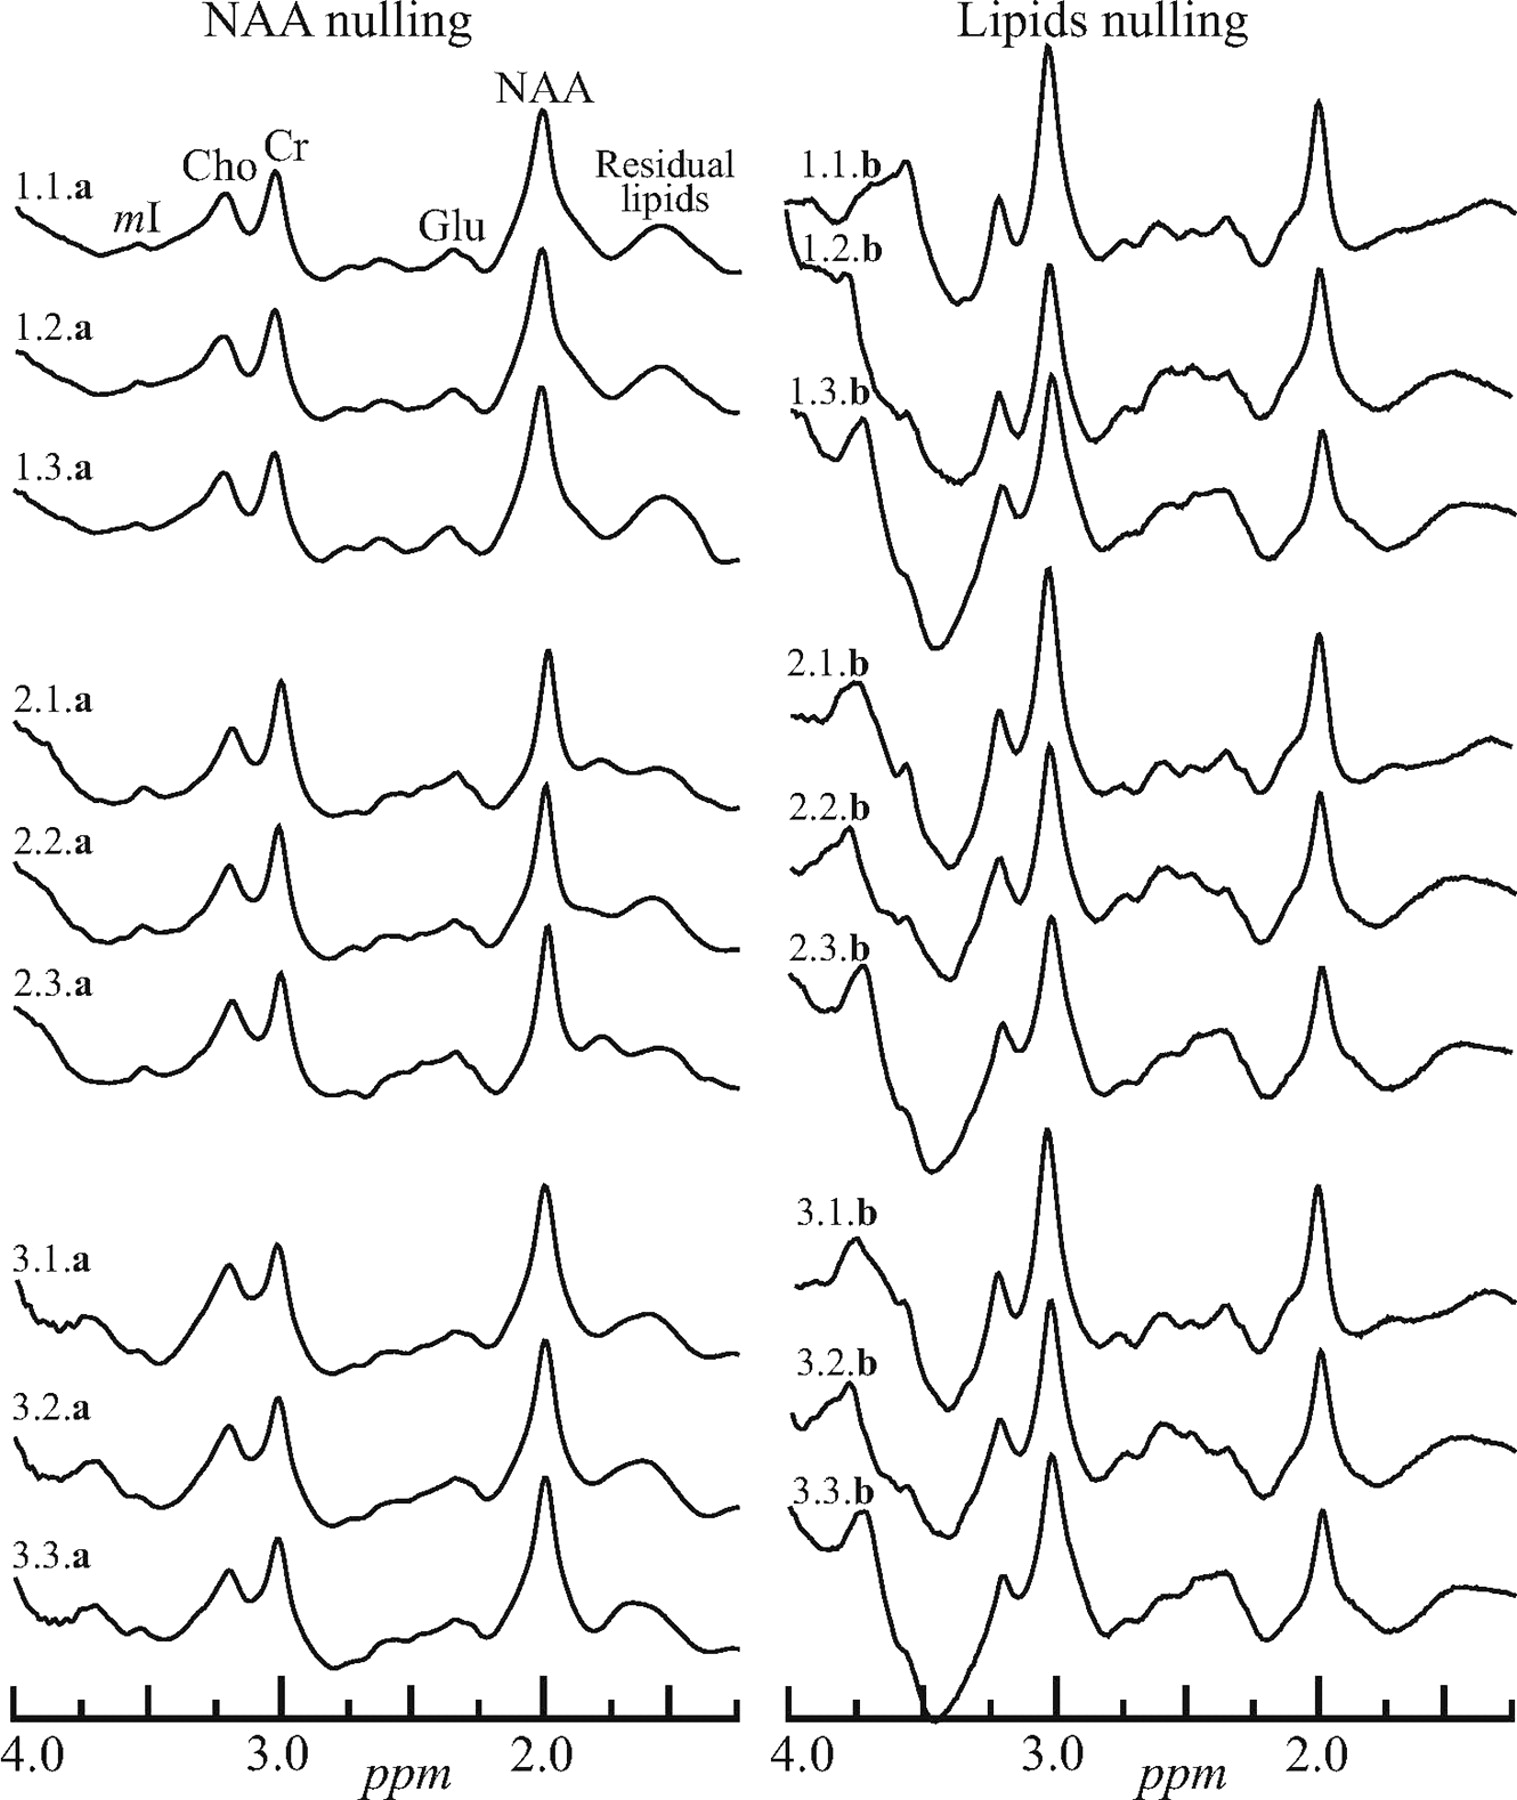
Left, The real part of the whole-head 1H spectra from a male volunteer labeled i.j.a, where “i” (1..3) is the number of the session in the magnet, “j” (1..3) is the number of the back-to-back acquisitions in that session, and a or b indicates the sequence, Fig 2A, -B. Sessions were separated by at least 10 minutes with the subject outside the magnet. Right, Spectra obtained with the same protocol but with the sequence of Fig 2B. Note that both methods yield a whole-brain spectrum, including metabolites other than the NAA. Only the latter, however, is implicitly localized to the brain. mI indicates myo-Inositol; Cho, choline; Cr, creatine; Glu, glutamate.
The main detracting issue with this approach is its requirement for 2 acquisitions to yield 1 NAA-edited 1H spectrum. The 10-second TR and ∼1-second TI leads to a minimum ∼25-second acquisition. In practice, due to the 8 averages used, the measurement is 2.7 minutes long, and several acquisitions are taken back-to-back and averaged to improve the overall precision to the 6% intraindividual coefficient of variation (CV = SD / mean) described in Gonen et al.14
Nulling the Signals of Lipids
An alternative approach to obtain QNAA that does not incur the previous “2-acquisitions-for-1 spectrum” cost is shown in Fig 2B. It is based on the premise that a much shorter TI (155 ms, determined empirically) nulls the signals of lipids sufficiently to leave an undistorted fat-suppressed whole-head proton spectrum. Otherwise, the sequence shares the same pulses, structure, TE ≈ 0, and TR = 10 seconds with its Fig 2A analog.
The advantage of this approach is that QNAA is obtained every acquisition (ie, for the same signal-to-noise ratio [SNR]), because the NAA nulling requires only half as many averages, therefore half the time. This sequence, however, incurs T1-weighting due to signal-intensity recovery during the TI (∼30% assuming NAA T1 ≈ 1.4 seconds); and its premise that one TI can sufficiently null all the (different) signals of lipids everywhere in the head is known to not always be fulfilled.27 It also implicitly assumes that lipids resulting from pathology within the brain share the same T1 as the skull and adipose tissue in healthy controls.
Whole-Brain NAA Quantification
Absolute quantification for either sequence was performed by phantom replacement against a reference 3-L sphere of 1.5 × 10⁻² mol of NAA in water. Subject and reference NAA peak areas, SS and SR, were obtained by integration of the NAA peak as described elsewhere,18 and QNAA was estimated as,14  1) where
  and
and  are the transmitter voltages into 50 Ω for nonselective 1-ms 180° inversion pulses on the reference and subject, reflecting, by reciprocity, their relative coil loading.28
Note that though the 2 sequences of Fig 2 yield a whole-head 1H spectrum, as shown in Fig 3, both lack explicit spatial localization and rely on the NAA resonance to be implicitly localized by its biochemistry to the brain.4,5 This includes the cerebrum, cerebellum, brain stem, and the upper part of the cervical spine that were inside the head coil. Because the other metabolites (creatine, choline, myo-inositol, glutamate, etc) are present in all other head tissue types, it is impossible to distinguish the contribution of the brain to their signal intensity. Note that the TR ≫ T1 and TE ≈ 0 of either sequence ensure insensitivity to T1 and T2 variations, a desirable feature for absolute quantification, especially in diffuse pathologies, in which neither is likely to be known.
Performance Comparison
The main feature of the lipid-nulling approach of Fig 2B is that it acquires a usable NAA signal intensity every acquisition, as opposed to the older method of Fig 2A that acquires an NAA signal intensity only half the time. Consequently, for an objective comparison, we chose the “equal SNR” paradigm by signal-intensity averaging the same number of NAA signal intensity–bearing transients for each sequence: 16 for the NAA nulling of Fig 2A versus only 8 (at half the total acquisition time) for the lipid nulling of Fig 2B. Six back-to-back acquisitions were obtained in each session: 3 NAA nulling (Fig 2A), taking 3 × 2.7 ≈ 9 minutes, followed by 3 lipid nullings (Fig 2B) for a total of 3 × 1.3 ≈ 4.5 minutes. These provide a “best-case scenario” for reproducibility assessment because all the instrumental (position, gain, shim) and presumably physiologic parameters are unchanged, allowing gauging the intrinsic component of the variance. The subject was then taken out of the magnet.
To determine the serial component of the variance, we returned the subject into the magnet a few minutes later and the entire previously described protocol was repeated 2 more times (sessions). At approximately 30 minutes per session, the entire protocol took 1 and a half hours per subject. Assuming that a healthy subject's brain physiology is unchanged during such periods, this strategy emphasizes the sensitivity of each sequence to instrumental and positioning variations.
Statistical Analyses
Restricted maximum likelihood was used to estimate 2 within-subject variance components as measures of reproducibility, namely the variation between 1) the mean levels computed for the 3 sets for a single subject (serial variation), and 2) the 3 back-to-back assessments within each of the 3 sessions for a single subject. For this purpose, the data (QNAAs) were normalized by dividing the observations from a given method by the overall mean for that method so that the SDs of the normalized data were equal to the CV of the original data. The model for the normalized data included subject identification and time as random classification factors and method (NAA or lipid nulling) as a fixed factor. Likelihood ratio tests were used to compare the methods with respect to the variance components of the normalized data, thereby testing the difference between methods in terms of the CV on the original measurement scale.
Results
The challenge that the intense signals of lipids presents in whole-head NAA 1H-MR spectroscopy quantification is demonstrated in Fig 1. It displays the real part of a WET water-suppressed nonlocalized 1H spectrum acquired with a 90° effective nutation (13̄31̄). For comparison of the effectiveness of the lipid-suppression performance of the sequences in Fig 2A, -B, the real part of 18 whole-head 1H spectra (3 per session × 3 sessions = 9 for each of the 2 sequences in Fig 2) from the same male volunteer is shown in Fig 3.
The likelihood ratio test from the mixed-model analysis of the normalized within-subject mean levels (of 3 back-to-back measurements) at each of the 3 sessions indicated that the “serial” CV of NAA nulling, 10.6%, is significantly lower than the 19.7% of the lipid nulling approach (P < .03). Similarly, the within-subject back-to-back measurement CV for NAA nulling was significantly lower (P = .012) than the CV for lipid nulling, as summarized in the Table. This implies that the former has significantly less intrinsic variation (CV = 5.8% versus 8.6%).
Restricted maximum-likelihood estimates of the within-subject CV for the 2 methods
Discussion
Regional NAA decline in the CNS is frequently observed with localized 1H-MR spectroscopy in neurologic disorders even when the MR imaging is unremarkable (ie, findings are normal-appearing).5,7,8 Consequently, in many scenarios of possibly diffuse but MR imaging–occult pathology, (eg, in multiple sclerosis, trauma, HIV, neurocancers, and Alzheimer dementia), the whole-brain NAA can add valuable information to the MR imaging.9 This concept motivated the development of a technique to quantify the global NAA concentration in the brain.14 Although achieving this goal, the method comes at the cost of explicit localization and requires over 10 minutes to yield an intraindividual precision of 6%–10%,14 motivating an ongoing search for faster, possibly more precise, alternatives.11
Indeed, both old and new sequences in Fig 2 accomplish their basic design goal of sufficient whole-skull lipid-signal-intensity suppression for quantification of the NAA resonance at 2.02 ppm, as evidenced by comparing Fig 1 with Fig 3. As expected, the lipid-nulling approach achieves this goal at less than half the acquisition time (for the same number of NAA-signal-intensity transients [ie, the same SNR]) of the older NAA-nulling variant. This shorter scanning time was the motivation for this comparison and constitutes an advantage for the sequence in Fig 2B over the older one of 2A.
With respect to the more interesting criterion—the reproducibility—the spectra from either sequence seem similar (compare in Fig 3). With the CV as a quantitative metric to characterize this reproducibility, the back-to-back CVs in the Table represent the best-case scenario of each method (ie, its intrinsic precision threshold). As such, for the same number of transients, NAA nulling significantly outperforms its lipid-nulling alternative, albeit at twice the acquisition time.
The serial measurements represent the more realistic scenario because they also include different head-position and shim characteristics. Therefore, the CVs for the “serial” comparisons are larger than their back-to-back counterparts. In this more important category, NAA nulling also significantly outperforms the precision of lipid nulling, though again at a cost of more than double the total scanning time. We conjecture that the reason the lipid nulling does not perform as well as the NAA-nulling approach may be related to the known27 heterogeneity of the T1s of the lipid (and macromolecule) methyl resonances, which lie directly underneath those of the NAA (compare with Fig 1). Because the NAA-nulling sequence does not rely on nulling the resonances for their suppression, it turns out to be more effective in eliminating their residual signals of the resonances. The empiric, TI = 155 ms, used to null the skull bone marrow and adipose tissue lipid signals in healthy individuals, introduces an implicit assumption that any lipids that are the result of pathologic processes within the brain (eg, due to demyelination)29 share a similar T1 and, consequently, would also be suppressed. The NAA-nulling approach, in contrast, does not make this assumption and would, therefore, not have an adverse quantification consequence if it were found to be incorrect.
Note that the “serial” CVs in the Table each comprise (at least) 2 contributions. The first is their intrinsic variability, characterized by the “back-to-back” (CVback-to-back). Second is the (unknown) contribution of the differences in subject repositioning and shim incurred in all serial studies (CVreposition), which is actually the more interesting metric. Although not measured directly, the CVreposition extent can be estimated from the 2 rows of the Table: With the assumption that the different CVs are independent, adding in quadrature CV2serial = CV2reposition + CV2back-to-back leads to CVreposition = 17.7% for the lipid-nulling approach of Fig 2B versus 8.9% for the NAA nulling of Fig 2A. The latter value is gratifying because it is consistent with the variations ascribed to this method originally14 and in a recent longitudinal study.17 Considering that precision is critical to follow-up studies, we think that a difference of a factor of ×2 is a substantial consideration in weighing speed versus performance, especially for clinical applications.
Footnotes
This work was supported by National Institutes of Health grants EB01015, NS050520, and NS39135.
References
- Received March 6, 2008.
- Accepted after revision April 12, 2008.
- Copyright © American Society of Neuroradiology


